How to make friends with PHPstorm, xDebug and remote branches collected through Docker? Too easy…
Good day, Habr!
A year ago, my process of debugging code in PHP consisted of two lines:
Periodically, of course, I had to use more “complex” constructions:
')
No, that you! I knew that in our time it is not appropriate for a cultural programmer to do this.
But to be honest, I was always afraid of what I did not understand. Including xDebugprinters , in particular, how to configure this whole thing. One day I managed to do it in my car and in a local project - there was no limit to joy. After many months, I ran into a new problem, how to debug in PHPstorm via xDebug, if the project is going remotely by a docker through CI.
If you, like me, are having difficulty setting up different things, welcome under the cat, I will tell you about my experience in setting up the debugging environment with such scary words as Docker, xDebug, CI.
For those who do not like water and want to go directly to the essence of the setting.
I was a little goofy over the cut, I was doing handicraft debugging, not only because I was afraid to set up anything, and not because I was too stupid, but simply because I didn’t need something more convenient. Most of the time I worked on projects locally on my rather powerful computer, and the tasks were not so complicated that the debugging process began to take a fairly weighty position.
At some point, I realized for myself that I was just uncomfortable, and tried to make friends with xDebug and PHPstorm while working on a local project. The trouble is that most of the documentation and guides that I found imply that the person reading them is fairly well versed in the subject area and understands everything, in my case it was not so, and I spent 4-5 on my first xDebug setup hours for 2 pm. It was quite morally difficult, I felt infinitely dull. However, the setup turned out, everything worked!
Yes, it became more convenient, locally at home, but at the main work I worked on sites remotely, and more often I did not have the opportunity either to unload the site locally (due to a weak machine or the inconvenient deployment process), or to influence the server settings due to hosting, so I made edits “live” and debugged through html-commenting on print_r (at that work it was “normal”, although I am not proud of this experience).

However, 3 months ago I moved to a cooler company and began to engage in a really serious project with a high load. And here a lot has changed for me. The infrastructure and development process are approximately the following: there is a GitLab server, each project has its own repository, tasks come to Jira, create a branch by task numbers, when creating a branch using CI, your sandbox automatically creates a site where you work quietly, each push reassembles the branch, at the end of the work you give it to the code review, pour the branch into the master.
Everything is cool except for one BUT, each reassembly of a branch in my case takes about 10 seconds. In the process of development itself, this is an insignificant time, since I have already passed that stage, when I had to check the performance of the code almost every line due to uncertainty and little experience. However, when I switched to debugging, these 10 seconds began to play a tangible role. The process of such debugging looked as follows:
By approximate calculations, the ready-to-merge branch had about 20% of useful commits and 80% of debugging commits. Suppose I’ve finished work on a branch with 300 commits, of which 240 commits essentially otzhili 40 minutes of my working time (and this is only the waiting time for the assembly of the branch, not taking into account the seconds that add up in minutes, to add 2 lines and then delete them).

At some point I got tired of it and I decided to set up xDebug to make the debugging process less expensive. Unfortunately, my current colleagues either didn’t use this technology (waiting for a joke about “Found a cool company where no one uses xDebug”), or didn’t know / didn’t remember how to make friends IDE with xDebug, in the case of a branch going remotely via CI, and since I have never devOps and as I mentioned above, the process of setting up something is quite painful for me, it took about 6 hours of pure time to make everything work, and I understood the process, and that would be comfortable enough.
I will not go into details on how to screw CI, Docker, in general, how to build the infrastructure, it is assumed that this is all ready and you just have to configure your personal environment.
Suppose our repository has approximately the following structure:

First we need to check if xDebug itself is in the current image, for this you can use phpinfo ();
If xDebug is already included in the build - fine, if not, then check out this source , which helped me directly in the setup itself, however, I went a little different way.
In order for it to work, we need 2 xDebug settings:
In the final assembly of the remote branch, remote_enable must be included, and the remote_host must be assigned the IP of your computer on the network. Let's enable these settings in our build.
First you need to know where the php settings are stored, they can be located either in /usr/local/etc/php/conf.d/php.ini , or the .ini file itself can be named differently, in my case it is / usr / local / etc / php / conf.d / php-settings.ini . You can find out from the settings of the collected image.
We create our additional settings in our branch through the same file php-settings.ini, and arrange it in ./build_env/php/php-settings.ini
We register in it 2 above-mentioned settings:
Next we need to add this file to the “parent” image settings. I do this through volumes by adding lines to the ./build_env/docker-compose/docker-compose.tmpl line:
Something like this in the end is the docker-compose.tmpl in my project:

On the next build of the branch, you can check whether the new settings are attached using the same phpinfo (); , if yes - fine, if not - you are unlucky and have to go the same way that I did the first time: (
Next you need to configure PHPstorm itself. I decided not to use DBgp Proxy, so as not to configure the mappings in the pop-up window every time. In my case, I use a server template that will contain the necessary mappings.
Go to Settings / Preferences | Languages & Frameworks | PHP | Servers
We save these settings, we will change them every time we work with a new branch. For example, if today I work with the web-2233 branch, then I will change the mapping to / var / www / builds / path_to_building / web-2233
Now quite important and not the most obvious point. When we start debugging, PHPstorm needs to understand which local files correspond to the files on the remote server. If the server did not give it a specific installation, a pop-up window will appear in which you need to manually add the corresponding paths. In order for PHPstorm to immediately take mappings from a server called BRANCH, you need to add the environment variable PHP_IDE_CONFIG to our assembly
In ./build_env/docker-compose/docker-compose.tmpl create a new environment variable in the environment:
In .gitlab-ci.yml we set this variable:
We do not need browser extensions; you do not need to pass the URL XDEBUG_SESSION_START = IDE_KEY to the get parameters; you do not need to add additional configurations.
Simply turn on the tapping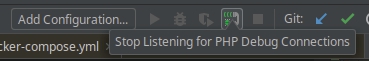 and refresh the site page as soon as we bump into the first breakpoint, the application will stop running on it
Thank you for your attention, I hope this article will be useful and someone will save time without stepping on the same rake as I :)
Sources that I used during the initial setup:
https://gist.github.com/chadrien/c90927ec2d160ffea9c4
https://confluence.jetbrains.com/display/PhpStorm/Docker+Support+in+PhpStorm#DockerSupportinPhpStorm-DebuggingthePHPwebapplicationrunningintheDockercontainer
A year ago, my process of debugging code in PHP consisted of two lines:
var_dump($variable); die(); Periodically, of course, I had to use more “complex” constructions:
')
console.log(data); echo json_encode($variable, JSON_UNESCAPED_UNICODE); exit(); No, that you! I knew that in our time it is not appropriate for a cultural programmer to do this.
ancient craft
joke about another most ancient craft
But to be honest, I was always afraid of what I did not understand. Including xDebug
If you, like me, are having difficulty setting up different things, welcome under the cat, I will tell you about my experience in setting up the debugging environment with such scary words as Docker, xDebug, CI.
For those who do not like water and want to go directly to the essence of the setting.
Why it is worth getting away from moldy debugging methods and switching to adequate technologies?
I was a little goofy over the cut, I was doing handicraft debugging, not only because I was afraid to set up anything, and not because I was too stupid, but simply because I didn’t need something more convenient. Most of the time I worked on projects locally on my rather powerful computer, and the tasks were not so complicated that the debugging process began to take a fairly weighty position.
At some point, I realized for myself that I was just uncomfortable, and tried to make friends with xDebug and PHPstorm while working on a local project. The trouble is that most of the documentation and guides that I found imply that the person reading them is fairly well versed in the subject area and understands everything, in my case it was not so, and I spent 4-5 on my first xDebug setup hours for 2 pm. It was quite morally difficult, I felt infinitely dull. However, the setup turned out, everything worked!
Yes, it became more convenient, locally at home, but at the main work I worked on sites remotely, and more often I did not have the opportunity either to unload the site locally (due to a weak machine or the inconvenient deployment process), or to influence the server settings due to hosting, so I made edits “live” and debugged through html-commenting on print_r (at that work it was “normal”, although I am not proud of this experience).
However, 3 months ago I moved to a cooler company and began to engage in a really serious project with a high load. And here a lot has changed for me. The infrastructure and development process are approximately the following: there is a GitLab server, each project has its own repository, tasks come to Jira, create a branch by task numbers, when creating a branch using CI, your sandbox automatically creates a site where you work quietly, each push reassembles the branch, at the end of the work you give it to the code review, pour the branch into the master.
Everything is cool except for one BUT, each reassembly of a branch in my case takes about 10 seconds. In the process of development itself, this is an insignificant time, since I have already passed that stage, when I had to check the performance of the code almost every line due to uncertainty and little experience. However, when I switched to debugging, these 10 seconds began to play a tangible role. The process of such debugging looked as follows:
- I add 2 lines
- Push commit
- Wait 10 seconds
- Check, see what is wrong
- Repeat
By approximate calculations, the ready-to-merge branch had about 20% of useful commits and 80% of debugging commits. Suppose I’ve finished work on a branch with 300 commits, of which 240 commits essentially otzhili 40 minutes of my working time (and this is only the waiting time for the assembly of the branch, not taking into account the seconds that add up in minutes, to add 2 lines and then delete them).
At some point I got tired of it and I decided to set up xDebug to make the debugging process less expensive. Unfortunately, my current colleagues either didn’t use this technology (waiting for a joke about “Found a cool company where no one uses xDebug”), or didn’t know / didn’t remember how to make friends IDE with xDebug, in the case of a branch going remotely via CI, and since I have never devOps and as I mentioned above, the process of setting up something is quite painful for me, it took about 6 hours of pure time to make everything work, and I understood the process, and that would be comfortable enough.
Setup process
I will not go into details on how to screw CI, Docker, in general, how to build the infrastructure, it is assumed that this is all ready and you just have to configure your personal environment.
Suppose our repository has approximately the following structure:
First we need to check if xDebug itself is in the current image, for this you can use phpinfo ();
If xDebug is already included in the build - fine, if not, then check out this source , which helped me directly in the setup itself, however, I went a little different way.
Configure php.ini
In order for it to work, we need 2 xDebug settings:
- xdebug.remote_enable
- xdebug.remote_host
In the final assembly of the remote branch, remote_enable must be included, and the remote_host must be assigned the IP of your computer on the network. Let's enable these settings in our build.
First you need to know where the php settings are stored, they can be located either in /usr/local/etc/php/conf.d/php.ini , or the .ini file itself can be named differently, in my case it is / usr / local / etc / php / conf.d / php-settings.ini . You can find out from the settings of the collected image.
We create our additional settings in our branch through the same file php-settings.ini, and arrange it in ./build_env/php/php-settings.ini
We register in it 2 above-mentioned settings:
xdebug.remote_enable = on
xdebug.remote_host = IP...
Next we need to add this file to the “parent” image settings. I do this through volumes by adding lines to the ./build_env/docker-compose/docker-compose.tmpl line:
- ${PROJECT_DIR}/build_env/php/php-settings.ini:/usr/local/etc/php/conf.d/php-settings.iniSomething like this in the end is the docker-compose.tmpl in my project:
On the next build of the branch, you can check whether the new settings are attached using the same phpinfo (); , if yes - fine, if not - you are unlucky and have to go the same way that I did the first time: (
Configuring mappings in PHPstorm
Next you need to configure PHPstorm itself. I decided not to use DBgp Proxy, so as not to configure the mappings in the pop-up window every time. In my case, I use a server template that will contain the necessary mappings.
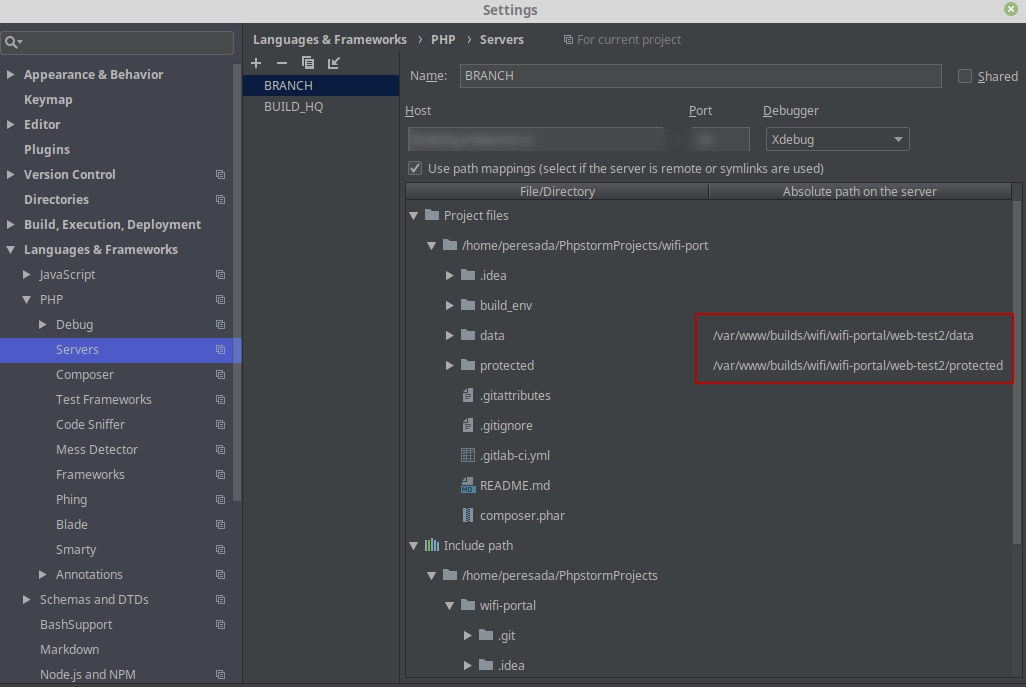
Go to Settings / Preferences | Languages & Frameworks | PHP | Servers
- Create a server template
- Name: BRANCH
- host: any, it does not affect
- port: any, it does not affect
- Debugger: xDebug
- We put a daw on Use path mappings
- We put down the corresponding mappings, the working local folders should correspond to the folders on the server where the collected branches are located, in my case the built builds are located in the / var / www / builds / your_namespace / your_project / your_branch folder
We save these settings, we will change them every time we work with a new branch. For example, if today I work with the web-2233 branch, then I will change the mapping to / var / www / builds / path_to_building / web-2233
Add a new environment variable so that IDE automatically pulls up the mappings
Now quite important and not the most obvious point. When we start debugging, PHPstorm needs to understand which local files correspond to the files on the remote server. If the server did not give it a specific installation, a pop-up window will appear in which you need to manually add the corresponding paths. In order for PHPstorm to immediately take mappings from a server called BRANCH, you need to add the environment variable PHP_IDE_CONFIG to our assembly
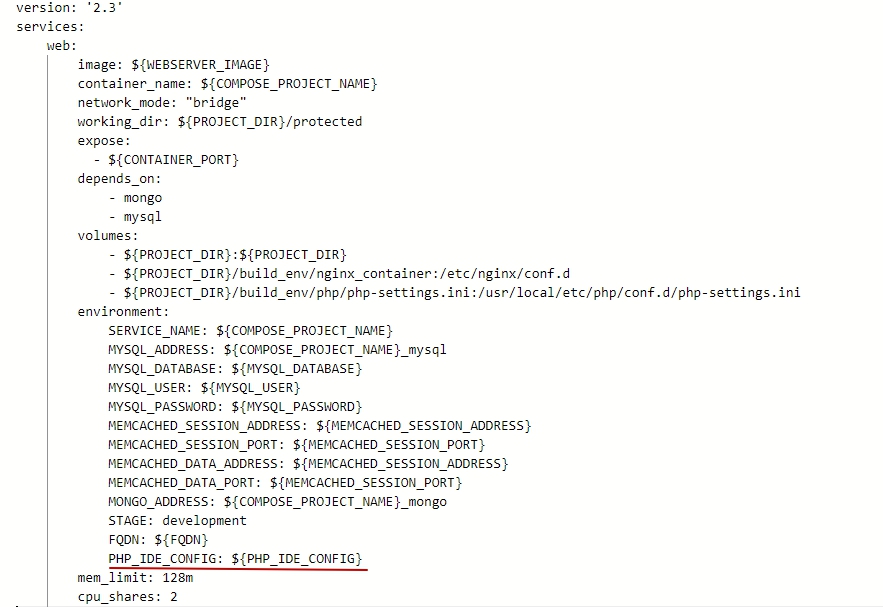
In ./build_env/docker-compose/docker-compose.tmpl create a new environment variable in the environment:
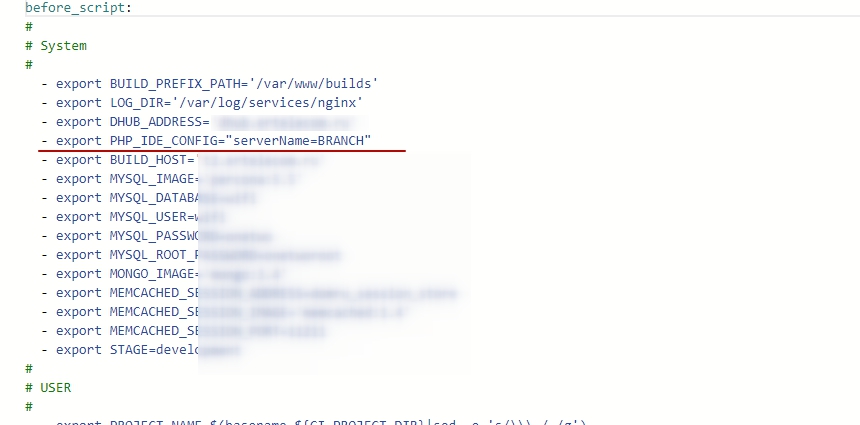
PHP_IDE_CONFIG: ${PHP_IDE_CONFIG}In .gitlab-ci.yml we set this variable:
- export PHP_IDE_CONFIG="serverName=BRANCH"Done!
We do not need browser extensions; you do not need to pass the URL XDEBUG_SESSION_START = IDE_KEY to the get parameters; you do not need to add additional configurations.
Simply turn on the tapping
and refresh the site page as soon as we bump into the first breakpoint, the application will stop running on itThank you for your attention, I hope this article will be useful and someone will save time without stepping on the same rake as I :)
Sources that I used during the initial setup:
https://gist.github.com/chadrien/c90927ec2d160ffea9c4
https://confluence.jetbrains.com/display/PhpStorm/Docker+Support+in+PhpStorm#DockerSupportinPhpStorm-DebuggingthePHPwebapplicationrunningintheDockercontainer
Source: https://habr.com/ru/post/423337/
All Articles