How cash register program will help to save on analytics?

Growth of income and optimization of the range of goods - the challenges facing any store. To solve them, you need to regularly analyze the dynamics and structure of sales. Of course, this can be done easily with the help of CRM-systems. But there are additional expenses hidden: you have to buy software, train the staff to work with it and monitor the accuracy of data entry. In order to avoid these costs, take advantage of the possibilities of the cash program. We tell exactly how it will help save on analytics.
Modern front-office systems accumulate a huge amount of information on sales of goods, on the basis of which it is easy to analyze internal marketing data. Namely:
')
- general analysis of the structure and dynamics of sales;
- analysis of stimulated sales (the effectiveness of the discount program and promotions, the effectiveness of promotional and marketing activities).
Let us understand in more detail how the cash program can form for you useful reports. And we will do this on the example of Pilot’s own design, the Pro-T cash register platform .
Dynamic reports
In Profi-T, all information on sales in the store is stored in the server database, which is updated automatically when each check at the checkout is closed. Therefore, with the help of dynamic reports, it is possible to trace in real time the dynamics of changes in store turnover in monetary and quantitative terms during a cash register shift.

Thus, we can see changes in revenue by the hour, the number of customers passing through the cashier, the average bill and the maximum purchase price.
Summary Reports
Any analyst is interested in comparing data for certain periods: for example, the most popular products among buyers for the past week and the current one. This will help the report "The best products for sales." It is enough to indicate the period of time and the number of top products you are interested in, say, the top ten (top 10). For clarity, the report is supplemented by a chart.
In this way, you can easily plan which products you need to buy or for which products it would be nice to plan a promotion if the task is to increase the turnover.


Weekly summary report with charts
Under the influence of various factors, revenue in alternating periods may fluctuate. To track changes in the amount of sales, the number of purchases, as well as the value of the average check will help "Summary weekly report with charts." To build it, simply specify the desired period. This will help to keep track of the dynamics of changes in store turnover in monetary and quantitative terms.

The user can select the report generation period he is interested in. For example, in the figure it is 2018 and weeks from 27 to 35.

The report is built in the Exel format, and includes data on the requested period - from 27 to 35 weeks of 2018. Having set the same period, but in 2017, we can get the dynamics of changes in indicators and analyze it.
Charts based on the report data perfectly visualize the dynamics of indicators. For example, the amount of sales, their number or the number of buyers.


Uploading product reports to Excel
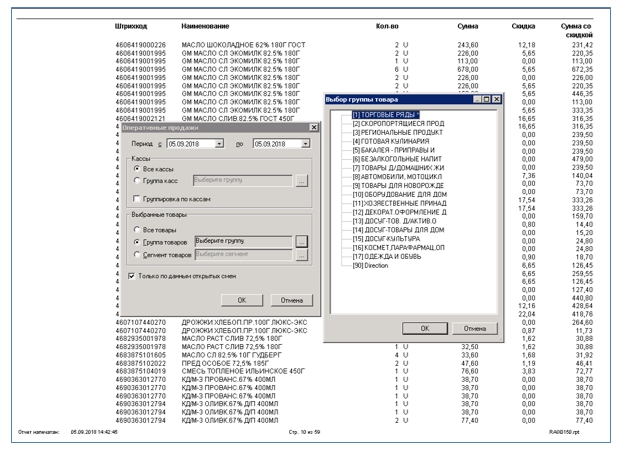
Analysis of internal marketing information in retail for 85-90% consists of processing sales data. Profi-T has a standard mechanism for uploading sales statistics to Excel. These are commodity reports, which can be built for the necessary period (for example, operational day) of time both for the whole nomenclature and for the selected group of goods. Suppose we analyze information on the category of "perishable goods."
When generating a report, the time period of interest, groups and segments of goods are selected.

Having primary sales data, we can get almost any analytics using standard Excel tools. For example, to determine the rate of growth of revenue or variations, and thus assess the stability of sales.

It is equally important to imagine, but what kind of people come to your store? How solvent are they? How much is willing to spend on purchases? To study the portrait of the buyer is easy, it is enough to compare the ranges of the amounts of the shopping basket. With this knowledge, you can plan promotions. Or use them when purchasing products.
In "Profi-T" there is an opportunity to analyze the base of purchases made for a certain period and to receive a report on the number of checks that fall within the specified ranges. For example, find out how many buyers prefer inexpensive goods and collect a basket of 500 rubles or less. Or, on the contrary, take into account how many people make purchases worth more than 5,000 rubles.


Stimulated Sales Analysis
It is not enough just to hold a promotion. For the success of the store you need to carefully analyze its results. This will also be able to help the data obtained through the cash program. One of these reports is “Product Promotion Report”. In order to build it, you need to specify the time period of the action, and then export the data to Excel.

So, to analyze the sales data and not spend money on the CRM-system, and therefore save the budget of the store, it is quite possible. This will help the standard cash register reports, as we saw in the example of the Profi-T cash platform, and the use of the unloading mechanism for sales data from the cash server database in Excel.
By the way, if you need to show reports for management, then they are easy to make presentable and bright. To do this, it is enough to connect from MS SQL to the BI system (for example, as PowerBI - we used in a number of projects. There is its free version, which is quite suitable for solving the tasks of small retailers). Then the reports will be interactive, you can use any visualization. Yes, and access to them will be open on all devices, and your managers will be able to see the reports.
Source: https://habr.com/ru/post/423025/
All Articles