New CNCF Container, Cloud Native and Kubernetes Statistics
CNCF (Cloud Native Computing Foundation), a nonprofit organization behind Kubernetes and other open source infrastructure projects for modern cloud applications, presented the results of its regular survey, which is held twice a year. 2400 people answered questions about the adaptation of cloud native-technologies, more than half of whom use Kubernetes in production.
And in order for the statistics from CNCF to be wider and more interesting, I supplemented its results with data from other organizations ...
')
Portrait of respondents
But for a start, let us examine in more detail who generally answered the questions of the CNCF. Statistics on this subject is:
- Geography: North America (40%), Europe (36%) , Asia (16%) ...
- Company size: more than 5,000 (37%) , 100–499 (16%), 10–49, and 1000–4999 (12% each), 50–99, and 500–999 (7% each) ...
- Role of the respondent: developer (49%), IT operation (36%) , development management (14%), IT manager (11%) ...
- Company activity: technology and software (22% each) , financial services (9%), telecommunications (8%) ...
- Release cycle: automated (42%) , manually (27%), hybrid (25%) ...
- 67% do check-in code many times a day, and the regularity of releases is evenly distributed: from daily (15%) to weekly (20%) and monthly (18%).
- Infrastructure used: public cloud (77%), on premise (64%), private cloud (50%).
Infrastructure and containers in general
What do respondents use to run containers?
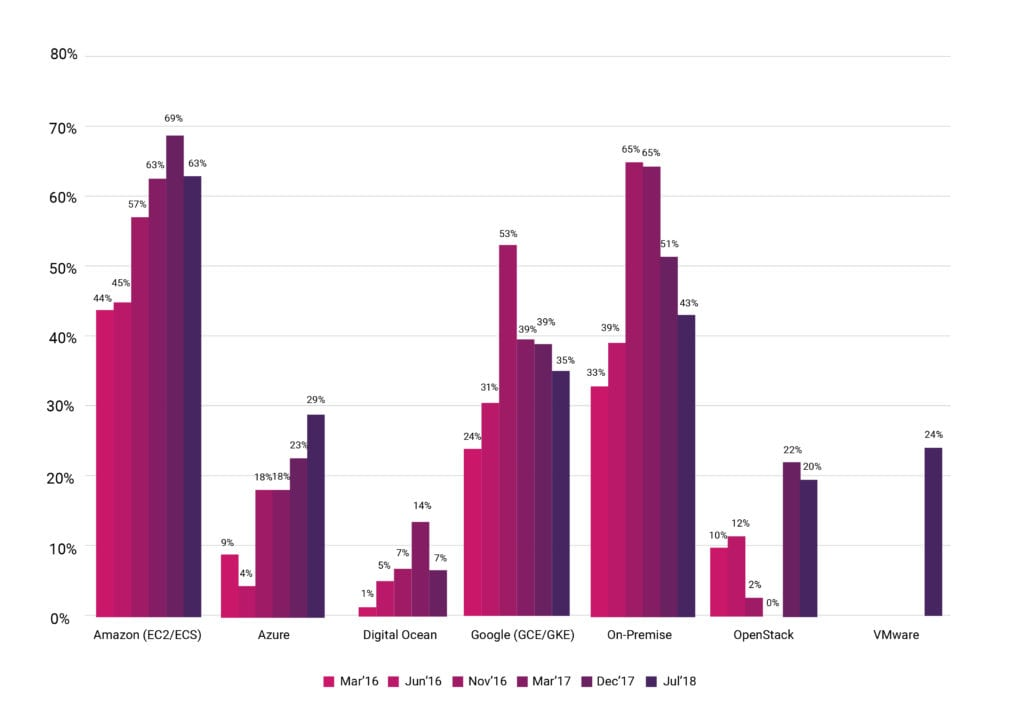
Since CNCF conducts such surveys regularly, the graphs show the chronology of the results, which is of considerable interest.
The most notable trend here is the reduction in the number of on-premise installations (from 65% in November 2016 to 43% now), which is partly attributed to the simultaneous growth in the popularity of private cloud environments. Also, for the first time, CNCF recorded significant popularity of VMware solutions for container launching - in 24% of respondents. Note : unfortunately, it is not completely clear what indicator VMware had in December last year : if the graphics (both new and old) do not mention this option at all, then the accompanying text states that previously there were 12% of users. But the growth in any case is very remarkable.
Note : Further in the article by default (that is, unless otherwise indicated) all comparisons of the percentage increase / decrease are given for the results from the penultimate (December 2017) and the last (July 2018) CNCF polls.
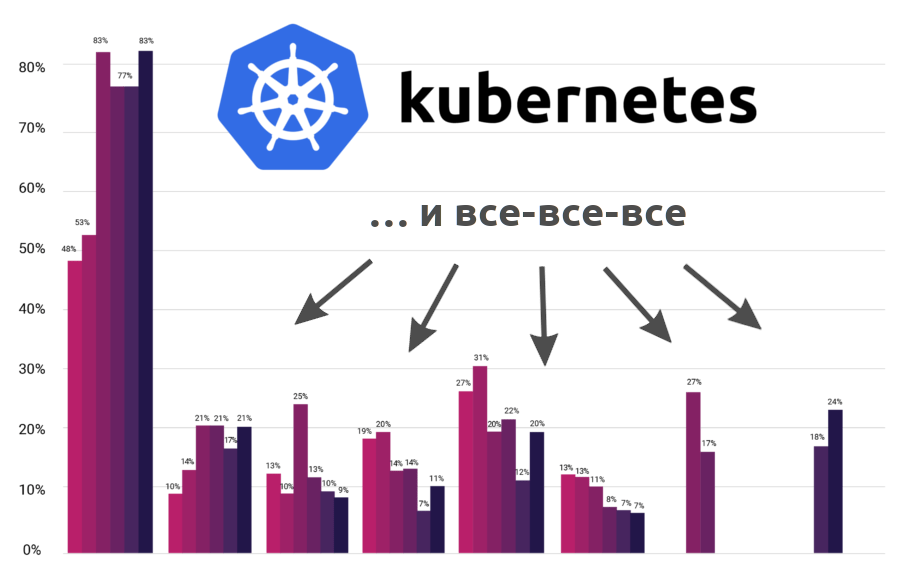
Statistics on the scale of the use of containers over the past six months has practically not changed: 73% of respondents work with them in production , and 89% - as part of the “proof of concept”.

A slight drop in the percentage of container users in the latest results can hardly be considered a trend (but it is worth waiting for the next such study in order to speak more clearly). In the meantime, the consistently high number of companies using containers has been for two years now, and for all purposes: development, testing, proof of concept, and most importantly! - even in production (there’s really nothing to be surprised about that this is the most noticeable growth in the time section).
The undisputed leader in container management tools remains Kubernetes (83%) . Although its popularity does not cause any special doubts, it is still necessary to take into account that the survey is conducted directly by the organization - CNCF. What happens if you search for other research on this topic? For example, the recent Lacework report shows Kubernetes at 78% (based on an analysis of more than 21,000 publicly available cloud hosts, mainly located on AWS):
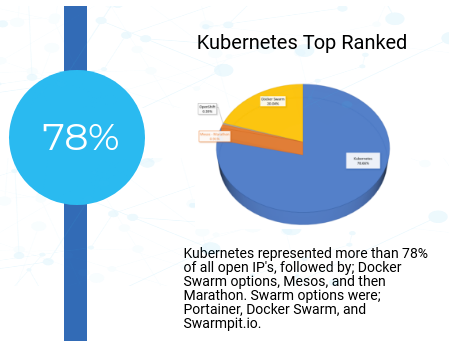
Fragment of infographics created as a result of Lacework research
Kubernetes is the undisputed leader in container orchestration and according to a Sysdig study published May 29:
This is how the distribution of popularity among K8s distributions looks like:
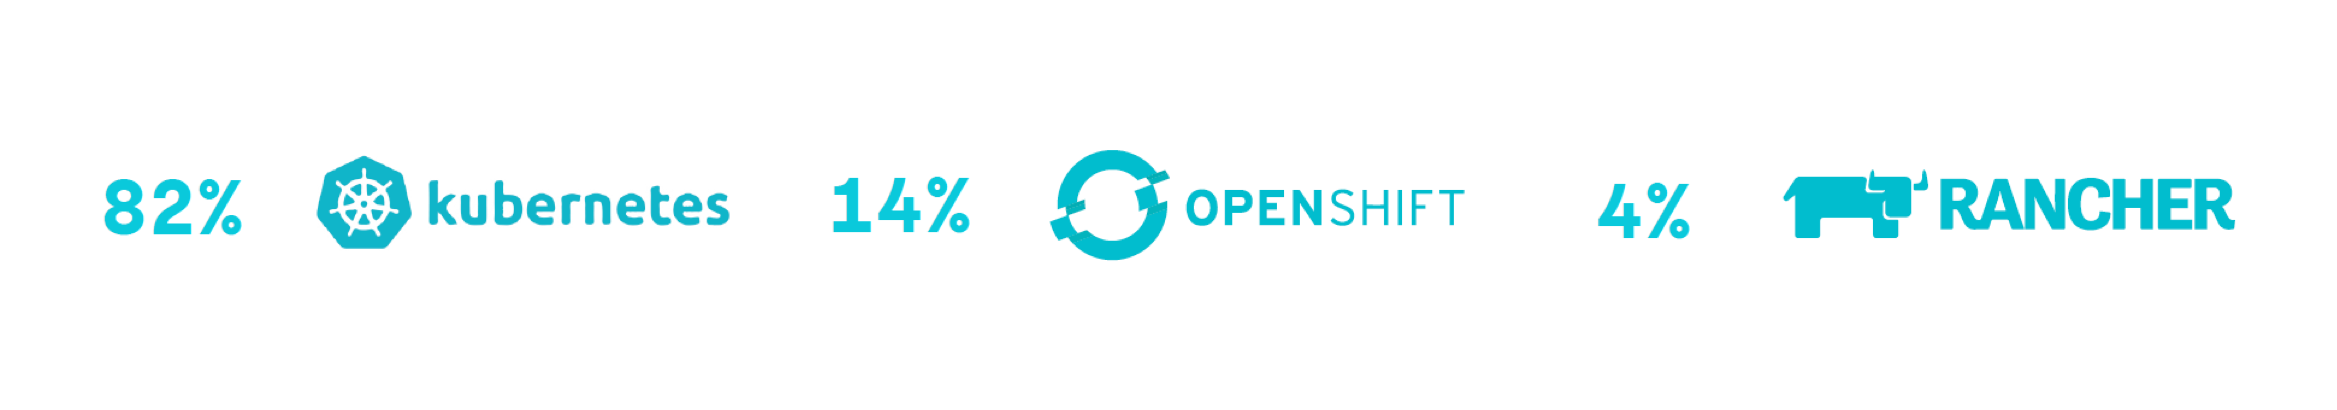
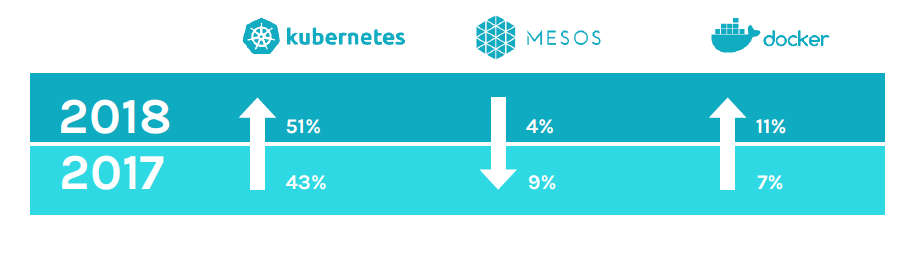
Finally, according to a survey of 200+ visitors of KubeCon 2017, conducted by Platform 9 at the end of last year, the popularity of orchestration systems among them (that is, participants in the largest event dedicated directly to Kubernetes) is:
But back to the statistics of the CNCF. Among the changes in the use of other systems used to orchestrate containers are the decline in the share of OpenStack (27 → 17%), the unexpected rollback of shell scripts to its former popularity (20%, as survey participants voted 2 years ago) and the growth of Amazon ECS (18 → 24%). By the way, the noticeable popularity of the latter is confirmed by statistics from Datadog .
The main difficulties in the use and deploe of containers remained virtually unchanged - one can only note that some purely technical factors became less influential (see explanation below). The current list looks like this:
- changes in the culture of the development team (41%);
- complexity (35 → 40%);
- insufficient training (40%);
- safety (43 → 38%);
- monitoring (38 → 34%);
- storage facilities (41 → 30%);
- networks (38 → 30%);
- logging (32 → 25%).
Using Kubernetes
Kubernetes users in production turned out to be 58% of the respondents, and if we limit respondents to large companies (5000+ employees), this figure drops to 40%.
As much (40%) of all K8s users in production work with 2-5 clusters . Only 1 cluster in 22%, and more than 50 clusters - in 13% (in the last survey, these were 9%).
Statistics on the environments in which Kubernetes is launched are in many ways similar to those for containers (AWS has the most noticeable difference):
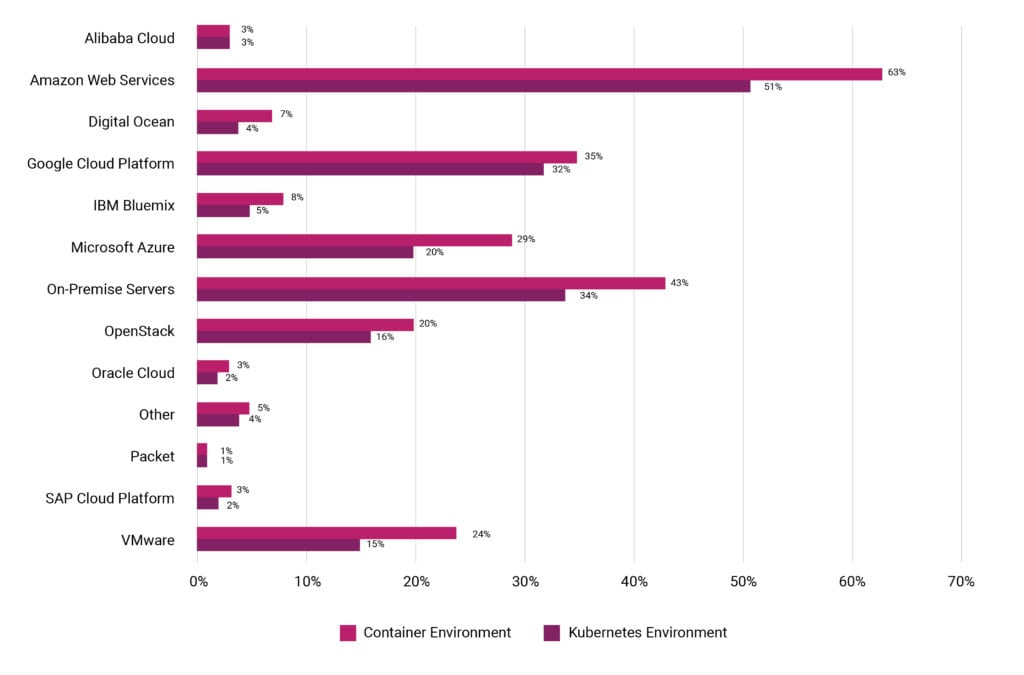
The main trends are identical: the decline in on-premise popularity (51 → 34%) and a significant increase in the share of VMware (1 → 15%).
What installations of Kubernetes are used for local development? Minikube (45%), Docker Kubernetes (39%) and full-featured on-premise clusters (30%).
What else and what is used in K8s?
- In package management, the undisputed leader is Helm (68%), and the closest pursuer is managed services (19%).
- The leading ingress providers are nginx (64%), HAProxy (29%), F5 (15%) and Envoy (15%). The largest growth was recorded in nginx (+ 7% from the previous survey), and also very actively expanding its Envoy user base (+ 6%).
- Most applications use namespaces to separate applications (78%), but 50% prefer separate clusters, and 21% are generally limited to labels. There are similar statistics in the division between different teams: namespaces in 71%, separate clusters - in 51%, only labels - in 15%. (See also the responses of the Kubernetes developers about ways to separate the dev and prod clusters in this article .)
- Why use autoscaling in Kubernetes? 64% are stateless applications, 45% are Java applications, 37% are applications for processing tasks / queues.
Here you can still recall the results of a survey of the Kubernetes project , to which 380 people responded and whose results were summed up in April. In particular, a glance at Helm in it was made from a different perspective and looked like this: "What tools do you use for managing applications in Kubernetes?". Only 4 products scored votes over 10% of votes:
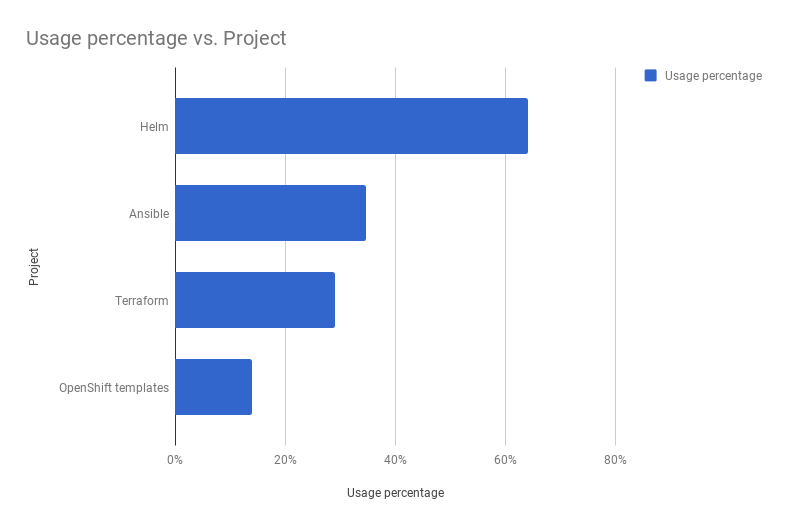
... followed by a huge list of 80+ (!) Utilities.
Other CNCF projects and not only
Many other projects supported by the CNCF have received a truly explosive growth in production use. In particular:
- containerd : 18 → 45%;
- CoreDNS : 7 → 36%;
- Envoy: 4 → 24%;
- Fluentd: 38 → 57%;
- gRPC: 22 → 45%;
- Jaeger: 5 → 25%;
- Linkerd : 3 → 16%;
- OpenTracing: 8 → 21%.
Among the new CNCF projects , the popularity of SPIRE (94% of respondents consider its use), TUF (93%), Open Policy Agent and SPIFFE (92%), Vitess (92%) are noted.
The above-mentioned decrease in the relevance of the repository problem was promoted by the growing popularity of projects such as Rook (29 → 89% of respondents consider its use, and 11% are already used in production), Minio (28 → 73% consider, and 27% have it in production) and OpenSDS (14 → 84% are considered, and in 16% - in production).
Among serverless solutions, a large increase in popularity was recorded in Kubeless (2 → 42%), Apache OpenWhisk (12 → 25%) and OpenFaas (10 → 20%), and AWS Lambda (69%) is the clear favorite among hosted platforms for serverless with the closest pursuers in the form of Google Cloud Functions (25%) and Azure Functions (20%).
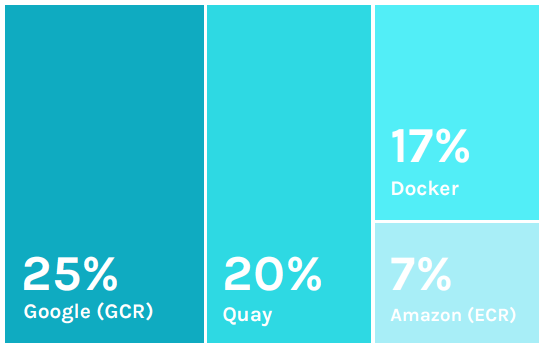
And finally - the popularity of registries for container images from the Sysdig report:
PS
Read also in our blog:
- Statistics The New Stack on the Difficulties of Implementing Kubernetes ;
- “ Kubernetes success stories in production. Part 9: CERN and 210 K8s clusters ;
- “ What famous companies use Docker in production and for what?” ";
- " CNCF Guide to Open Source Solutions (and more) for cloud native ";
- “ How many developers think Continuous Integration is not needed? ".
Source: https://habr.com/ru/post/422949/
All Articles