Determination of the number of floors of the house by its photos without machine learning
In this article I will give, in my opinion, an interesting solution to the problem of computer recognition of objects in an image without the use of training.
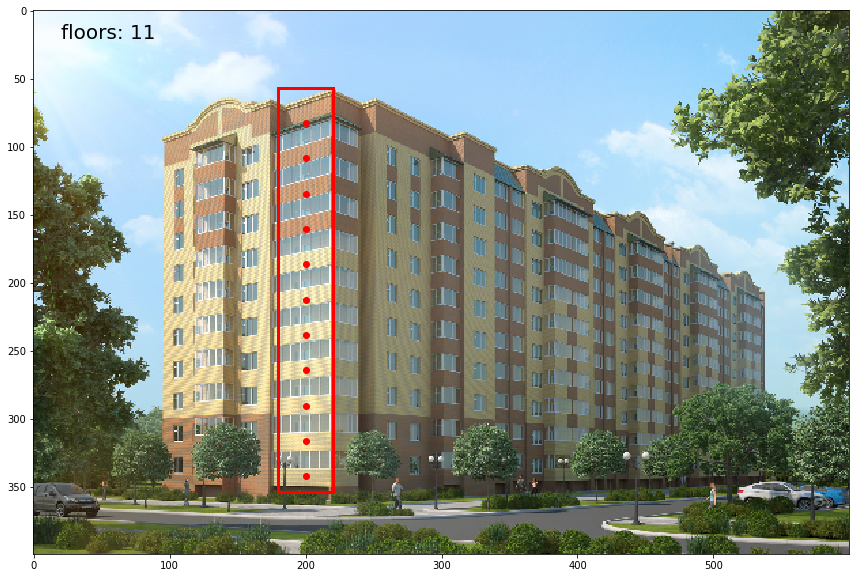
Task: having a photo of a multi-storey building try to determine the number of floors in it.
A good estimate for the number of floors can give the number of windows on the vertical of the house. Windows, balconies and other objects are good characteristics of the floors (especially in residential buildings). I will consider it houses, whose images are easy to find on the network. One important limitation should be noted in advance: the house on the image must be shown completely vertically in order to be able to visually detect all the floors.
The task is rationally divided into two stages:
- Search for a vertical "bar" of windows to be counted. Two subtasks: first, you need to look for the windows in the area of the image occupied by the house, secondly, there are a lot of windows in the houses, to analyze them all does not make sense. It is necessary to distinguish among them the vertical sequence that is best suited for subsequent analysis.
- Determination of the number of floors (windows, or other characteristic objects) on the selected section of the house.
This article is mainly devoted to the first step of the solution. The second step is still under development, but I will also give some results of its solution.
Step 1. Search for a region with windows
The basic idea is that a series of well-distinguishable objects (such as windows) arranged in a row on a house create a periodic sequence of pixel brightness. That is the sequence you need to find. Below are the main steps of the algorithm.
First we translate the image into grayscale and scale it (I used 400x600px pictures)
Fig.1 Original b / w image
Next in the loop:
- The choice on the image is relatively narrow (40px) strip to the full height (Fig.2, the bottom image without dots)
- Averaging the brightness across the width of the strip. It turns out the line w of the distribution of the averaged brightness over the height of the house (Figure 2 upper graph). It has a clearly visible periodic structure, characteristic of the site where there are windows. Shadowed windows are less distinguishable, but this does not hurt.
- Calculates the difference dw of the values of w and w shifted by the distance sh. The search method is used to find such a shift value sh in order to achieve the maximum reduction in the median of the differences dw (Fig. 2, the lower graph).
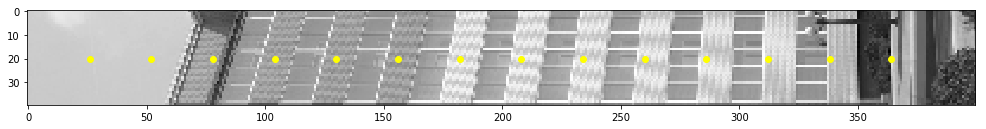

Fig.2 "Strip" windows
However, it is not enough to find the band of the image on which it was possible to lower the median most of all. The fact is that areas with greenery or the sky, at small shear values, can give a greater decrease than windows. But if we construct the dependence of the median value on the shift value for the bands with and without windows, then we can see a key difference: at the shift values close to the height of floors, the chart with windows has well-marked extremes. Thus, it is necessary to measure not the absolute achievable level of the median, but its maximum decrease from the maximum in the process of increasing the shift for each window. This is the key point.
| no windows | with windows |
|---|---|
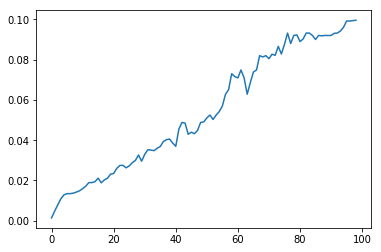 | 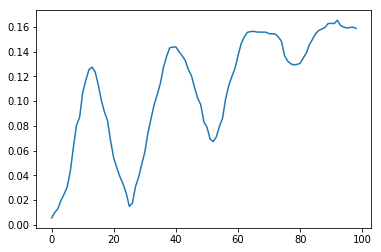 |
Fig.3 Change in the median averaged brightness in with increasing shift
Below is the python3 code with comments.
image = Image.open("raf_data/32.jpg").resize((600,400)) # . img = np.array(image.convert("L"), dtype=float)/255 SEARCH_WIDTH = 40 # x_opt = [0, 1] # : sh_range = range(1,100) # kmax = 0 # for x in range(0, img.shape[1]-SEARCH_WIDTH, int(SEARCH_WIDTH/2)): amax = 0 amin = 1 # for sh in sh_range: # w = img[:,x:x+SEARCH_WIDTH].mean(axis=1) aim = (pd.DataFrame(w)-pd.DataFrame(w).shift(sh))[sh:].abs().median().values[0] # aim sh if aim>amax: amax = aim amin = amax if aim<amin: amin = aim aim_k = amax/amin if aim_k>kmax: x_opt = [x, sh, w] kmax = aim_k print(' : {0}, : {1}'.format(x_opt[0], x_opt[1])) In Fig.2 the points are placed at the distance of the found shift. As you can see, they mark each window well. Those. we already know the height of the floor!
The considered algorithm not bad finds regular zones on the facades of the most different residential buildings (Fig.4).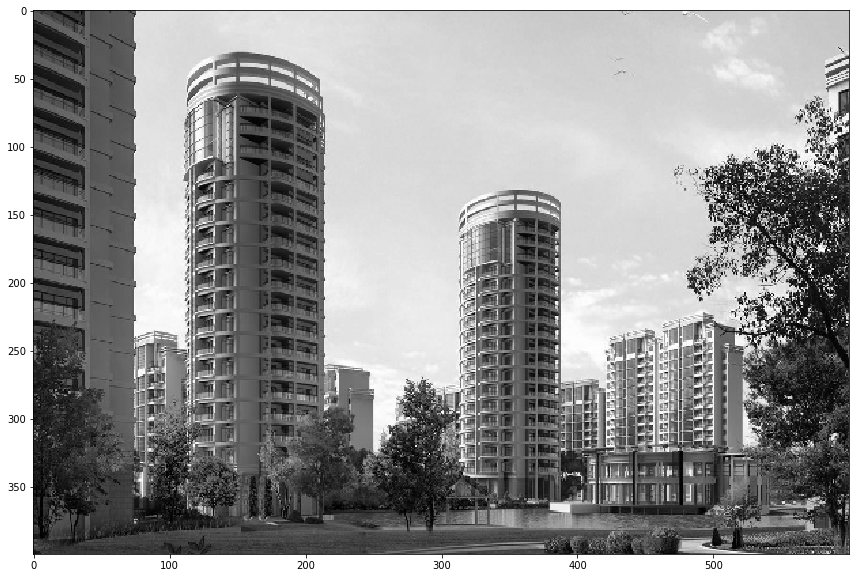
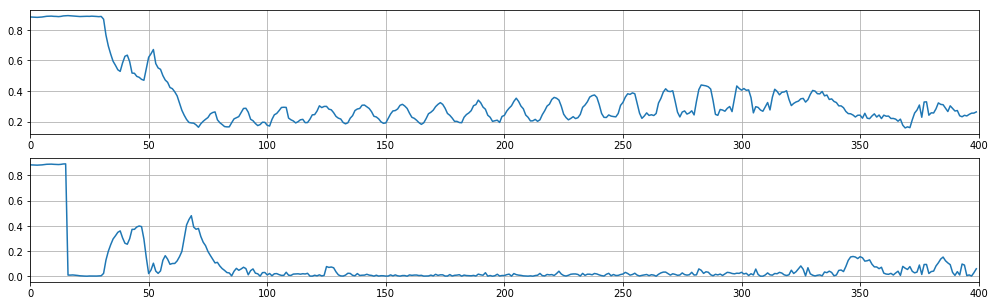

Fig.4 Example
Step 2. Counting the number of floors
At this step, the main difficulties begin. Further actions may be as follows:
- Evaluate the height of the house by analyzing the curve of differences in average brightness or using machine learning). Divide the height of the house by the height of the floor and get the number of floors.
- In the window found in the first step, search for objects that look like windows and count them directly, for example, by special points.
It seems natural to try the first method first: once the height of the floors is known, it remains to determine the height of the house. However, schemes similar to those given in step 1 turn out to be poorly suitable for determining the height of the house, taking into account all possible boundaries and transitions. In some cases, it is possible to get good examples of work, but for a consistently good result, we need approaches using machine learning.
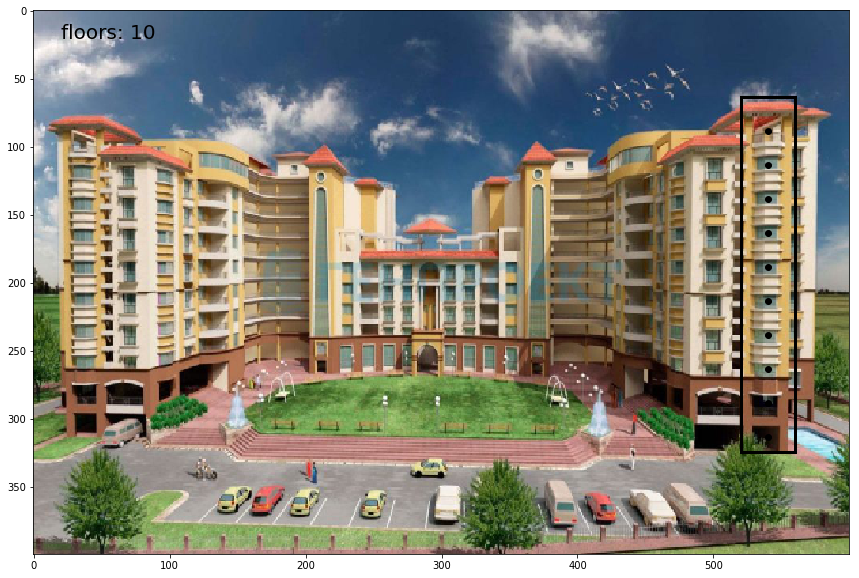
Fig.5 Determining the height of the house using a random forest
')
Source: https://habr.com/ru/post/422867/
All Articles