Designing dashboards for web analytics e-commerce site. Part 2: Email newsletters. Operational Dashboard
The operational mailing list dashboards will reflect the financial indicators and indicators from the ESP system for each of the promotional mailings and aggregated data broken down by months for trigger letters. First you have to figure out how to set up data tracking.

Data, you do not leave us!
As an ESP service, we take Unisender. This service allows you to do a limited set of uploads: you cannot receive all the data on mailings for a period at once, you can only download data for each mailing list. Not everyone is comfortable working with the API, so we will use the manual upload of mailing data. Having learned to analyze mailings sent to Unisender, there will be no problems with other services.
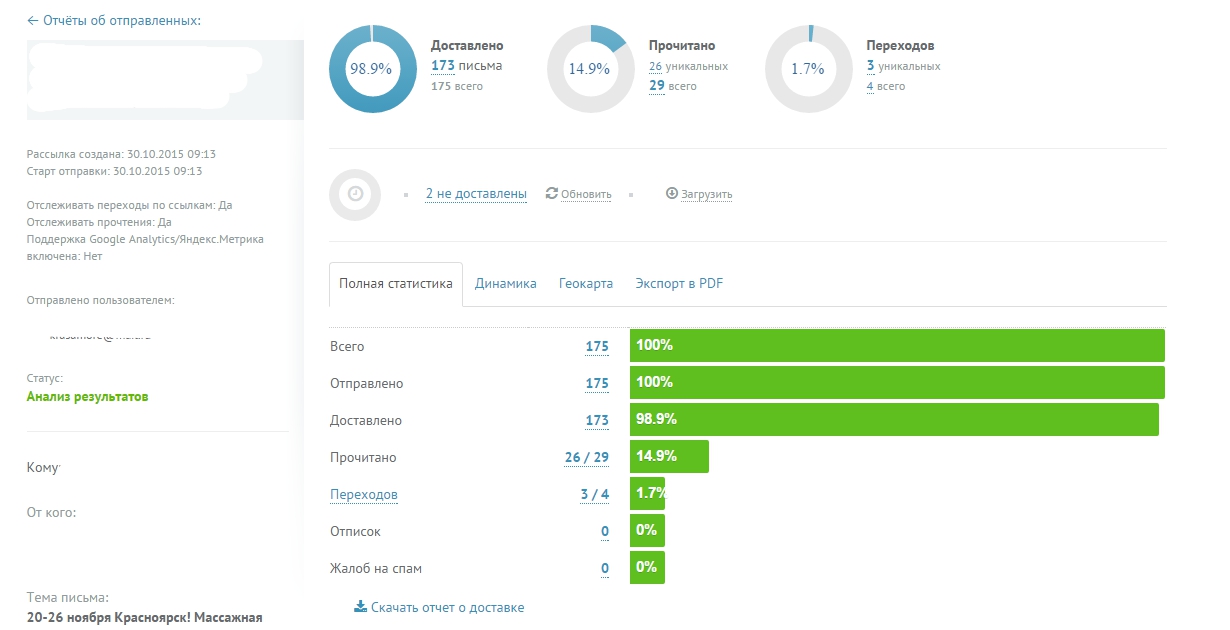
Report on the sent letter
')
We send trigger and promotional letters. For promotional letters we keep statistics in the following form:
For trigger letters to collect statistics on each letter labor-intensive - we can send and 10-20 such letters per day. There is no need to track daily statistics on trigger letters - you just need to check if we are sending such letters, or if something is broken. On them will be enough monthly reporting collection. For trigger mailings we will keep statistics in this form:
These data can be obtained by unloading from Unisender a summary report on the trigger letter on the 1st day of the month and on the 1st day of the next month and subtracting some values from others.
For the purposes of the operational report, we need to estimate the revenue and conversion rate from each letter from the promotional mailings and from each trigger letter monthly. To combine data on sessions and transactions from counters of online statistics systems and our data from the ESP system, we use a bunch of utm tags.
Each promotion we mark up with a unique campaign identifier, which is assigned by the ESP-service itself. By this identifier we associate the data about the sessions with the data about sending letters. In order to bind the data on the revenue, we need to assign the order source from the online statistics counter to each order from the unloading from CRM, linking the data to the order number. Next, carry out a bundle of data on the unique identifier of email campaigns from ESP with data from CRM.

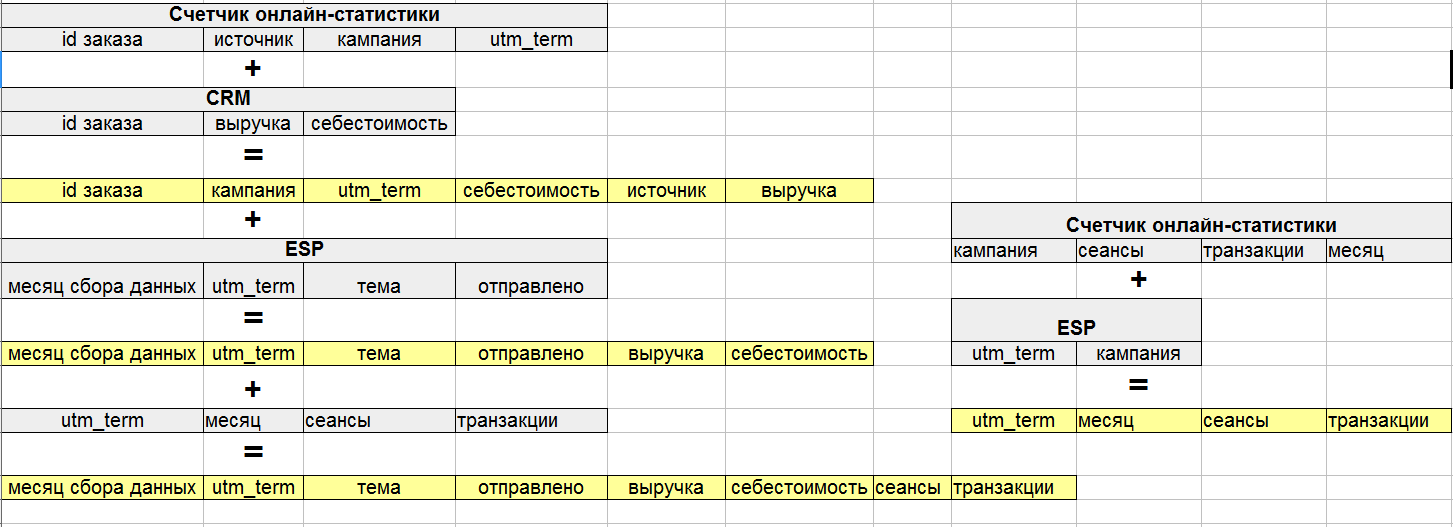
Promotional Data Model
Question to think about . We can bind to the mailing list the data only on those sessions that occurred on the day of the mailing, and we can bind the data on all the sessions that occurred from this mailing list. I bind data on all sessions from the mailing list to take into account all the repeated sessions that this mailing generated.
We label each trigger list with a unique campaign identifier and a unique name. For example, we send a letter to an abandoned basket and a letter to an abandoned view. Then such letters will have different campaign numbers in utm_campaign, and in utm_term we will manually register the name of the letters, abandon_cart and abandon_view, respectively. To bind sessions and transactions from the statistics and revenues counter from CRM, we will use unique campaign numbers, and for the total binding of this data to the upload from ESP by months, we will use utm_term.
The trigger data model
The received operational report on mailing lists reflects the data for each mailing (promo and trigger), the dynamics of indicators from month to month in a section on the topic of mailing, type of content.

Promo Report

Report Trigger Mailings
Articles from the cycle
Data, you do not leave us!
How to track mailings?
As an ESP service, we take Unisender. This service allows you to do a limited set of uploads: you cannot receive all the data on mailings for a period at once, you can only download data for each mailing list. Not everyone is comfortable working with the API, so we will use the manual upload of mailing data. Having learned to analyze mailings sent to Unisender, there will be no problems with other services.
Report on the sent letter
')
We send trigger and promotional letters. For promotional letters we keep statistics in the following form:
- Mailing Date
- Mailing time
- Topic of the letter
- Content
- UTM tags
- Sent
- Delivered
- Unique discoveries
- Unique transitions
- Replies
- Add to spam
For trigger letters to collect statistics on each letter labor-intensive - we can send and 10-20 such letters per day. There is no need to track daily statistics on trigger letters - you just need to check if we are sending such letters, or if something is broken. On them will be enough monthly reporting collection. For trigger mailings we will keep statistics in this form:
- Monthly Newsletter
- Subject
- UTM tags
- Delivered
- Read
- Transitions
These data can be obtained by unloading from Unisender a summary report on the trigger letter on the 1st day of the month and on the 1st day of the next month and subtracting some values from others.
For the purposes of the operational report, we need to estimate the revenue and conversion rate from each letter from the promotional mailings and from each trigger letter monthly. To combine data on sessions and transactions from counters of online statistics systems and our data from the ESP system, we use a bunch of utm tags.
We collect data on promotional newsletters
Each promotion we mark up with a unique campaign identifier, which is assigned by the ESP-service itself. By this identifier we associate the data about the sessions with the data about sending letters. In order to bind the data on the revenue, we need to assign the order source from the online statistics counter to each order from the unloading from CRM, linking the data to the order number. Next, carry out a bundle of data on the unique identifier of email campaigns from ESP with data from CRM.
Promotional Data Model
Question to think about . We can bind to the mailing list the data only on those sessions that occurred on the day of the mailing, and we can bind the data on all the sessions that occurred from this mailing list. I bind data on all sessions from the mailing list to take into account all the repeated sessions that this mailing generated.
We collect data on trigger mailings
We label each trigger list with a unique campaign identifier and a unique name. For example, we send a letter to an abandoned basket and a letter to an abandoned view. Then such letters will have different campaign numbers in utm_campaign, and in utm_term we will manually register the name of the letters, abandon_cart and abandon_view, respectively. To bind sessions and transactions from the statistics and revenues counter from CRM, we will use unique campaign numbers, and for the total binding of this data to the upload from ESP by months, we will use utm_term.
The trigger data model
Operational report
The received operational report on mailing lists reflects the data for each mailing (promo and trigger), the dynamics of indicators from month to month in a section on the topic of mailing, type of content.
Promo Report
Report Trigger Mailings
Articles from the cycle
Source: https://habr.com/ru/post/422825/
All Articles