MongoDB and IT Job Market Research
Have you ever analyzed vacancies?
One wondered what technologies are the strongest needs of the labor market at the moment? Month ago? A year ago?
How often are new job openings by Java developers in a particular area of your city and how actively are they closing?
')
In this article I will tell you how you can achieve the desired result and build a reporting system on a topic of interest to us. Go!

A source
Probably many of you are familiar and even used such a resource as Headhunter.ru . Thousands of new vacancies in various fields are posted daily on this site. Also, HeadHunter has an API that allows the developer to interact with the data of this resource.
Using a simple example, let us consider the construction of the data acquisition process for the reporting system, which is based on the work with the Headhunter.ru site API. We will use the embedded SQLite DBMS as an intermediate storage of information, we will store the processed data in the MongoDB database in NoSQL, and the main language will be Python version 3.4.
But what if we need to conduct more complex data analysis? This is where the MongoDB NoSQL document-oriented database, which allows you to store data in JSON format, comes to the rescue.
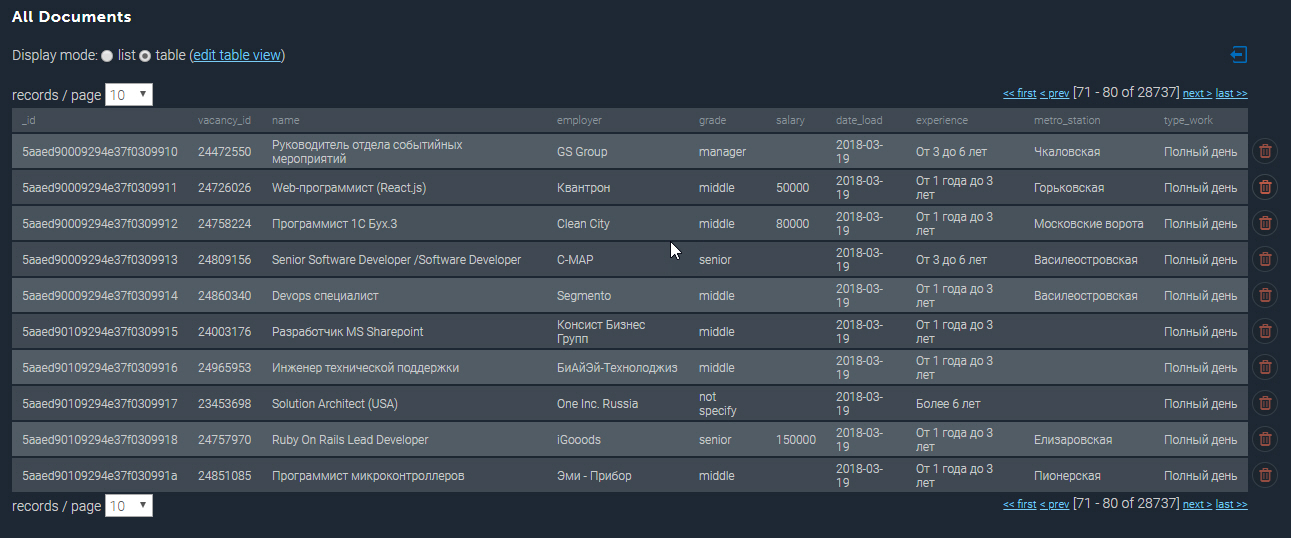
The completed collection in MongoDB looks something like this:
Having a collected database, we can perform various analytical samples. So, I’ll bring out the Top 10 highest paid jobs for Python developers in St. Petersburg:
And now we will deduce, near which metro station is the highest concentration of vacant posts for Java developers. With the help of a regular expression, I filter by vacancy name “Java”, and also select only those vacancies that contain the address:
So, the analytical capabilities of the developed system are truly broad and can be used for planning a startup or opening a new activity line.
I note that only the basic functionality of the system is presented so far, further development is planned in the direction of analyzing geographical coordinates and predicting the appearance of vacancies in a particular area of the city.
The full source code for this article can be found at the link to my GitHub .
PS Comments on the article are welcome, I will be glad to answer all your questions and get your opinion. Thank!
One wondered what technologies are the strongest needs of the labor market at the moment? Month ago? A year ago?
How often are new job openings by Java developers in a particular area of your city and how actively are they closing?
')
In this article I will tell you how you can achieve the desired result and build a reporting system on a topic of interest to us. Go!
A source
The choice fell on Headhunter.ru
Probably many of you are familiar and even used such a resource as Headhunter.ru . Thousands of new vacancies in various fields are posted daily on this site. Also, HeadHunter has an API that allows the developer to interact with the data of this resource.
Tools
Using a simple example, let us consider the construction of the data acquisition process for the reporting system, which is based on the work with the Headhunter.ru site API. We will use the embedded SQLite DBMS as an intermediate storage of information, we will store the processed data in the MongoDB database in NoSQL, and the main language will be Python version 3.4.
HH API
The capabilities of the HeadHunter API are quite extensive and well documented in the official GitHib documentation. First of all, it is the ability to send anonymous requests that do not require authorization to receive information about vacancies in JSON format. Recently, a number of methods became paid (employer's methods), but they will not be considered in this task.
Each vacancy hangs on the site for 30 days, after which, if it is not renewed, it is archived. If the vacancy got into the archive before the expiration of 30 days, it means that it was closed by the employer.
HeadHunter API (hereinafter - HH API) allows you to receive an array of published vacancies for any date in the last 30 days, which we will use - we will collect published vacancies on a daily basis for each day.
Implementation
- Connecting SQLite DB
import sqlite3 conn_db = sqlite3.connect('hr.db', timeout=10) c = conn_db.cursor() - Table for storing vacancy status changes
For convenience, we will keep the history of the vacancy status change (availability as of the date) in a special SQLite database table. Thanks to the vacancy_history table , we will be aware of any vacancy on the site, any what dates she was active.c.execute(''' create table if not exists vacancy_history ( id_vacancy integer, date_load text, date_from text, date_to text )''') - Filtering a job sample
There is a limitation on the fact that one request cannot return more than 2000 collections, and since within one day much more vacancies can be published on the site, we can put a filter in the request body, for example: vacancies only in St. Petersburg (area = 2) IT specialization (specialization = 1)path = ("/vacancies?area=2&specialization=1&page={}&per_page={}&date_from={}&date_to={}".format(page, per_page, date_from, date_to)) - Additional selection conditions
The labor market is actively growing and even taking into account the filter, the number of vacancies can exceed 2000, therefore we will establish an additional restriction in the form of a separate launch for each day: vacancies for the first half of the day and vacancies for the second half of the daydef get_vacancy_history(): ... count_days = 30 hours = 0 while count_days >= 0: while hours < 24: date_from = (cur_date.replace(hour=hours, minute=0, second=0) - td(days=count_days)).strftime('%Y-%m-%dT%H:%M:%S') date_to = (cur_date.replace(hour=hours + 11, minute=59, second=59) - td(days=count_days)).strftime('%Y-%m-%dT%H:%M:%S') while count == per_page: path = ("/vacancies?area=2&specialization=1&page={} &per_page={}&date_from={}&date_to={}" .format(page, per_page, date_from, date_to)) conn.request("GET", path, headers=headers) response = conn.getresponse() vacancies = response.read() conn.close() count = len(json.loads(vacancies)['items']) ... # try: c.executemany('INSERT INTO vacancy_history VALUES (?,?,?,?)', collection_for_ins) except sqlite3.DatabaseError as err: print("Error: ", err) else: conn_db.commit() if collection_for_ins: page = page + 1 total = total + count # del(collection_for_ins[:]) hours = hours + 12 count_days = count_days - 1 hours = 0
First use case
Suppose that we are faced with the task of identifying vacancies that were closed for a certain period of time, for example, in July 2018. This is solved as follows: the result of a simple SQL query to the vacancy_history table will return the data we need, which can be passed to the DataFrame for further analysis:
We get the result of this type:
If we want to analyze using Excel or third-party BI tools, then we can upload the vacancy_history table to a csv file for further analysis:
c.execute(""" select a.id_vacancy, date(a.date_load) as date_last_load, date(a.date_from) as date_publish, ifnull(a.date_next, date(a.date_load, '+1 day')) as date_close from ( select vh1.id_vacancy, vh1.date_load, vh1.date_from, min(vh2.date_load) as date_next from vacancy_history vh1 left join vacancy_history vh2 on vh1.id_vacancy = vh2.id_vacancy and vh1.date_load < vh2.date_load where date(vh1.date_load) between :date_in and :date_out group by vh1.id_vacancy, vh1.date_load, vh1.date_from ) as a where a.date_next is null """, {"date_in" : date_in, "date_out" : date_out}) date_in = dt.datetime(2018, 7, 1) date_out = dt.datetime(2018, 7, 31) closed_vacancies = get_closed_by_period(date_in, date_out) df = pd.DataFrame(closed_vacancies, columns = ['id_vacancy', 'date_last_load', 'date_publish', 'date_close']) df.head() We get the result of this type:
| id_vacancy | date_last_load | date_publish | date_close | |
|---|---|---|---|---|
| 0 | 18126697 | 2018-07-09 | 2018-07-09 | 2018-07-10 |
| one | 18155121 | 2018-07-09 | 2018-06-19 | 2018-07-10 |
| 2 | 18881605 | 2018-07-09 | 2018-07-02 | 2018-07-10 |
| 3 | 19620783 | 2018-07-09 | 2018-06-27 | 2018-07-10 |
| four | 19696188 | 2018-07-09 | 2018-06-15 | 2018-07-10 |
# CSV data = c.execute('select * from vacancy_history') with open('vacancy_history.csv','w', newline='') as out_csv_file: csv_out = csv.writer(out_csv_file) csv_out.writerow(d[0] for d in data.description) csv_out.writerows(data.fetchall()) conn_db.close() Heavy artillery
But what if we need to conduct more complex data analysis? This is where the MongoDB NoSQL document-oriented database, which allows you to store data in JSON format, comes to the rescue.
- A demo instance of my MongoDB database is deployed in the mLab cloud service, which allows you to create a database up to 500MB free of charge, which is quite enough to parse the current task. The hr_db database has a collection of Vacancy, to which we establish a connection:
# Mongo from pymongo import MongoClient from pymongo import ASCENDING from pymongo import errors client = MongoClient('mongodb://<db_user>:<dbpassword>@ds115219.mlab.com:15219/hr_db') db = client.hr_db VacancyMongo = db.Vacancy - It is worth noting that the wage level is not always indicated in rubles, therefore for the analysis it is necessary to bring all values to the ruble equivalent. To do this, we extort a collection of dictionaries using the HH API, which contains information about the exchange rate for the current date:
# def get_dictionaries(): conn = http.client.HTTPSConnection("api.hh.ru") conn.request("GET", "https://api.hh.ru/dictionaries", headers=headers) response = conn.getresponse() if response.status != 200: conn.close() conn = http.client.HTTPSConnection("api.hh.ru") conn.request("GET", "https://api.hh.ru/dictionaries", headers=headers) response = conn.getresponse() dictionaries = response.read() dictionaries_json = json.loads(dictionaries) return dictionaries_json - Filling the currency dictionary with current exchange rates:
hh_dictionary = get_dictionaries() currencies = hh_dictionary['currency'] currency_rates = {} for currency in currencies: currency_rates[currency['code']] = currency['rate']
The above actions for collecting vacancies are launched on a daily basis, so there is no need to look through all the vacancies each time and get detailed information on each of them. We will take only those that were received in the last five days.
- Getting an array of jobs for the last 5 days from a SQLite database:
def get_list_of_vacancies_sql(): conn_db = sqlite3.connect('hr.db', timeout=10) conn_db.row_factory = lambda cursor, row: row[0] c = conn_db.cursor() items = c.execute(""" select distinct id_vacancy from vacancy_history where date(date_load) >= date('now', '-5 day') """).fetchall() conn_db.close() return items - Getting an array of jobs for the last five days from MongoDB:
def get_list_of_vacancies_nosql(): date_load = (dt.datetime.now() - td(days=5)).strftime('%Y-%m-%d') vacancies_from_mongo = [] for item in VacancyMongo.find({"date_load" : {"$gte" : date_load}}, {"id" : 1, "_id" : 0}): vacancies_from_mongo.append(int(item['id'])) return vacancies_from_mongo - It remains to find the difference between the two arrays, for those vacancies that are not in MongoDB, to obtain detailed information and write it to the database:
sql_list = get_list_of_vacancies_sql() mongo_list = get_list_of_vacancies_nosql() vac_for_pro = [] s = set(mongo_list) vac_for_pro = [x for x in sql_list if x not in s] vac_id_chunks = [vac_for_pro[x: x + 500] for x in range(0, len(vac_for_pro), 500)] - So, we have an array of new vacancies that we don’t have in MongoDB, we will get detailed information for each of them using a request in the HH API, we will process each document before writing directly to MongoDB:
- We give the value of wages to the ruble equivalent;
- Add to each job a graduation specialist level (Junior / Middle / Senior etc)
All this is implemented in the vacancies_processing function:from nltk.stem.snowball import SnowballStemmer stemmer = SnowballStemmer("russian") def vacancies_processing(vacancies_list): cur_date = dt.datetime.now().strftime('%Y-%m-%d') for vacancy_id in vacancies_list: conn = http.client.HTTPSConnection("api.hh.ru") conn.request("GET", "/vacancies/{}".format(vacancy_id), headers=headers) response = conn.getresponse() if response.status != 404: vacancy_txt = response.read() conn.close() vacancy = json.loads(vacancy_txt) # salary salary = None if 'salary' in vacancy: if vacancy['salary'] != None: ... max_salary = 500000 if salary is not None: salary = int(salary) if salary >= max_salary: salary = max_salary # grade grade = None if 'name' in vacancy: p_grade = '' title = re.sub(u'[^a-z-]+', ' ', vacancy['name'].lower(), re.UNICODE) words = re.split(r'\s{1,}', title.strip()) for title_word in words: title_word = stemmer.stem(title_word) if len(title_word.strip()) > 1: p_grade = p_grade + " " + title_word.strip() if re.search('()|(princip)', p_grade): grade = 'principal' elif re.search('()|(senior)|([f|F]ull)', p_grade): grade = 'senior' ... else: grade = 'not specify' vacancy['salary_processed'] = salary vacancy['date_load'] = cur_date vacancy['grade'] = grade vacancy.pop('branded_description', None) try: post_id = VacancyMongo.insert_one(vacancy) except errors.DuplicateKeyError: print ('Cant insert the duplicate vacancy_id:', vacancy['id']) - Obtaining detailed information by referring to the HH API, preprocessing received
data and inserting them into MongoDB will hold in several streams, with 500 vacancies each:t_num = 1 threads = [] for vac_id_chunk in vac_id_chunks: print('starting', t_num) t_num = t_num + 1 t = threading.Thread(target=vacancies_processing, kwargs={'vacancies_list': vac_id_chunk}) threads.append(t) t.start() for t in threads: t.join()
The completed collection in MongoDB looks something like this:
Some more examples
Having a collected database, we can perform various analytical samples. So, I’ll bring out the Top 10 highest paid jobs for Python developers in St. Petersburg:
cursor_mongo = VacancyMongo.find({"name" : {"$regex" : ".*[pP]ython*"}}) df_mongo = pd.DataFrame(list(cursor_mongo)) del df_mongo['_id'] pd.concat([df_mongo.drop(['employer'], axis=1), df_mongo['employer'].apply(pd.Series)['name']], axis=1)[['grade', 'name', 'salary_processed' ]].sort_values('salary_processed', ascending=False)[:10] Top 10 Python Top Payers
| grade | name | name | salary_processed |
|---|---|---|---|
| senior | Web Team Lead / Architect (Python / Django / React) | Investex Ltd | 293901.0 |
| senior | Senior Python developer in Montenegro | Betmaster | 277141.0 |
| senior | Senior Python developer in Montenegro | Betmaster | 275289.0 |
| middle | Back-End Web Developer (Python) | Soshace | 250000.0 |
| middle | Back-End Web Developer (Python) | Soshace | 250000.0 |
| senior | Lead Python Engineer for a Swiss Startup | Assaia International AG | 250000.0 |
| middle | Back-End Web Developer (Python) | Soshace | 250000.0 |
| middle | Back-End Web Developer (Python) | Soshace | 250000.0 |
| senior | Python teamlead | Digitalhr | 230000.0 |
| senior | Lead Developer (Python, PHP, Javascript) | IK GROUP | 220231.0 |
And now we will deduce, near which metro station is the highest concentration of vacant posts for Java developers. With the help of a regular expression, I filter by vacancy name “Java”, and also select only those vacancies that contain the address:
cursor_mongo = VacancyMongo.find({"name" : {"$regex" : ".*[jJ]ava[^sS]"}, "address" : {"$ne" : None}}) df_mongo = pd.DataFrame(list(cursor_mongo)) df_mongo['metro'] = df_mongo.apply(lambda x: x['address']['metro']['station_name'] if x['address']['metro'] is not None else None, axis = 1) df_mongo.groupby('metro')['_id'] \ .count() \ .reset_index(name='count') \ .sort_values(['count'], ascending=False) \ [:10] Jobs Java-developers for metro stations
| metro | count |
|---|---|
| Vasileostrovskaya | 87 |
| Petrogradskaya | 68 |
| Vyborg | 46 |
| Lenin Square | 45 |
| Gorky | 45 |
| Chkalovskaya | 43 |
| Narva | 32 |
| Square Rebellion | 29 |
| Old village | 29 |
| Elizarovskaya | 27 |
Results
So, the analytical capabilities of the developed system are truly broad and can be used for planning a startup or opening a new activity line.
I note that only the basic functionality of the system is presented so far, further development is planned in the direction of analyzing geographical coordinates and predicting the appearance of vacancies in a particular area of the city.
The full source code for this article can be found at the link to my GitHub .
PS Comments on the article are welcome, I will be glad to answer all your questions and get your opinion. Thank!
Source: https://habr.com/ru/post/422627/
All Articles