How to effectively use the meeting room with the help of the Internet of things?
In July, we opened our own technology and exhibition hub in Moscow - the Center for Digital Leadership. This is a new venue for events, demonstration of new innovative scenarios, developed jointly with SAP customers and partners.
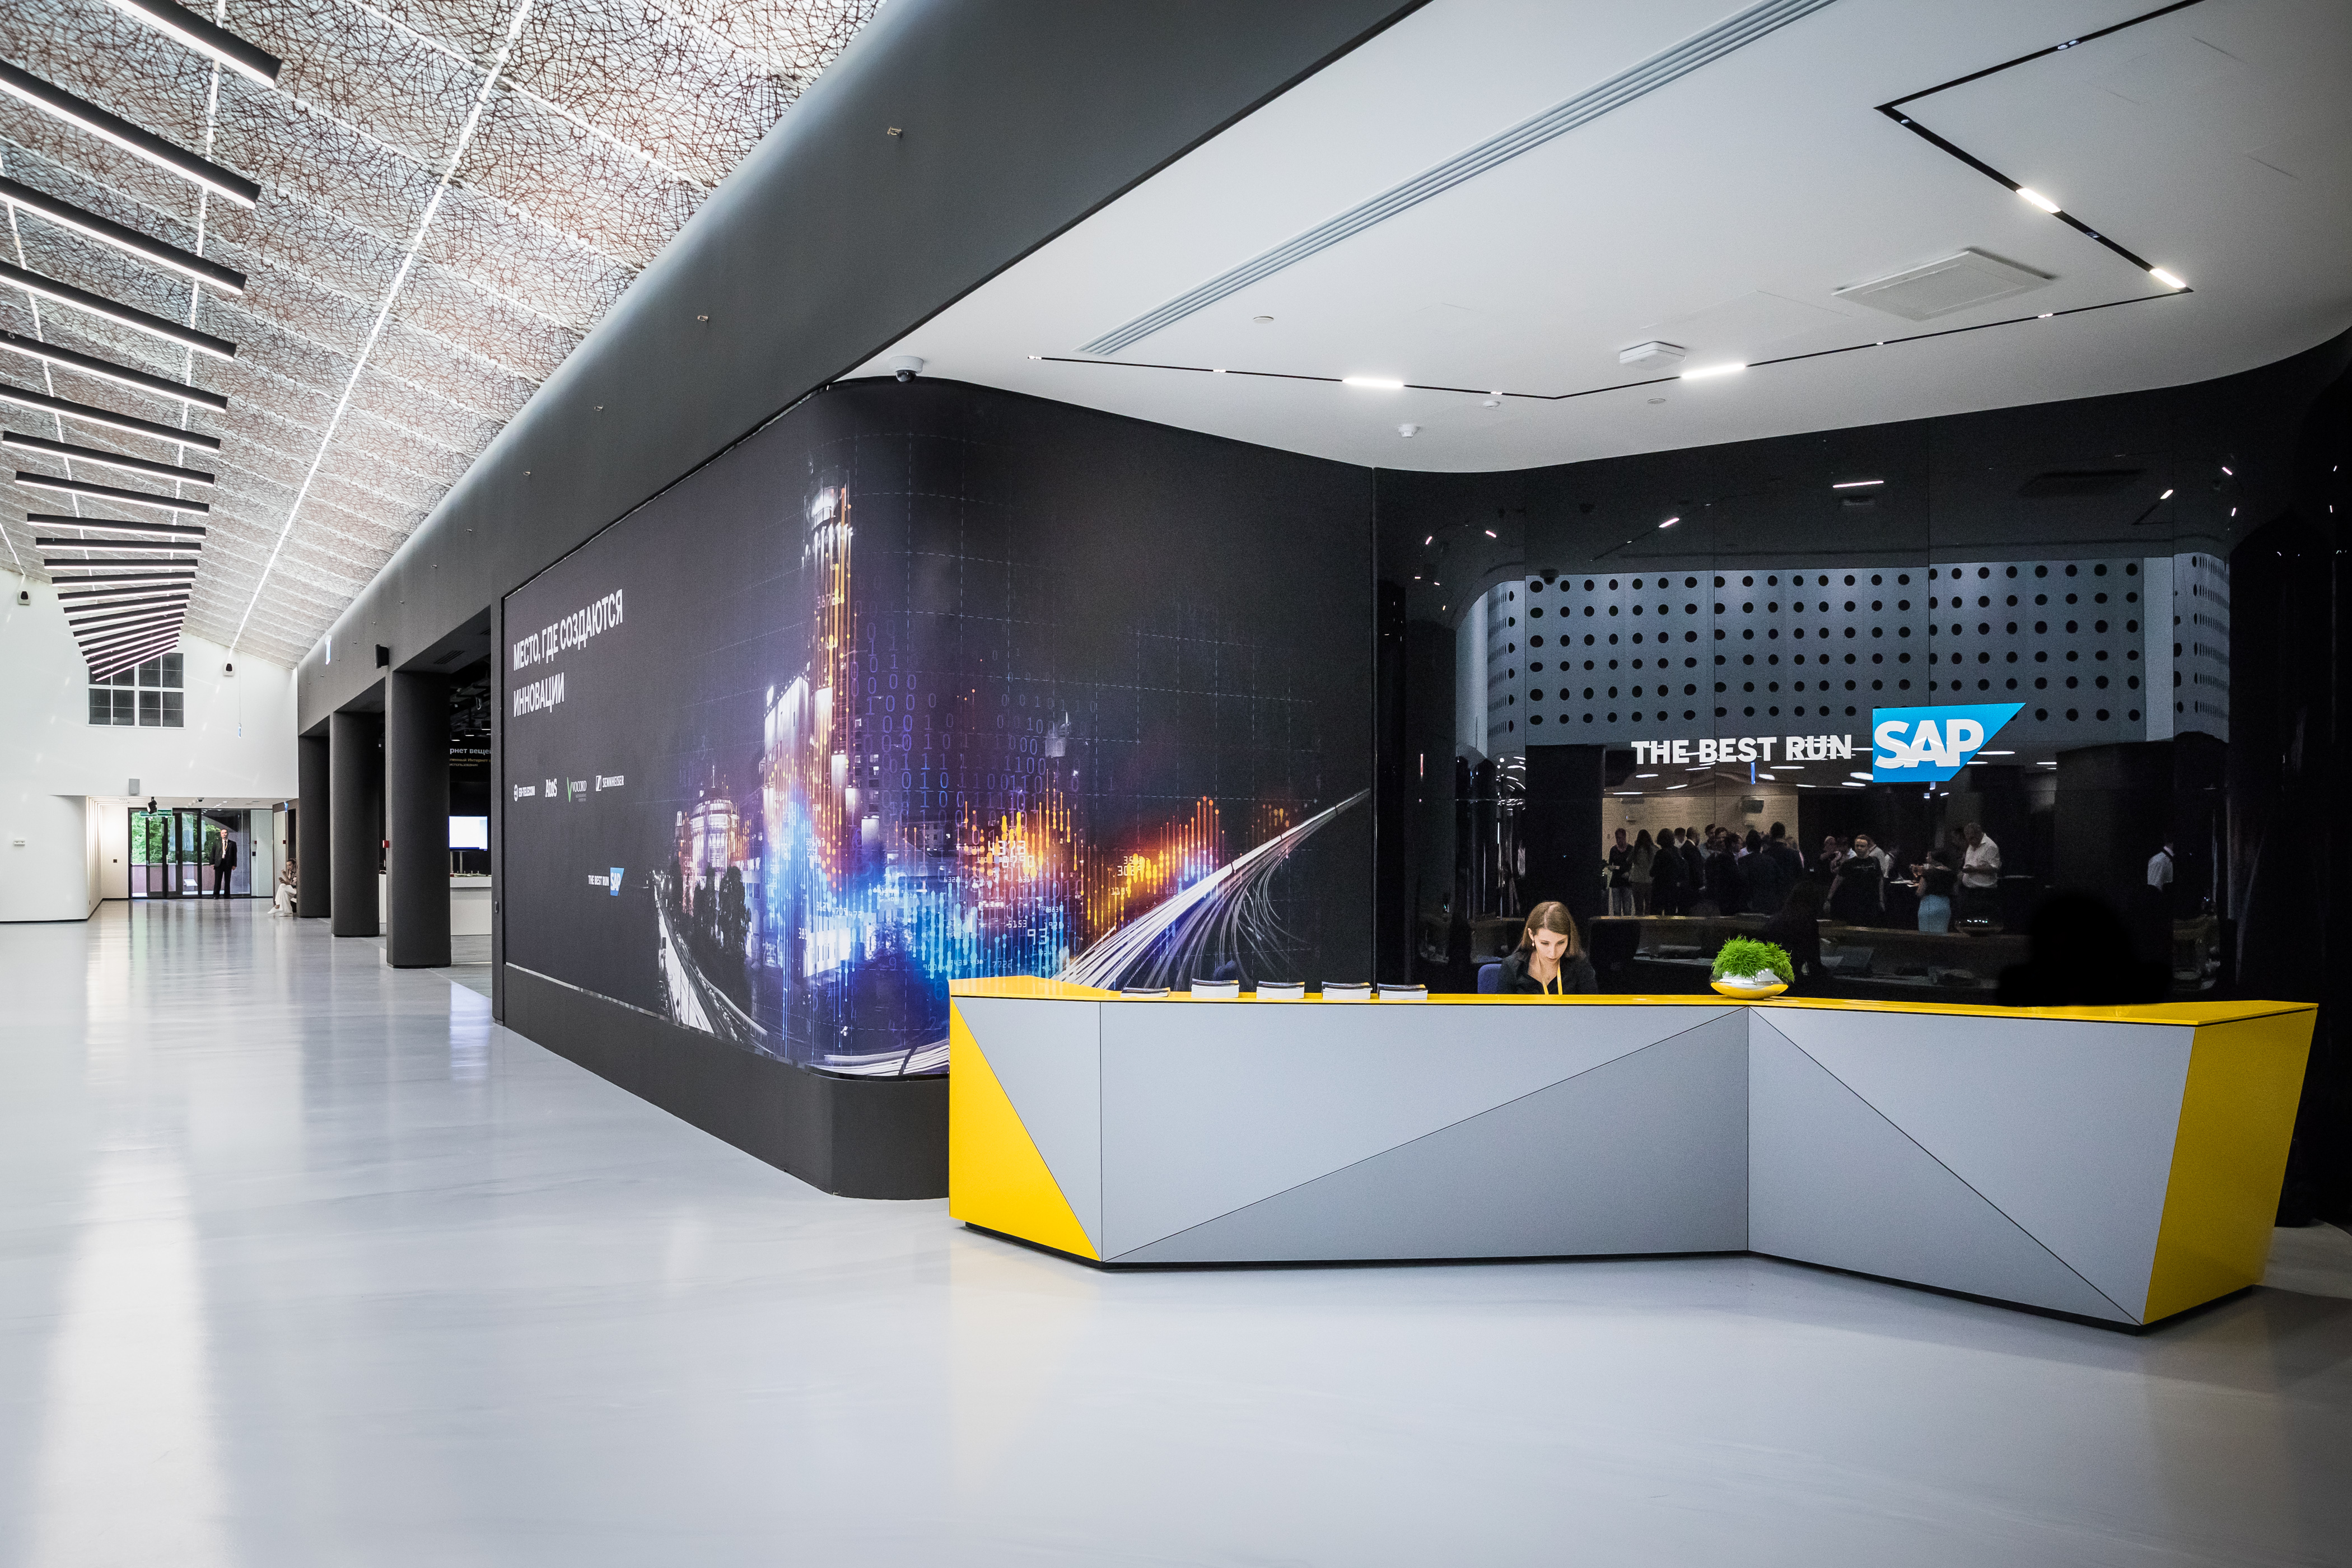
When building our own Center, we decided that it was necessary not only to show new technologies as demo stands, but also to introduce them into the work of the Center itself.
For example, all halls and auditoriums in the Center can be transformed - divided into several parts - and re-united into a single space. The platform is also equipped with a “smart office” - solutions for resource management, cameras with facial recognition function, sensors for the Internet of things.
')
In the process, we came up with a simple and effective scenario based on the SAP Cloud Platform to monitor how effectively the meeting rooms are used. In this article we will explain how you can quickly and easily put together such a scenario in one day.
Next - about sensors, IoT-service in the SAP Cloud Platform and “rating of karma” for employees.
We started to work with preparing services in the SAP Cloud Platform for integration with sensors for the Internet of things. To develop a solution, we used the IoT Service in the SAP Cloud Platform (SCP) to automate data transfer, as well as the Cloud Foundry development environment in SCP.
We made a demo using these sensors:
Negotiation rooms should be monitored to check how employees actually use the premises - whether the meeting took place or the meeting room was empty at this time, how many people finally attended the meeting and other details. As a result, you can collect statistics on how employees effectively used negotiation for a certain period of time.

Figure 1. The architecture of the Internet of Things service in the SAP Cloud Platform
As a basis for this example, we used the SAP Cloud Platform and the Internet of Things service. The architecture of the platform is shown in Figure 1, it supports functions for integrating both individual devices and access points (Gateway) into a common network based on the Internet of Things service in the SAP Cloud Platform.
For devices without HTTPS / MQTT protocol support, as well as for dividing devices into segments that consolidate messages and send them centrally to the SAP Cloud Internet of Things, IoT GateWay Edge is used. This is a software component that can communicate with devices using protocols: HTTPS, MQTT, Modbus (1), CoAP, File (2), OPC UA (3), SigFox (4), SNMP (5). In addition, the developer can use the SDK to expand GateWay’s capabilities and implement its protocols for communicating with devices.
In the architecture of the Internet of Things GateWay service can be deployed as part of the SAP Cloud Platform, and on the end device. One of the major advantages of GateWay is integration with the SAP Cloud Platform, as it solves the problem of transferring data from devices to the cloud platform. But it is also possible to integrate with the Internet of Things service without the participation of GateWay, using the MQTT / HTTPS protocols.
The architecture of the Internet of Things service is built using the Cloud Foundry environment, which allows you to deploy your applications in the SAP Cloud Platform based on Python, JavaScript (Nodejs), Java (Tomcat), Go, Scala, etc. In this scenario, we used the Nodejs application server to create our own service for processing messages from sensors in the SAP Cloud Platform environment.
To prepare the code in Nodejs, we used the node-hdb module, which provides communication with the HANA DBMS and is already present in the CloudFoundry buildpack nodejs.
In a CloudFoundry environment, you must define the dependencies between the application and the modules used. In this case, Nodejs will be able to access the module and run our application, so we specify a link in the package.json file
We use the HANA DBMS as the main data storage and engine for creating analytical queries. Using the node-hdb module, you can use the Bulk Insert features (to speed up data insertion), transaction management (commit, rollback, autocommit), call SQL stored procedures.
The data obtained using the sensors of the Internet of Things come through the Internet of Things Service to the SAP Cloud Platform - directly to our Nodejs-based service. You must first configure the data model and message format in SAP Cloud Internet of Things.
To display the status of the meeting room in the service, we used the GenericTile component. Figure 2 shows an example of a customized GenericTile component for indicating the status of a meeting room.

To draw icons and color indications on the GenericTile component, we used the HTML5 canvas extension and the renderer method of the SAP UI5 object model.
How can I create analytic queries and display graphs in a UI in an application on an SCP?
The easiest way to access data in SAP HANA from UI5 is the OData protocol. It allows you to use the ready-made object model Model for transferring data to the UI5-display element. However, if a complex analytical query is required to form a data set, then SQLScript and stored procedures in SAP HANA come to the rescue. You can also not resort to complex query design in SQLScript, but simply use the Calculation View editor in the SAP Web IDE.

Figure 3. Example of Pie chart graphics from the sap.viz.ui5 library
Sample Javascript and SAP UI5 Code to Display Pie chart
To correctly display data on the Pie chart, you must carefully check the path to the data in the format specified in the Path property of the FlattenedDataset object. In this case, the Path property points to the / Data object, so you need to present the desired JSON structure in the form shown
To display statistics (see Fig. 4) about users who book meeting rooms, we used the simple element UI5 Table. It displays "points", calculated according to the number of "visits" to events. In this way, unscrupulous employees who reserve meeting rooms can be identified.

Fig 4. Visitor statistics for a specific user
Using the Internet of Things service, as well as CloudFoundry environments in the SAP Cloud Platform, you can quickly create your IoT services and easily integrate them with any devices. As a source of reference information on the Internet of Things service, you can use a link where the service architecture is described in detail and code examples are provided.
Also, to test the Cloud Foundry environment, you can use Trial access here , after clicking the Login button and passing the registration procedure.
When building our own Center, we decided that it was necessary not only to show new technologies as demo stands, but also to introduce them into the work of the Center itself.
For example, all halls and auditoriums in the Center can be transformed - divided into several parts - and re-united into a single space. The platform is also equipped with a “smart office” - solutions for resource management, cameras with facial recognition function, sensors for the Internet of things.
')
In the process, we came up with a simple and effective scenario based on the SAP Cloud Platform to monitor how effectively the meeting rooms are used. In this article we will explain how you can quickly and easily put together such a scenario in one day.
Next - about sensors, IoT-service in the SAP Cloud Platform and “rating of karma” for employees.
We started to work with preparing services in the SAP Cloud Platform for integration with sensors for the Internet of things. To develop a solution, we used the IoT Service in the SAP Cloud Platform (SCP) to automate data transfer, as well as the Cloud Foundry development environment in SCP.
We made a demo using these sensors:
- Magnetocontact sensor, which works both on opening and closing doors
- Infrared motion sensor to detect penetration into the protected area, and in our case also into the meeting room
Negotiation rooms should be monitored to check how employees actually use the premises - whether the meeting took place or the meeting room was empty at this time, how many people finally attended the meeting and other details. As a result, you can collect statistics on how employees effectively used negotiation for a certain period of time.
Figure 1. The architecture of the Internet of Things service in the SAP Cloud Platform
As a basis for this example, we used the SAP Cloud Platform and the Internet of Things service. The architecture of the platform is shown in Figure 1, it supports functions for integrating both individual devices and access points (Gateway) into a common network based on the Internet of Things service in the SAP Cloud Platform.
For devices without HTTPS / MQTT protocol support, as well as for dividing devices into segments that consolidate messages and send them centrally to the SAP Cloud Internet of Things, IoT GateWay Edge is used. This is a software component that can communicate with devices using protocols: HTTPS, MQTT, Modbus (1), CoAP, File (2), OPC UA (3), SigFox (4), SNMP (5). In addition, the developer can use the SDK to expand GateWay’s capabilities and implement its protocols for communicating with devices.
Notes
Notes from the SAP Cloud Platform documentation:
1) Modus is currently implemented using:
• TCP / IP over Ethernet
• Asynchronous serial transmission over various media (wire: RS-232, RS-485; fiber, radio, and so on)
• ModbusPLUS, a high speed token passing network.
This defines the underlying communication layers. There are some additional fields on the application data unit. The protocol follows a client-server approach, where a client initiates a Modbus transaction.
2) The following is the following workflow:
1. Read a certain file, based on a set of configuration parameters.
2. Return the schema file.
3. Map to the Internet of Things Service (for example, device addressing metadata, measurements of so on);
4. Stream normalized data up to the Things Core Service.
5. Remove the target file from its original location and, optionally, back it up into another folder.
The supported file formats are JSON, CSV, and binary. For the binary, it is a code64 encoded string for the Internet of Things Core Service.
3) The Internet of Things Gateway integrates the OPC UA Servers. OPC UA session; The corresponding device has been set to sensors. Then, it is possible to reconstruct the data, for two possible options:
• Periodic pull mode;
• Subscription mode
4) SigFox is a French company employing a UNB-based (Ultra Narrow Band) radio technology. It currently uses the ISM band for 868MHz (as defined by ETSI and CEPT) and it depends on the FCC). To expand the service coverage area, SigFox has partnerships with several network operators around the world. By utilizing the SigFox, it enables communication of the SigFox cloud. In this context, the infrastructure generates a network. This doesn’t interpret the data but simply transfers it. Considering this, you can use the REST APIs. The SigFox network in a simplified way.
5) The data flow follows two routes:
MIB-WALK for each connected device.
• The Internet of Things
In the architecture of the Internet of Things GateWay service can be deployed as part of the SAP Cloud Platform, and on the end device. One of the major advantages of GateWay is integration with the SAP Cloud Platform, as it solves the problem of transferring data from devices to the cloud platform. But it is also possible to integrate with the Internet of Things service without the participation of GateWay, using the MQTT / HTTPS protocols.
The architecture of the Internet of Things service is built using the Cloud Foundry environment, which allows you to deploy your applications in the SAP Cloud Platform based on Python, JavaScript (Nodejs), Java (Tomcat), Go, Scala, etc. In this scenario, we used the Nodejs application server to create our own service for processing messages from sensors in the SAP Cloud Platform environment.
Example code for a service based on Nodejs can be found here.
const http = require('http'); const hdb = require('hdb'); http.createServer(function (req, res) { if (req.method === 'POST') { let body = ''; req.on('data', chunk => { body += chunk.toString(); // convert Buffer to string }); req.on('end', () => { var data = JSON.parse(body); var id = data.id; var data = data.payload; var timestamp = data.TIMESTAMP; var vcap_services = JSON.parse(process.env.VCAP_SERVICES); var db_cred = vcap_services["hana-db"]; var credentials = db_cred[0].credentials; var port = credentials.port; var host = credentials.host; var crt = credentials.certificate; var client = hdb.createClient({ host : host, port : port, user : 'user_name', password : 'password', useTLS: true }); client.on('error', function (err) { console.error('Network connection error', err); }); console.log(client.readyState); // new client.connect(function (err) { if (err) { return console.error('Error:', err); } console.log(client.readyState); // connected }); client.prepare('call NEW_EVENT (?, ?, ?)', function(err, statement){ if (err) { return console.error('Prepare error:', err); } statement.exec({ ID: id, PAYLOAD : data, TS: timestamp}, function(err, affectedRows) { if (err) { return console.error('Exec error:', err); } console.log('Number of affected rows:', affectedRows); }); }); res.write("OK"); res.end(); } To prepare the code in Nodejs, we used the node-hdb module, which provides communication with the HANA DBMS and is already present in the CloudFoundry buildpack nodejs.
In a CloudFoundry environment, you must define the dependencies between the application and the modules used. In this case, Nodejs will be able to access the module and run our application, so we specify a link in the package.json file
dependency
"dependencies" : {
"hdb" : "0.xx"
}
We use the HANA DBMS as the main data storage and engine for creating analytical queries. Using the node-hdb module, you can use the Bulk Insert features (to speed up data insertion), transaction management (commit, rollback, autocommit), call SQL stored procedures.
The data obtained using the sensors of the Internet of Things come through the Internet of Things Service to the SAP Cloud Platform - directly to our Nodejs-based service. You must first configure the data model and message format in SAP Cloud Internet of Things.
How to quickly create a UI and customize the basic components of SAP UI5?
To display the status of the meeting room in the service, we used the GenericTile component. Figure 2 shows an example of a customized GenericTile component for indicating the status of a meeting room.
To draw icons and color indications on the GenericTile component, we used the HTML5 canvas extension and the renderer method of the SAP UI5 object model.
Example code can be found here.
renderer: function (oRM, oControl) { var model; var d; var view = sap.ui.getCore().byId("samplecontainer---mainview"); if (!this.status) this.status = {"door":"","motion":"","color":"#2bbc2d","busy":0}; if (view != undefined) model = view.getModel("DT1"); if (model != undefined){ d = JSON.parse(model.getJSON()); if (this.status){ this.status.busy = d.busy; this.status.door = d.door; this.status.motion = d.motion; this.status.color = d.color; } } oRM.write("<div"); oRM.writeControlData(oControl); oRM.write(">"); </spoiler> if (this.status.busy == 0){ oRM.write("<img id='iDT1' src='/iotex/images/room_empty.png' alt='Empty' height='64' width='70'>"); } else { oRM.write("<img id='iDT1' src='/iotex/images/room_booked.png' alt='Booked' height='64' width='70'>"); } oRM.write("<canvas id='cDT1' width='30' height='30'></canvas>"); oRM.write("<script>"); oRM.write("var canvas = document.getElementById('cDT1');"); oRM.write("var context = canvas.getContext('2d');"); oRM.write("var centerX = canvas.width / 2;"); oRM.write("var centerY = canvas.height / 2;"); oRM.write("var radius = 12;"); oRM.write("context.beginPath();"); oRM.write("context.arc(centerX, centerY, radius, 0, 2 * Math.PI, false);"); if ((this.status.busy == 1)&&((this.status.door != 0)||(this.status.motion != 0))){ oRM.write("context.fillStyle = '#f46e41';");//red } else { oRM.write("context.fillStyle = '#ffff00';"); //yellow } if (this.status.busy == 0){ oRM.write("context.fillStyle = '#2bbc2d';"); //green } oRM.write("context.fill();"); oRM.write("</script>"); oRM.write("</div>"); } How can I create analytic queries and display graphs in a UI in an application on an SCP?
The easiest way to access data in SAP HANA from UI5 is the OData protocol. It allows you to use the ready-made object model Model for transferring data to the UI5-display element. However, if a complex analytical query is required to form a data set, then SQLScript and stored procedures in SAP HANA come to the rescue. You can also not resort to complex query design in SQLScript, but simply use the Calculation View editor in the SAP Web IDE.
Figure 3. Example of Pie chart graphics from the sap.viz.ui5 library
Sample Javascript and SAP UI5 Code to Display Pie chart
shown here
$.ajax ({ type: "GET", url: "/iotex/odatasource/rooms.xsodata/rooms?$format=json", dataType: 'json', async: false, success: function (data, status){ var aData = data.d.results; var UData = {Data: aData}; room_model.setData(UData); } }); View.setModel(room_model,"Rooms"); var oVizFrame = this.oVizFrame = this.getView().byId("idVizFrame"); var oDataset = new sap.viz.ui5.data.FlattenedDataset({ dimensions : [{ name : 'Time', value : "{Time}"}], measures : [{ name : 'Usage', value : '{Value}'} ], data : { path : "/Data" } }); oVizFrame.setDataset(oDataset); oVizFrame.setVizProperties({ title:{ text : " " }, plotArea: { colorPalette : ['#2bbc2d','#f46e41','#c5f442'], drawingEffect: "glossy" }}); var feedSize = new sap.viz.ui5.controls.common.feeds.FeedItem({ 'uid': "size", 'type': "Measure", 'values': ["Usage"] }), feedColor = new sap.viz.ui5.controls.common.feeds.FeedItem({ 'uid': "color", 'type': "Dimension", 'values': ["Time"] }); oVizFrame.addFeed(feedSize); oVizFrame.addFeed(feedColor); To correctly display data on the Pie chart, you must carefully check the path to the data in the format specified in the Path property of the FlattenedDataset object. In this case, the Path property points to the / Data object, so you need to present the desired JSON structure in the form shown
here
var datapiechart = { "Data" : []}; var yellow = {"Time":"Abused","Value":data.yellow}; var red = {"Time":"Occupied","Value":data.red}; var green = {"Time":"Free","Value":data.green}; datapiechart.Data.push(yellow); datapiechart.Data.push(red); datapiechart.Data.push(green); var mod = viz.getModel(); mod.setData(datapiechart); viz.setModel(mod); To display statistics (see Fig. 4) about users who book meeting rooms, we used the simple element UI5 Table. It displays "points", calculated according to the number of "visits" to events. In this way, unscrupulous employees who reserve meeting rooms can be identified.
Fig 4. Visitor statistics for a specific user
Using the Internet of Things service, as well as CloudFoundry environments in the SAP Cloud Platform, you can quickly create your IoT services and easily integrate them with any devices. As a source of reference information on the Internet of Things service, you can use a link where the service architecture is described in detail and code examples are provided.
Also, to test the Cloud Foundry environment, you can use Trial access here , after clicking the Login button and passing the registration procedure.
Source: https://habr.com/ru/post/422475/
All Articles