The book "The internal structure of Windows. 7th ed "
 Since the release of the previous edition of this book, the Windows operating system has come a long way of updates and conceptual changes, resulting in a new stable architecture of the Windows 10 kernel.
The book "Inside Windows" was created for professionals who want to understand the inner life of the main components of Windows 10. Based on this information, developers will be easier to find the right design solutions, creating applications for the Windows platform, and solve complex problems associated with their operation. System administrators, knowing that the operating system is "under the hood", will be able to deal with the behavior of the system and quickly solve the problem of improving performance and diagnosing crashes. Security professionals will need information on how to combat operating system vulnerabilities.
Page list dynamics
In fig. Figure 5.37 shows the state transition diagram of page blocks. For simplicity, it does not provide a list of pages that have been changed, but are not subject to recording.
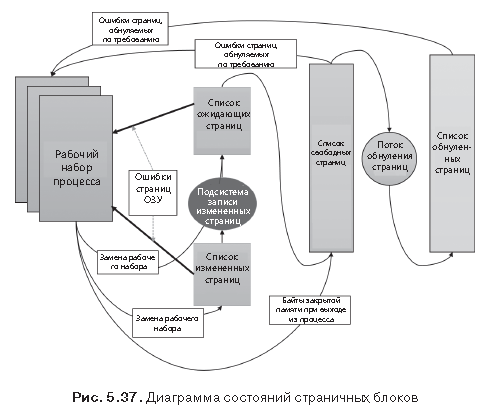
Page blocks are moved between page lists in the following ways.
')
1. When a memory manager is required to service a page error associated with a page zeroing request (accessing a page that is determined to be completely filled with zeros, or to a closed, confirmed user mode page that has not been accessed yet), the page filled with zeros is needed first An attempt is made to get this page from the list of such pages. If the list is empty, the page is taken from the list of free pages and filled with zeros. If the list of free pages is also empty, the list of waiting pages is accessed, and the page from this list is filled with zeros.
2. One of the reasons why pages filled with zeros are in demand is to fulfill various security requirements - for example, common criteria (Common Criteria). Most of the provisions of the general criteria indicate that user mode processes should receive zeroed page blocks so that they cannot read the contents of the memory of previous processes. Therefore, the memory manager provides user mode processes with zero page blocks, unless the page has been read from the backup storage. In this case, the memory manager uses non-zero page blocks, initializing them with data from disk or from remote storage. The list of pages filled with zeros is replenished from the list of free pages by the system program flow, which is called the zero page thread, which is stream 0 in the System process. The page zeroing thread waits for a signal to work from the gateway object. When there are eight or more pages on the free list, the gateway beeps. But the page zeroing thread is started only if at least one processor has no other threads running, since the page zeroing thread starts with priority 0, and the lowest priority that can be set for a user thread is 1.
NOTE When memory is allocated by a driver that calls the MmAllocatePagesForMdl or MmAllocatePagesForMdlEx function, the memory must be filled with zeros in the Windows application that calls the AllocateUserPhysicalPages or AllocateUserPhysicalPagesNuma Windows application, or when the application allocates large pages, the memory manager clears. displays larger areas than a page zeroing stream, zeroing only one page at a time. In addition, on multiprocessor systems, the memory manager creates an additional system thread for zeroing in parallel mode (and on NUMA platforms, this is done in a style optimized for NUMA technology).
3. When the memory manager does not need a page filled with zeros, it first accesses the list of free pages. If this list is empty, it goes to the list of zeroed pages. If the list of zeroed pages is empty, it goes to the list of waiting pages. Before the memory manager can use the page block from the list of waiting pages, it must first return and delete the link from the invalid PTE record (or from the prototype PTE record), which still points to the page block. Since the PFN number database entries contain backward pointers to the previous page of the user page table (or to the pool page of the prototype PTE record for shared pages), the memory manager can quickly find the PTE record and make the appropriate change to it.
4. When a process must abandon a page from its working set (either because it refers to a new page and its working set is full, or because the memory manager has cut its working set), the page goes to the waiting list if it remains intact. (unchanged), or to the list of changed pages, if the page was modified while in physical memory.
5. When the process finishes, all closed pages go to the free list. In addition, if, when closing the last link to a section supported by a page file, there are no displayed views in the section, the pages of this section also fall into the list of free pages.
EXPERIMENT: VIEW LISTS OF FREE AND CUSTOM PAGES
The release of closed pages at the end of the process can be observed in the System Information window of Process Explorer. First you need to create a process with a large number of closed pages in its working set. We have already done this in one of the previous experiments using the TestLimit utility:
C:\Tools\Sysinternals>Testlimit.exe -d 1 -c 1500 Testlimit v5.24 - test Windows limits Copyright (C) 2012-2015 Mark Russinovich Sysinternals - www.sysinternals.com Process ID: 13928 Leaking private bytes with touch 1 MB at a time... Leaked 1500 MB of private memory (1500 MB total leaked). Lasterror: 0 The operation completed successfully. The –d key causes TestLimit not only to allocate memory as closed and confirmed, but also to “touch” it, that is, to access this memory. This leads to the allocation of physical memory and assigning it to a process in order to free up the area of the closed, confirmed virtual memory. If the system has enough available RAM, as many as 1500 MB will be allocated to the in-memory process. Now this process will wait until you make it complete or interrupt the work (perhaps with the Ctrl + C key combination in its command window). Perform the following steps.
1. Open Process Explorer.
2. Select the ViewSystem Information command and go to the Memory tab.
3. Observe the size of the free (free) and zeroed (zeroed) page lists.
4. End or terminate the TestLimit process.
You may be able to see that the list of free pages has increased briefly in size. We say “maybe” because the page zeroing flow will “wake up” as soon as only eight entries remain in the list of zeroed pages, and it will work very quickly. Process Explorer updates this window only once a second, and it seems that the other pages already have time to be reset and get into the list of zeroed pages, while we managed to “catch” this state. If you managed to notice a temporary increase in the list of free pages, then after this you will see that its size will drop to zero, and a corresponding increase will occur in the list of zeroed pages. If the moment is missed, you will simply see an increase in the list of zeroed pages.
EXPERIMENT: VIEWING LISTS OF MODIFIED AND EXPECTING PAGES
The movement of pages from the working set of the process to the list of changed pages and then to the list of waiting pages can be observed using the VMMap and RAMMap programs from the Sysinternals package or in the kernel debugger. Perform the following steps.
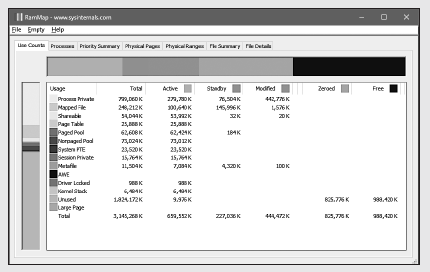
1. Run the program RAMMap and watch the calm state of the system. In this case, this is an x86 system with 3 GB of RAM. Columns in the window reflect various page states (see Figure 5.37). Some columns that are not relevant for this experiment have been narrowed down for convenience.
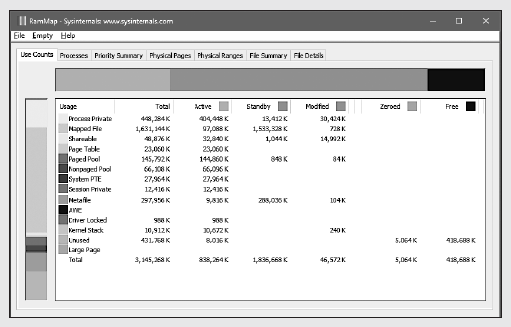
2. The system has about 420 MB of free RAM (made up of free and zero pages). About 580 MB appear in the list of waiting pages (therefore, some of them are “available”, but most likely contain data previously lost by processes or used during super-sampling). About 830 MB are active, being mapped directly to virtual addresses through reliable page table entries.
3. Each line is further broken down according to the states of the pages by use or origin (closed process pages, a displayed file, etc.). For example, at the moment from about 830 MB of active about 400 MB is due to the release of closed pages of the process.
4. Now, as in the previous experiment, use the TestLimit utility to create a process with a large number of pages in the working set. Here again, we use the –d key to force TestLimit to write to each page, but this time without limitation, to create as many closed modified pages as possible:
C:\Tools\Sysinternals>Testlimit.exe -d Testlimit v5.24 - test Windows limits Copyright (C) 2012-2015 Mark Russinovich Sysinternals - www.sysinternals.com Process ID: 7548 Leaking private bytes with touch (MB)... Leaked 1975 MB of private memory (1975 MB total leaked). Lasterror: 8 5. Now the TestLimit program has created 1975 selection areas of 1 MB each. To update the screen in the RAMMap program, you need to use the FileRefresh command to update the screen, because the RAMMap program itself does not do this (due to the high cost of this operation).
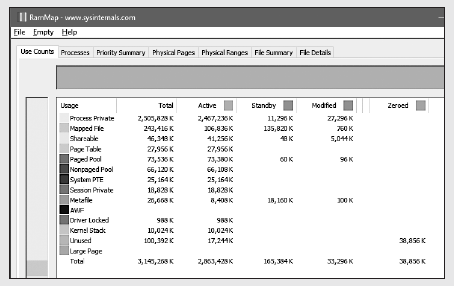
6. As you can see, more than 2.8 GB are active, of which 2.4 GB are in the line of closed pages of the process (line Process Private). This is the result of memory allocation and access to it from the TestLimit process. Also note that the lists of pending (Standby), zeroed (Zeroed) and free (Free) pages are now much smaller. Most of the memory allocated to the TestLimit program is taken from the pages listed in these lists.
7. Next, using the RAMMap, you need to evaluate the allocation of physical pages of the process. Click the Physical Pages tab and set the filter at the bottom of the Process column, assigning it the value Testlimit.exe. The next window shows all the physical pages that are part of the working set of the process.
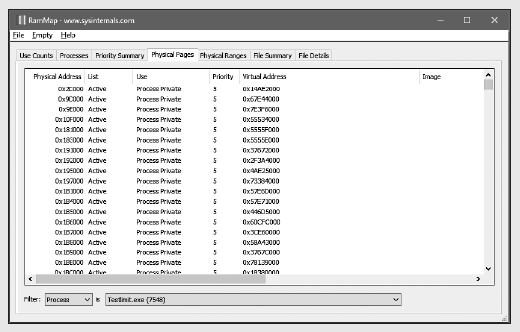
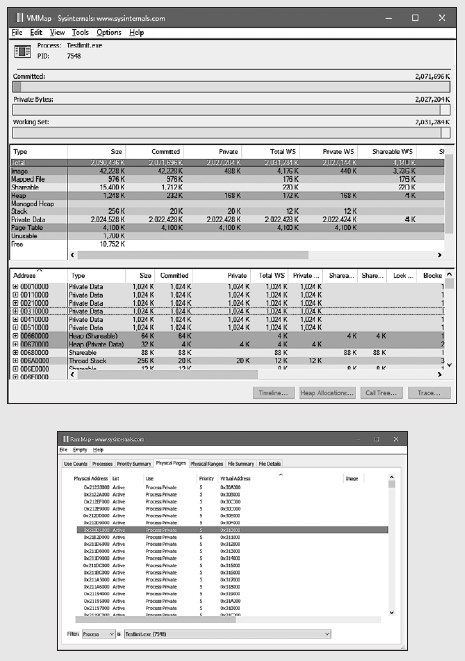
8. We need to identify the physical page involved in the allocation of the physical address space, which was performed using the –d key when the TestLimit program was started. The RAMMap does not give any indication of which virtual areas were allocated by calling VirtualAlloc from the RAMMap. But we can get a valuable hint on this with the help of the VMMap program. Calling VMMap for
the same process, we get the following result (see Fig. on p. 535 above).
9. In the lower part of the output information, there are hundreds of allocated areas for closed process data, each of which is 1 MB in size with 1 MB of confirmed memory. This corresponds to the size of the memory allocated by the TestLimit program. In the previous copy of the screen highlighted the first of these distribution options. Note that its starting virtual address is 0x310000.
10. Now let's return to the information about the physical memory displayed on the screen by the RAMMap program. Rebuild the columns so that the Virtual Address column is clearly visible. Click on it to sort the lines by this value, and you can find the virtual address you need (see the figure on page 535 below).
11. Here it is shown that the virtual page, starting with the address 0x310000, is currently mapped to the physical address 0x212D1000. With the -d key, the TestLimit program writes its name in the first bytes of each selected area. This can be demonstrated using the! Dc command of the local kernel debugger (dc is short for “display characters,” that is, outputting characters to a physical address):
lkd> !dc 0x212d1000 #212d1000 74736554 696d694c 00000074 00000000 TestLimit....... #212d1010 00000000 00000000 00000000 00000000 ................ ... 12. If you delay, the attempt may fail - the page may already be removed from the working set. In the last phase of the experiment, we show that the data remains unchanged (at least for a while) after the working set of the process is reduced, and the page is moved first to the list of changed, and then to the waiting pages.
13. With the TestLimit process selected in the VMMap program, open the View menu and select the Empty Working Set command to reduce the working set of the process to the minimum. Now the following information should be displayed in the VMMap window:
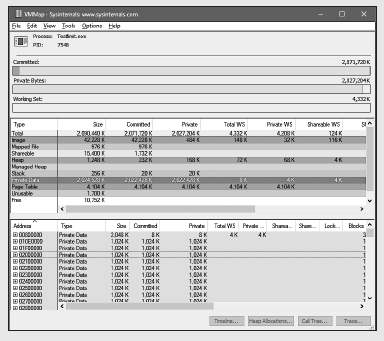
14. Notice that the Working Set line is almost empty. In the middle part for the process, it is shown that the total size of the working set is only 4 KB, and almost all of its space is occupied by page tables. Now go back to the RAMMap. On the Use Counts tab, you can see that the number of active pages has significantly decreased, and a large number of pages are on the modified list and a significant number of pages are on the waiting list.
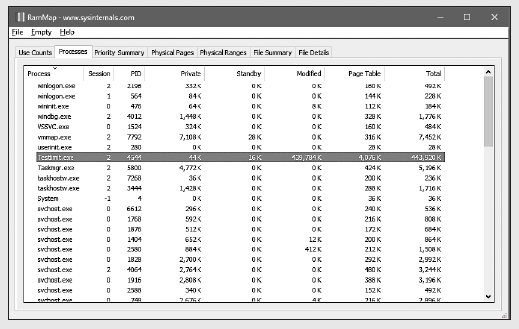
15. The data on the Processes tab of the RAMMap program confirms that most of these pages appear in these lists due to the TestLimit process.
»More information about the book can be found on the publisher site.
» Table of Contents
» Excerpt
For Habrozhiteley 20% discount coupon - Windows
Source: https://habr.com/ru/post/422269/
All Articles