"Perfect" time plan in the form of a Gantt chart

The most important tool for a project manager is a time plan. It can be built in different ways, but the Gantt chart is often used.
About the Gantt chart, there have already been many discussions on Habré:
- “Is the Gantt chart convenient?”
- Alternative methods "How to estimate the time of work?"
- “Planning Agile Projects with the Gantt Chart”
- “What the Gantt Chart is silent about or why projects are always late”
Someone thinks that the best time-plan is a Gantt chart, someone even plans agile-projects with the help of this chart, and someone, on the contrary, does not see in it any sense and suggests alternative approaches to planning and time-plans. .
')
Let's all figure out why a Gantt chart is needed at all, how it should be compiled and what is the use of it!
What awaits you in the article
Manual on drawing up a Gantt chart for the development of a web project. We will not focus on a specific tool; we will only discuss conceptual and fundamental approaches. At the heart of - twelve years of experience in the market for customized web development. During this time I was able to launch more than 100 projects. For the last three years I have been managing production at the online agency AGIMA.
Who is the article for?
The article will be of interest to project managers and everyone who in one way or another is engaged in drawing up and coordinating schedules for developing, organizing web application production processes and interacting with a client or business customer.
Disclaimer
This article is not a panacea, but only a purely personal opinion of the author ( Evgeny Lobanov , executive director of AGIMA ). Often, the critical chain method is effective for planning projects, but in this article we will not touch it and carry out any comparative analyzes.
What are time plans for?
Time plans are needed for correct planning of the load and proper management of the expectations of the business customer.
Before you start any task or project into production, you must have timing agreed with the team and business customer.
In addition to managing the expectations of the business customer and your team, the time plan is very significant from a moral point of view. I believe that if a project manager does not have a clear action plan with intermediate control points before the start of work, then such a project is very likely to fail.
Often two time plans are used - external and internal:
- internal is discussed only with the team and includes planned risks from the list of obvious risks at the time of project evaluation;
- external time-plan is discussed with the team and with the business customer; In addition to the obvious risks, it includes deviations in terms of terms based on the projected risks for the entire period of work on the project.
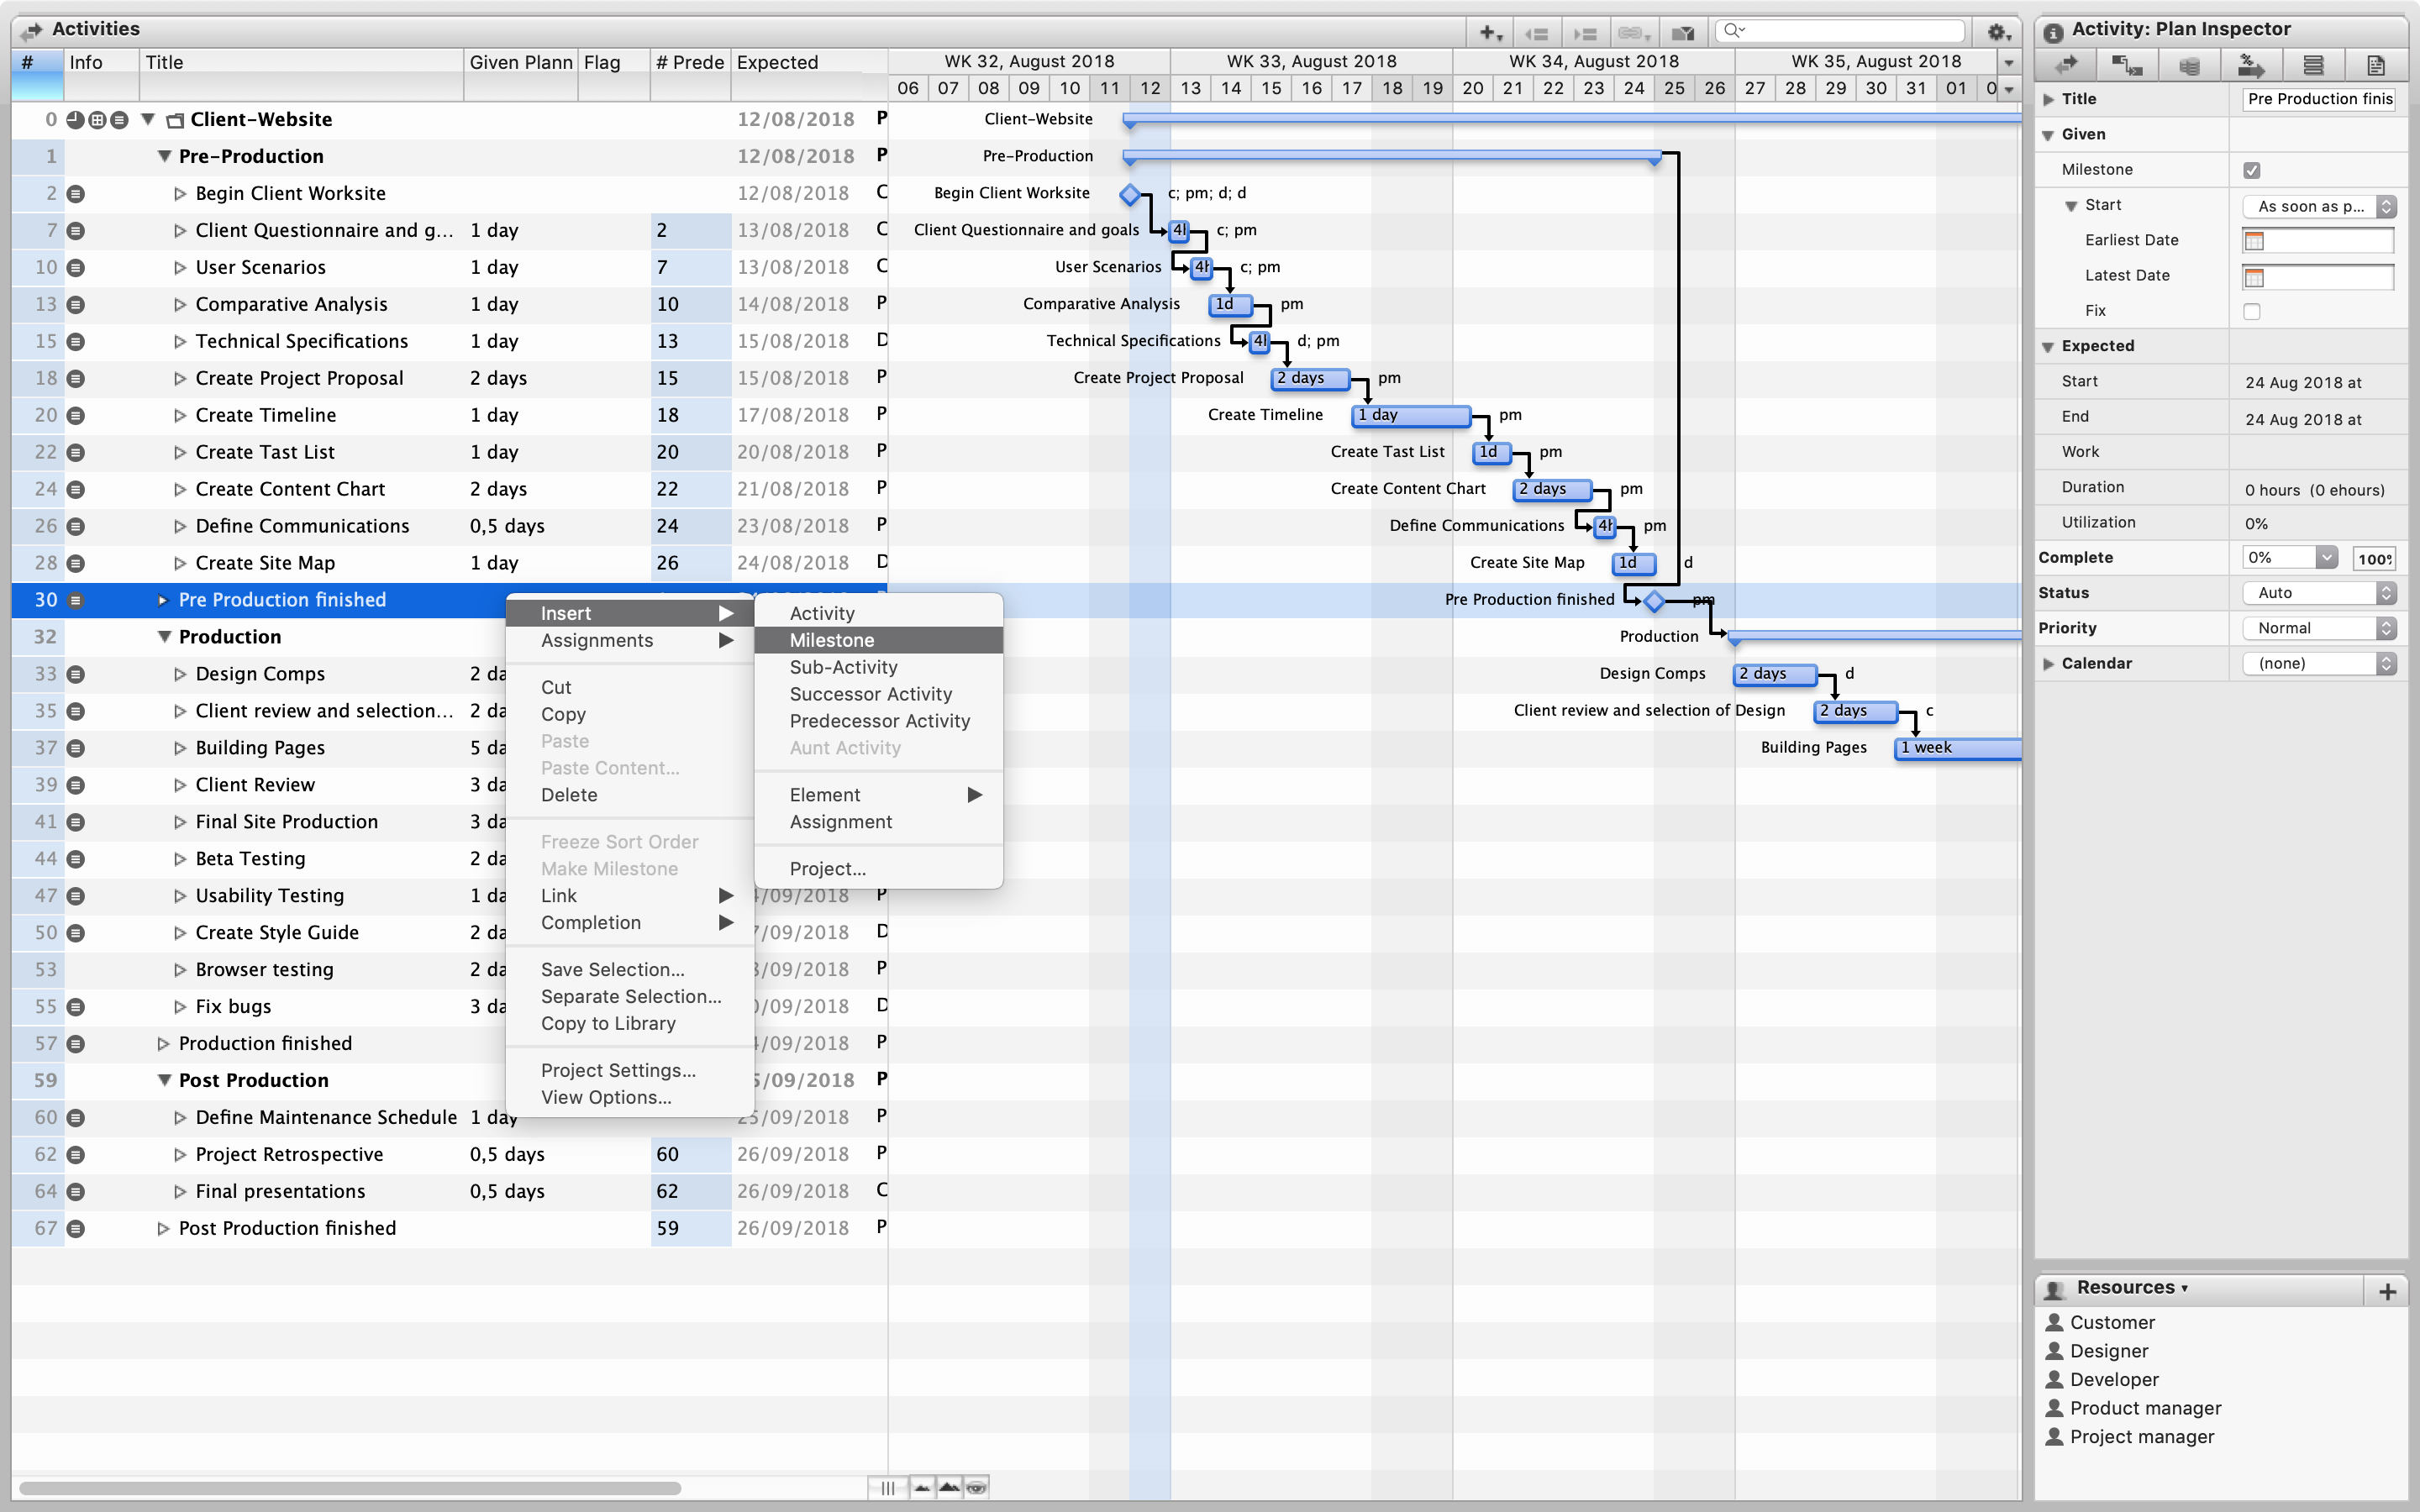
Time plans are usually presented in the form of a Gantt chart .
Let us consider what basic actions need to be done in order to bring our time plan closer to realism, that is, to the ideal.
Maximum detail project at the evaluation stage
An important and one of the most fundamental rules when planning a project is to remember that 20 hours for one task is a lot. Such a task cannot be monitored in all nuances and managed to be promptly returned to the project timeline (it is very difficult to minimize implicit risks at the time of the task assessment, usually these risks become known at the time of the deadline or the day before)
Therefore, it is important to put all the tasks on a specialist’s working day (in our company it’s 6 hours of effective time; you can read more in my article in the “Workflows” section). Such tasks are the easiest to control and influence on them, leaving them in the time line of the project.
If the task is estimated at more than 6-8 hours and does not have intermediate results for detail, then it is necessary to determine the criteria for recording progress.
Install the current production calendar, check all exceptions, set a six-hour working day.
Many when building schedules forget about the production calendars. In addition to the “standard” holidays, there are “floating” holidays year after year, replacing them with working days, etc.
Your time plan will be irrelevant if you do not use a real production calendar.
As a rule, to add a production calendar, you need to use the exceptions in setting up the calendar of the tool with which you create a Gantt chart.

Create all the necessary stages of the project. All activities (tasks) are entered into the stages.
It is very important to make the correct grouping for the activities in our time plan. If the diagram is simple, then it is enough to group by project stages, for example:
- analytics
- design,
- design,
- layout,
- development,
- testing,
- introduction.
But if the project is complex, then you have to apply a deeper grouping of activities - it helps a lot when filtering and targeting according to a complex Gantt chart. For example, I like to group by component, within project phases, etc.
Put all activities on the chart
Obviously, the more detailed the business tasks for specific activities, the simpler and more precisely we will be able to control the development process.
In addition to the main activities, do not forget to enter:
- iteration of edits according to the contract (if we are talking about custom development);
- time to agree on iterations by the business owner;
- time for corrections in accordance with the feedback and debugging according to the contract (if we are talking about custom development);
- 1-2 hours for unrecorded tasks for each activity;
- the creation of primary content;
- Filling content;
- production testing;
- business testing;
- introduction.
Create a risk map
You need to take the risk list template used for your type of project (often its application is limited by your organization).
Each risk has two main parameters regarding the project:
- The probability of its occurrence in the environment of the project.
- The degree of risk influence on the project.
You have to determine both parameters for each risk from the list. Next, you need to filter the risks by their real impact on the project - the easiest way to do this is using a risk map.
When all the obvious risks for the project are identified, it is necessary to take into account their minimization when constructing a time plan on the Gantt chart.
I share three main ways to minimize the obvious risks that affect the main time and budget characteristics of the project:
- duplication of resources;
- minimization of functionality relative to the cost of development;
- the definition of "points of no return" regarding the activities of third parties in the form of a reference point (milestone) on the basis of a calendar date.
Three risk accounting scenarios can be built: negative, normal, and positive. All three scenarios of the project development are more convenient to look at in the Gantt chart.
Record all control points for providing information from a business owner or customer
It is important not to forget:
- specifications;
- stubs or work services;
- brand book;
- all necessary content for implementation;
- the closure of work acts (if we are talking about custom development);
- signing of key intermediate documents;
- prepayment (if we are talking about custom development);
- other formal obligations.
To bring all resources (including time of specialists / employees of the customer)
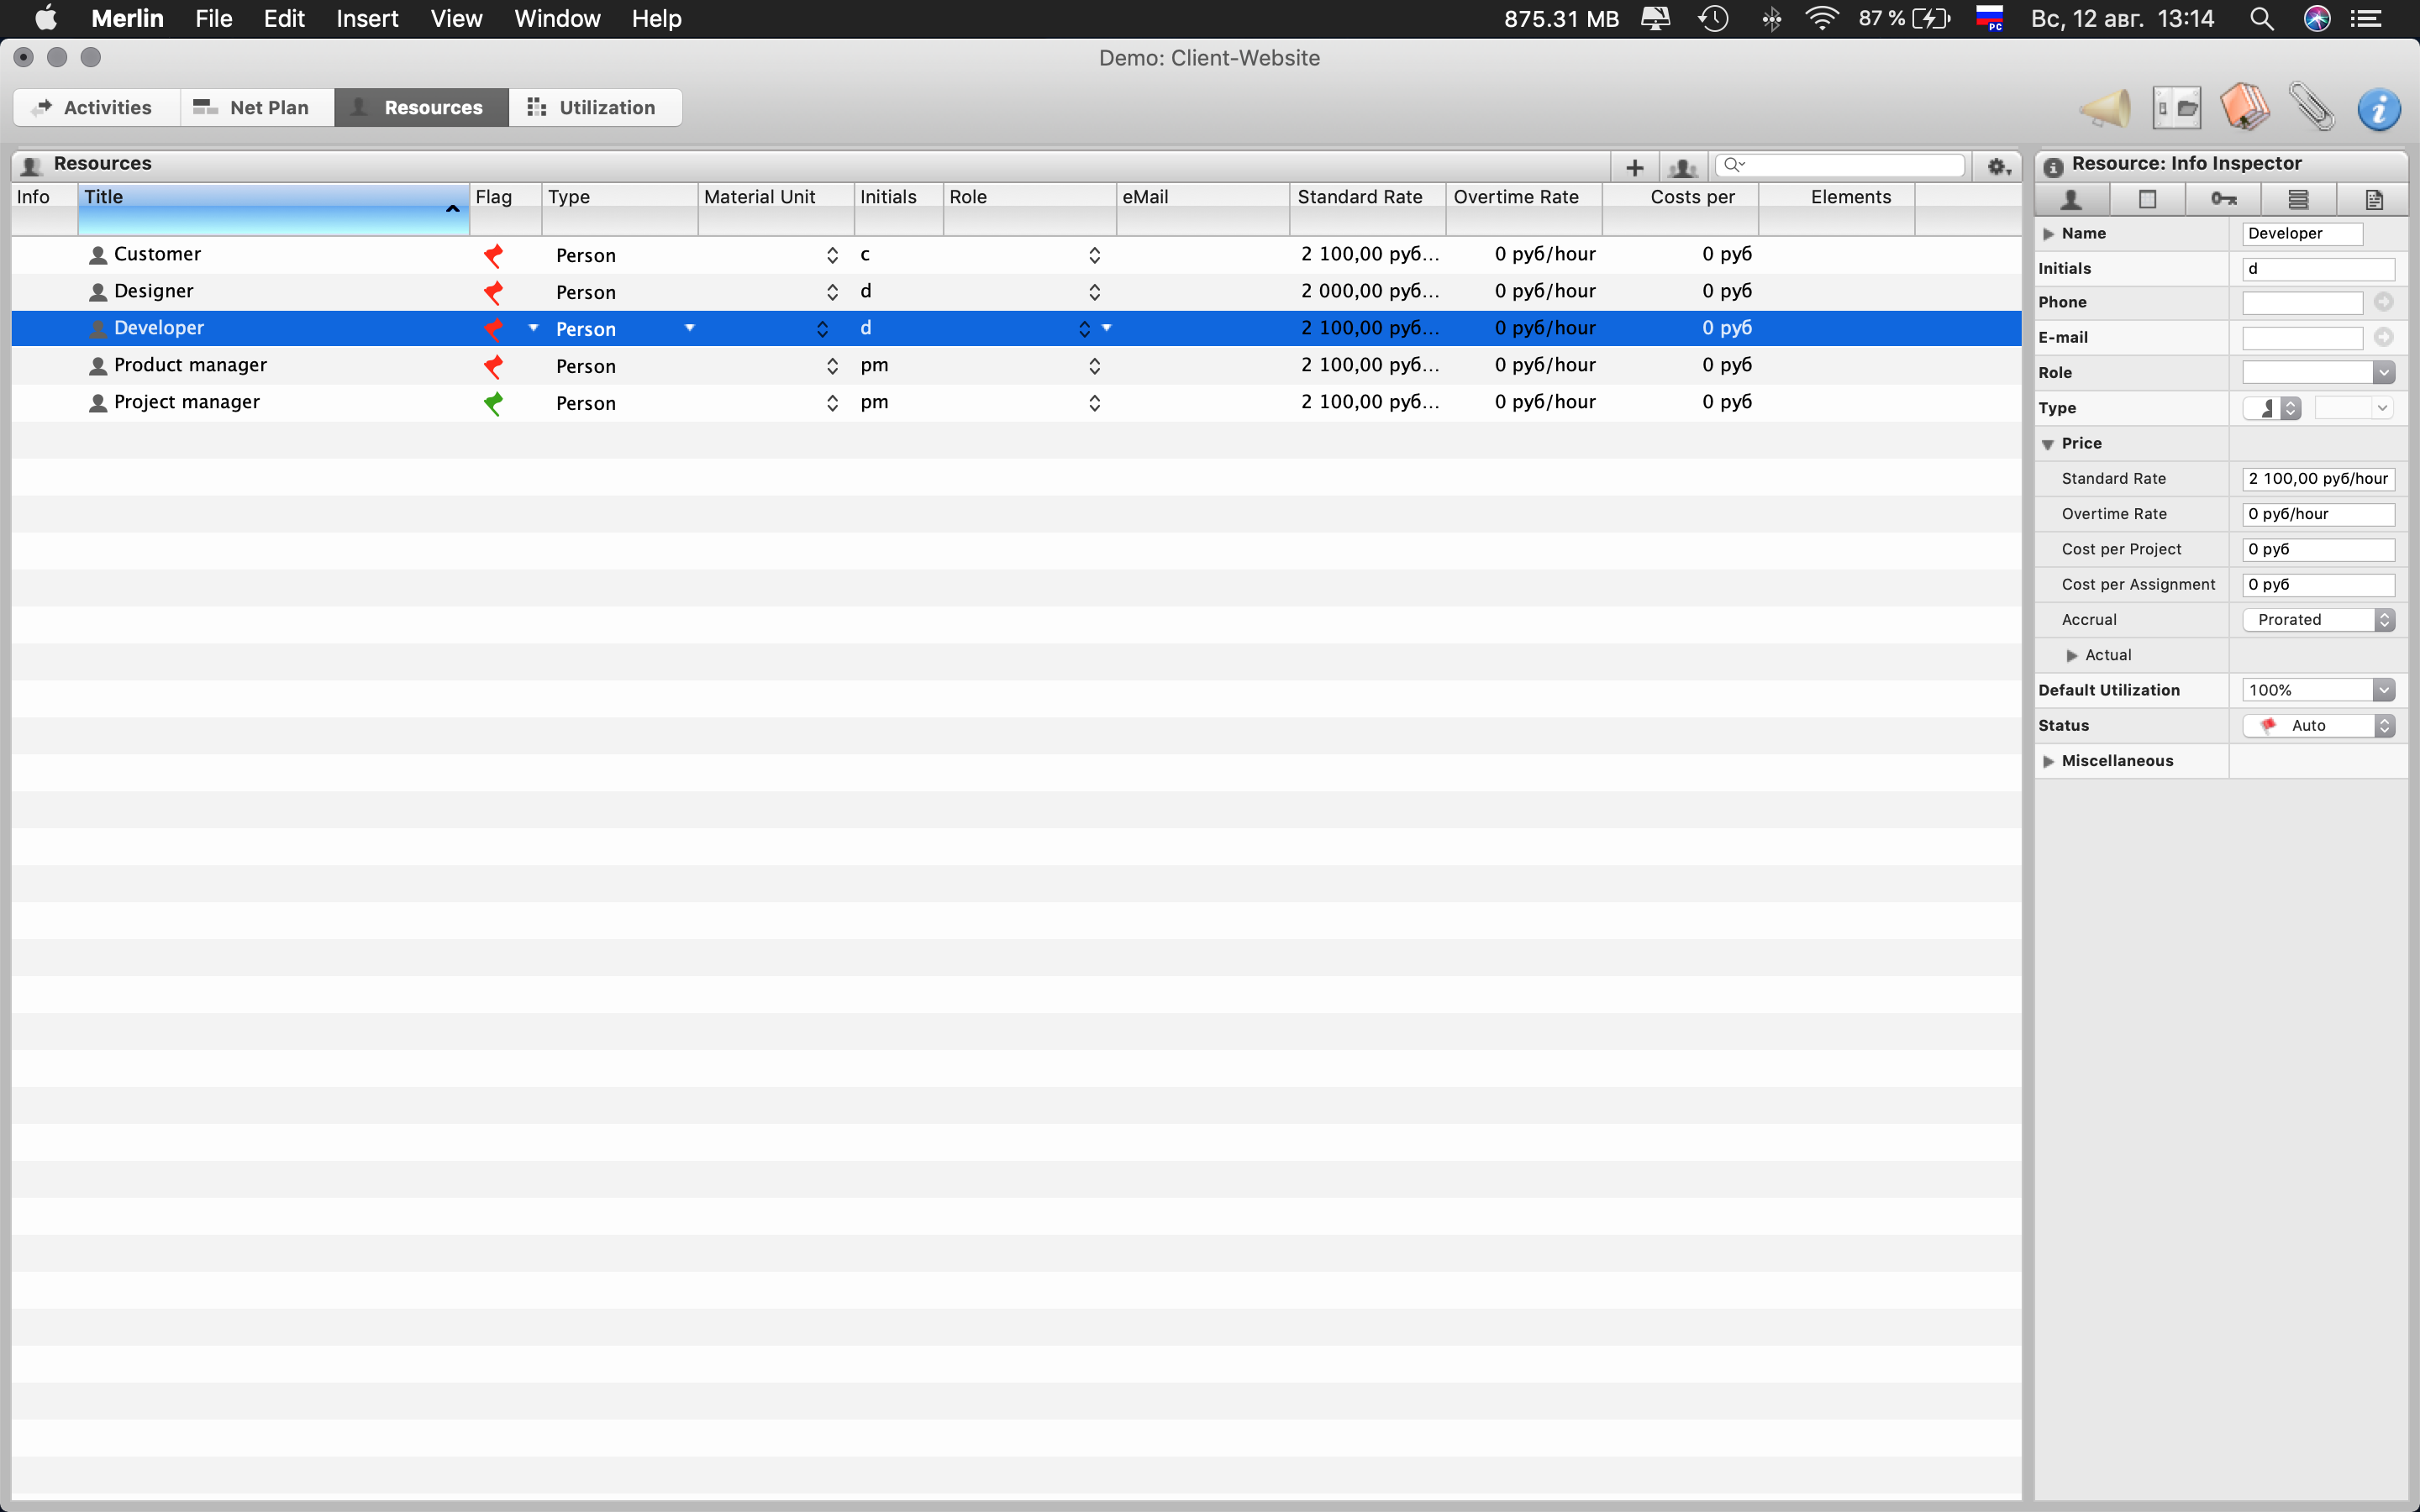
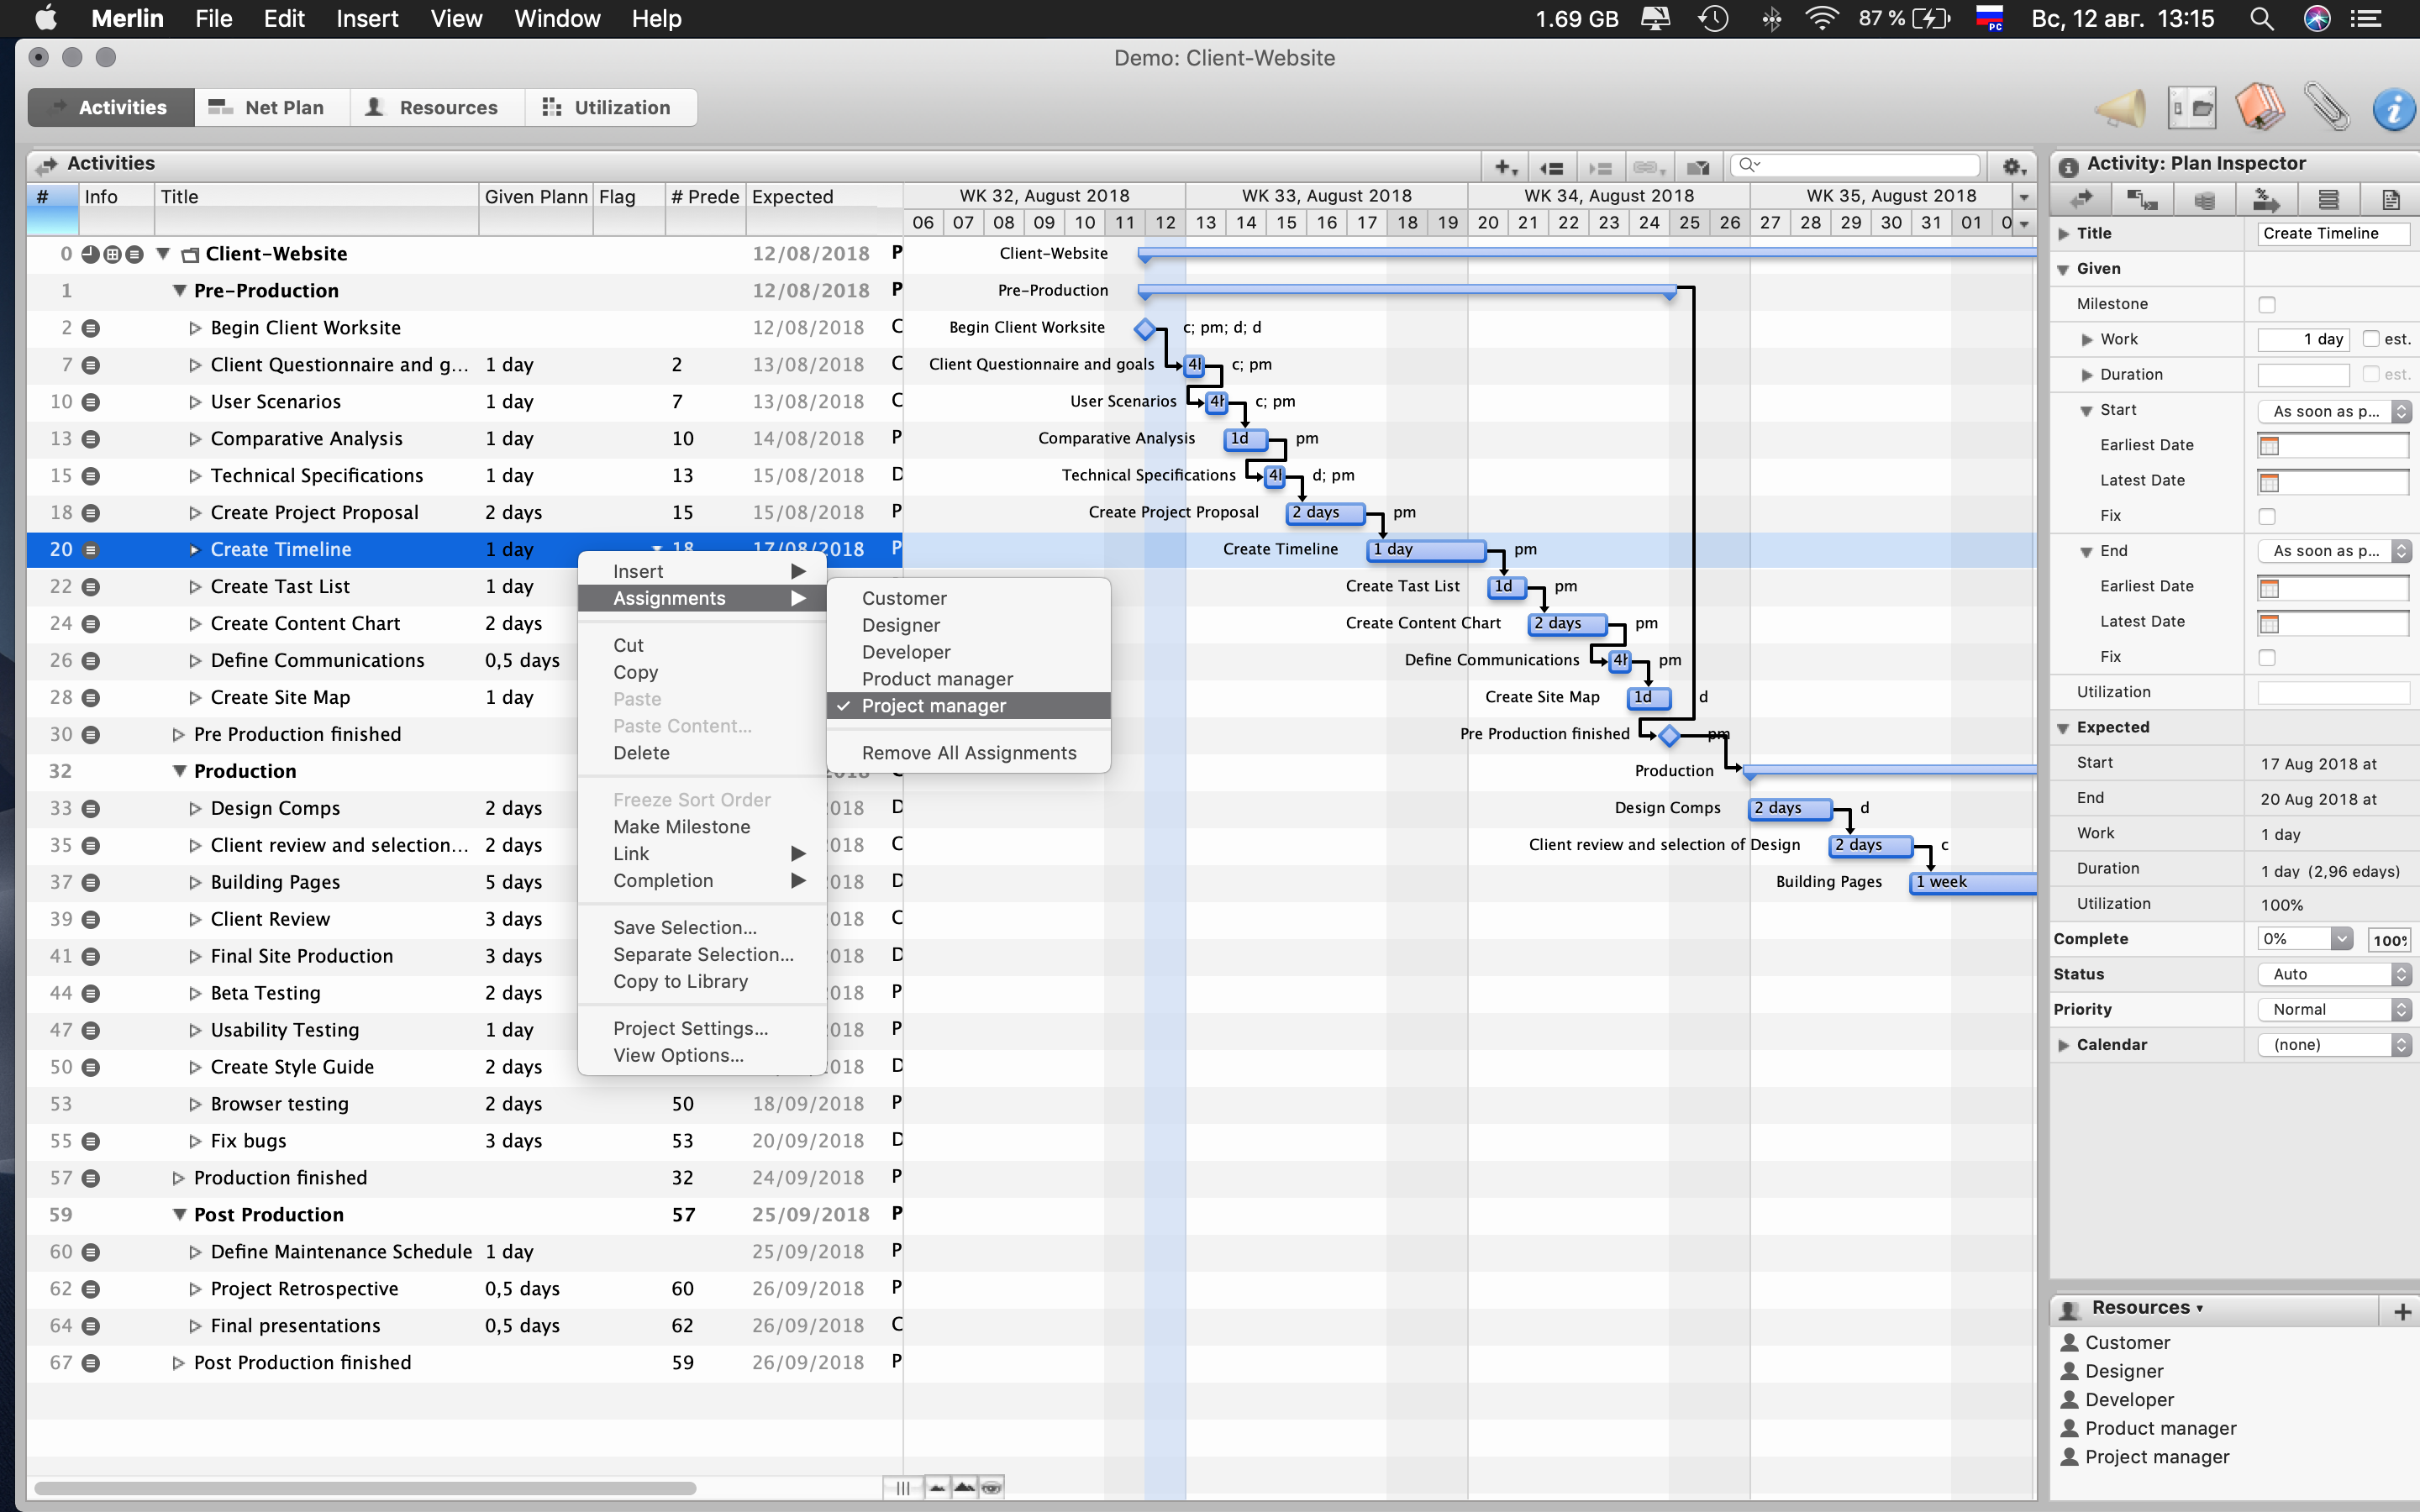
This will allow you to understand the peak points of the maximum intersection of the time of the same specialist. This way, you will see how many development threads you can run and test in parallel.
Additionally, you can enter the cost of resources and peak budgets, making a more accurate forecast of the cost of project development.
Specify the critical path
Having done the minimization of risks in the diagram and having decided all the critical points of intersection of resources, we were able to get the critical path of the project.
In essence, the minimum project path will match your internal timing. In which we have already taken into account:
- working hours of specialists;
- obvious risks that may occur, and the time it takes to resolve them;
- loading specialists with a normal distribution of working time (excluding overtime).
What's next

Subsequently, we can make an external one from the internal time-plan, eliminating obvious risks, but adding time deviations based on the forecasted risks for the entire period of work on the project.
Still, the Gantt chart is just a tool. Not a goal, but a means. If you are able to work with risks and requirements changes, then the Gantt chart, together with the roadmap , is one of the most effective tools for planning an entire project or development iterations.
It is this time plan that will somehow reflect the really necessary time for the implementation of the project. By the way, to calculate the deviations in terms of on the basis of predicted risks, you can often use the Burn Down Chart . About the parameters for which it can be built, in addition to the primitive "burning features", and how to collect statistics on deviations - I will tell in the next article. Stay tuned ...
Source: https://habr.com/ru/post/422231/
All Articles