RICE and ICE Scoring: simple prioritization techniques for advanced product managers
Each product manager will sooner or later be confronted with the question of prioritization when planning a strategy and a roadmap product. Is it always easy and quick to decide on what to work first?
Product roadmap requires a clear order. Only qualitatively expanding everything "on the shelves" can you get a decent and successful product release. In this case, you can not do without a convenient way to prioritize.
')
A high-quality prioritization system will help examine each feature or idea, each project or task and consistently combine all these factors.
Today PM offers a variety of popular methodologies for prioritizing from gaming to the most complex, quantitative and qualitative. All of them help managers and teams to answer a very important question: how to choose the right features for development ?
In this article we will look at two simple, but very useful techniques - RICE Scoring and the method of determining ICE priorities .
If you have several important and urgent features in the plan for implementation, how to understand which one to start first?
This important prioritization issue is at the core of all product management. The fee for choosing the wrong option may be too high.
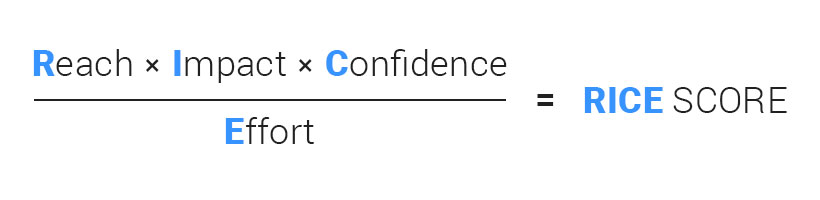
RICE is a method for prioritizing product ideas and features. The abbreviation includes 4 factors that the product manager can safely use to evaluate and prioritize product features:
To get a score on RICE, you need to combine these factors.
The level of coverage is measured by the number of people / events for a certain period of time. This factor is designed to assess how many people each feature or project will affect during a certain period of time, and how many of your users will see such changes.
It is important to focus on real metrics, rather than using obscure numbers.
For example:
The feature will be used by 800 users per month.
1000 users are involved in onboarding, and 70% - only 700 users will see this feature.
Influence shows what contribution this feature brings to the product.
Value is understood differently in each product. For example, in Hygger (B2B SaaS) for the current quarter, features get a high value if they are:
Based on your current goals, you will have your own metrics.
These are features that help us get new users during onboarding. But do not forget that the majority of users "fall away" on the second day.
For example, in SaaS an excellent indicator of retention on the first day is an indicator of 15%. This means that 85% of people just go on the second day. Therefore, here you should think about the features that most new users will be able to see in the first session.
Customers bought a subscription and are now asked to make some features. We do not "hurry" blindly to do everything. We accumulate statistics on each feature - how many clients asked for it. And then we implement the most popular features.
There are more than five hundred project management systems on the market today. To survive and succeed, we need to do something completely new, it is desirable to increase the service life for users or reduce costs several times. Here we are looking for opportunities that can give us a competitive advantage, will create a reason for competitors' customers to come to us. This competitive advantage should be unique, difficult to repeat and, ideally, not replicable.
By the way, the impact is difficult to measure accurately. So, we choose from a scale with many options: 3 for “mass influence”, 2 for “high”, 1 for “medium”, 0.5 for “low” and, finally, 0.25 for “minimal”. These numbers are multiplied by the final result to scale it lower or higher.
If you think that a feature can have a huge impact, but you have no data to prove it, Confidence allows you to control this point. Confidence is measured as a percentage.
for example
Project A: A product manager has quantitative indicators for the influence of a feature, and an estimate of labor costs. Thus, the project receives a 100% confidence rating.
Project B: The product manager has data on coverage and labor costs, but he is not sure about the impact factor. The project receives a confidence factor of 80%.
Project C: Coverage and impact may be lower than expected. Labor costs may be higher. The project receives a 50% confidence rating.
Labor costs are estimated as the number of person-months, weeks, or hours, depending on needs.
For example:
Project A will take about a week of planning, 2 weeks of design and 3 weeks to develop, so labor costs will be 2 person-months.
For project B, you only need a planning week, 1-2 weeks to develop and will not require design. Labor costs will be equal to 1 person-month.
The ICE prioritization method was coined by Shawn Ellis, who is known for writing the term Growth Hacker.
Initially, ICE was designed to prioritize growth experiments. Later, ICE was also used to prioritize features.
Calculate the estimate for each feature or idea, according to the formula:

In ICE, a scale from 1 to 10 is used so that all factors have a balanced effect on the final score. You can mean by 1-10 what you need, if only the values are consistent with each other.
As an example, apply this to the "Widgets for Dashboard" feature:
ICE Scoring is sometimes criticized for its subjectivity:
Consider an example of using both models in a service for managing Hygger.io products and projects.
Where to begin?
First of all, you should already have the necessary features and product ideas gathered on your Kanban board. Using Hygger, you can structure them using the Swimlanes horizontal columns, as well as using Labels . You can also customize the process of working with features using Columns . For example, you can create the following workflow:
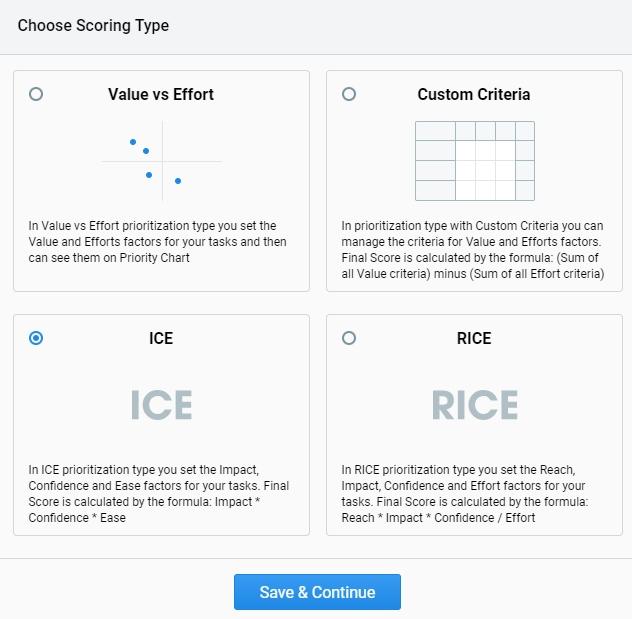
In the Hygger menu, you will find model options for evaluating and prioritizing features, including RICE and ICE:
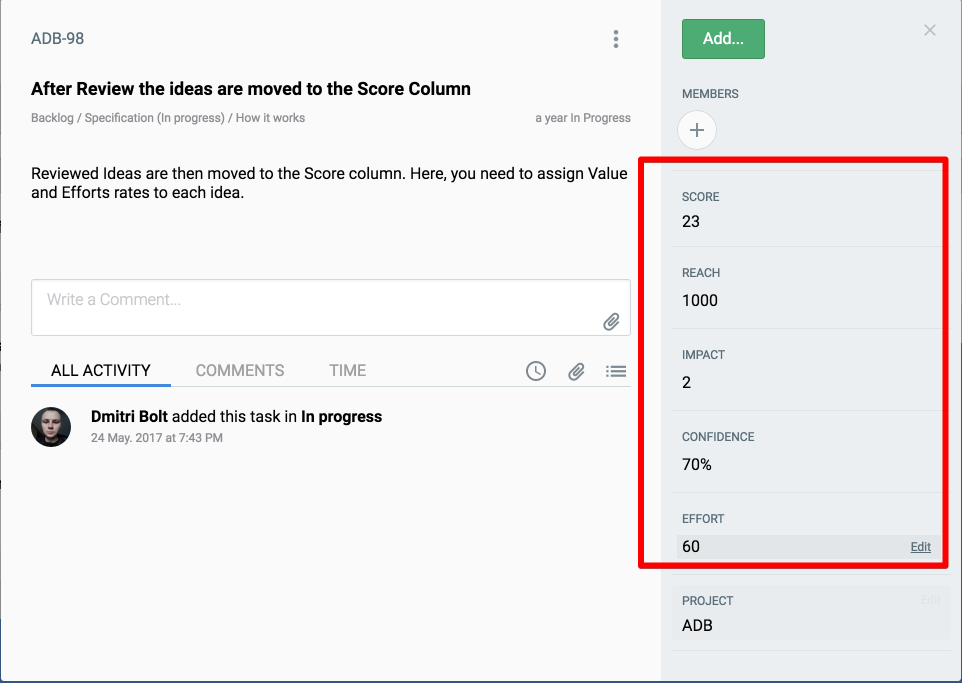
First you need to evaluate each feature by Reach, Impact, Confidence and Effort.
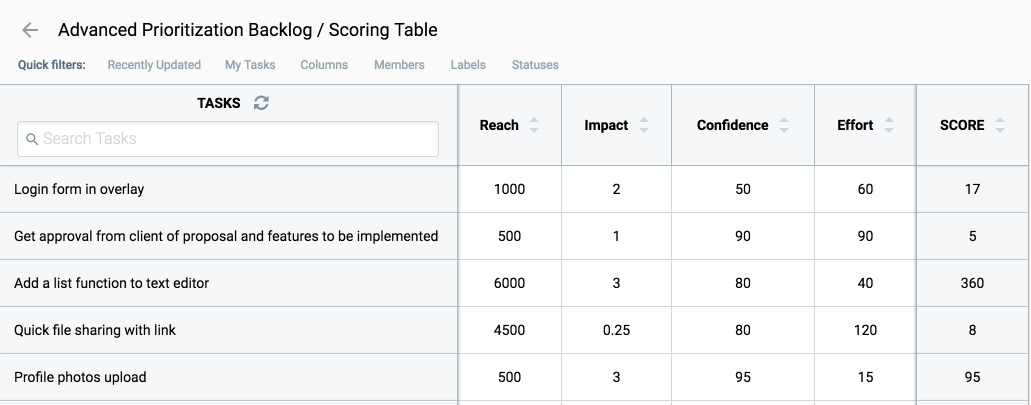
All features can also be seen in the table:
So you sort all the features, evaluating them and choosing “winners” from the top of the list, then sending them to the development using Push features.
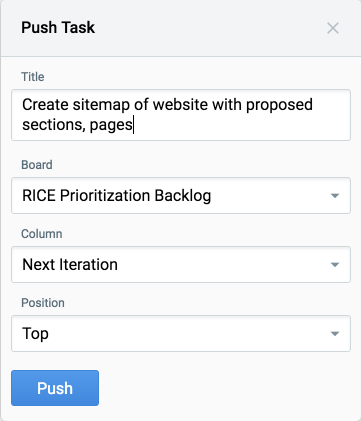
Push works like this:
If you have Epic on a backlog, then you can refer to several development tasks (for example, one task is on the frontend development, the second is the backend, the third is the mobile app for ios, the fourth is for Android). Epic will be “completed” when all the development tasks to which it refers are “completed”.
The same algorithm in the case of the choice of the ICE assessment model.
You need to evaluate each feature by the criteria of Impact, Confidence and Ease.

A convenient table also visualizes all your features:

This is a simple prioritization method based on a 2 × 2 matrix with two axes: Difficulty and
Value:
As a rule, we use and recommend using Value & Effort prioritization to evaluate ideas or initial feature selection for subsequent evaluation by ICE / RICE or by our criteria (Weighted Scoring).
In Hygger, the Priority Chart tool helps to visualize the matrix (available only for Value & Effort prioritization):

In addition, in the Hygger menu, you can choose to prioritize your own criteria - Weighted Scoring . But we will tell about this rating system and its advantages in more detail in one of the following articles.
Product roadmap requires a clear order. Only qualitatively expanding everything "on the shelves" can you get a decent and successful product release. In this case, you can not do without a convenient way to prioritize.
')
A high-quality prioritization system will help examine each feature or idea, each project or task and consistently combine all these factors.
Today PM offers a variety of popular methodologies for prioritizing from gaming to the most complex, quantitative and qualitative. All of them help managers and teams to answer a very important question: how to choose the right features for development ?
In this article we will look at two simple, but very useful techniques - RICE Scoring and the method of determining ICE priorities .
RICE Score Method
If you have several important and urgent features in the plan for implementation, how to understand which one to start first?
This important prioritization issue is at the core of all product management. The fee for choosing the wrong option may be too high.
RICE is a method for prioritizing product ideas and features. The abbreviation includes 4 factors that the product manager can safely use to evaluate and prioritize product features:
- Reach is coverage
- Impact - Impact
- Confidence - confidence in your assessment of coverage, impact and labor.
- Effort - labor costs
To get a score on RICE, you need to combine these factors.
Reach (Coverage)
The level of coverage is measured by the number of people / events for a certain period of time. This factor is designed to assess how many people each feature or project will affect during a certain period of time, and how many of your users will see such changes.
It is important to focus on real metrics, rather than using obscure numbers.
For example:
The feature will be used by 800 users per month.
1000 users are involved in onboarding, and 70% - only 700 users will see this feature.
Impact (Impact)
Influence shows what contribution this feature brings to the product.
Value is understood differently in each product. For example, in Hygger (B2B SaaS) for the current quarter, features get a high value if they are:
1. Improve trial-to-paid conversion (metric movers)
Based on your current goals, you will have your own metrics.
2. Help attract new users
These are features that help us get new users during onboarding. But do not forget that the majority of users "fall away" on the second day.
For example, in SaaS an excellent indicator of retention on the first day is an indicator of 15%. This means that 85% of people just go on the second day. Therefore, here you should think about the features that most new users will be able to see in the first session.
3. Help keep current users
Customers bought a subscription and are now asked to make some features. We do not "hurry" blindly to do everything. We accumulate statistics on each feature - how many clients asked for it. And then we implement the most popular features.
4. Add value to the product and rebuild us from competitors
There are more than five hundred project management systems on the market today. To survive and succeed, we need to do something completely new, it is desirable to increase the service life for users or reduce costs several times. Here we are looking for opportunities that can give us a competitive advantage, will create a reason for competitors' customers to come to us. This competitive advantage should be unique, difficult to repeat and, ideally, not replicable.
By the way, the impact is difficult to measure accurately. So, we choose from a scale with many options: 3 for “mass influence”, 2 for “high”, 1 for “medium”, 0.5 for “low” and, finally, 0.25 for “minimal”. These numbers are multiplied by the final result to scale it lower or higher.
Confidence
If you think that a feature can have a huge impact, but you have no data to prove it, Confidence allows you to control this point. Confidence is measured as a percentage.
for example
Project A: A product manager has quantitative indicators for the influence of a feature, and an estimate of labor costs. Thus, the project receives a 100% confidence rating.
Project B: The product manager has data on coverage and labor costs, but he is not sure about the impact factor. The project receives a confidence factor of 80%.
Project C: Coverage and impact may be lower than expected. Labor costs may be higher. The project receives a 50% confidence rating.
Effort (Man-hours)
Labor costs are estimated as the number of person-months, weeks, or hours, depending on needs.
For example:
Project A will take about a week of planning, 2 weeks of design and 3 weeks to develop, so labor costs will be 2 person-months.
For project B, you only need a planning week, 1-2 weeks to develop and will not require design. Labor costs will be equal to 1 person-month.
ICE evaluation method
The ICE prioritization method was coined by Shawn Ellis, who is known for writing the term Growth Hacker.
Initially, ICE was designed to prioritize growth experiments. Later, ICE was also used to prioritize features.
ICE Scoring: How does it work?
Calculate the estimate for each feature or idea, according to the formula:
- Influence shows how your idea will positively affect the key indicator that you are trying to improve.
- Ease of implementation is about the simplicity of implementation. This is an assessment of how much effort and resources are required to implement this idea.
- Confidence shows how confident you are in assessing the impact and ease of implementation.
In ICE, a scale from 1 to 10 is used so that all factors have a balanced effect on the final score. You can mean by 1-10 what you need, if only the values are consistent with each other.
As an example, apply this to the "Widgets for Dashboard" feature:
- Impact : how effective will it be? What will it give to our users and their goals and objectives?
- Ease of implementation : how easy will it be to develop, test and run this feature?
- Confidence : how can I be sure that this feature will lead to such an improvement, which I described in Impact and will take so much time?
ICE disadvantages
ICE Scoring is sometimes criticized for its subjectivity:
- the same feature can be evaluated differently by the same person at different times. This may affect the final list of priorities.
- if different people evaluate features, they will all evaluate it differently.
- team members who want their features to be prioritized can manipulate the results to get appruv.
How to use RICE and ICE Scoring?
Consider an example of using both models in a service for managing Hygger.io products and projects.
Where to begin?
First of all, you should already have the necessary features and product ideas gathered on your Kanban board. Using Hygger, you can structure them using the Swimlanes horizontal columns, as well as using Labels . You can also customize the process of working with features using Columns . For example, you can create the following workflow:
- Backlog - here you collect all the ideas and features
- Next Up - here you move the features you want to work on in the near future
- Specification - here you collect requirements and write specs on features
- Development - features are under development, and here you can track their current status
- Done - features have been successfully uploaded to the product and are now available to your users.
In the Hygger menu, you will find model options for evaluating and prioritizing features, including RICE and ICE:
Hygger Evaluation by RICE
First you need to evaluate each feature by Reach, Impact, Confidence and Effort.
All features can also be seen in the table:
So you sort all the features, evaluating them and choosing “winners” from the top of the list, then sending them to the development using Push features.
Push works like this:
- A task is created to implement the features on the development board — on a Kanban or Sprint board inside Hygger (yes, Hygger supports Kanban and Scrum). In the future, we will add integration with Jira and with other trackers of the task, since we are well aware that many teams use Jira to develop Jira and leave it for something else - anril
- the task on the backlog and the task on the development board are linked together
- when the task on the development board is fully completed, the task on the backlog will also be transferred to the done column.
If you have Epic on a backlog, then you can refer to several development tasks (for example, one task is on the frontend development, the second is the backend, the third is the mobile app for ios, the fourth is for Android). Epic will be “completed” when all the development tasks to which it refers are “completed”.
Hygger Evaluation by ICE
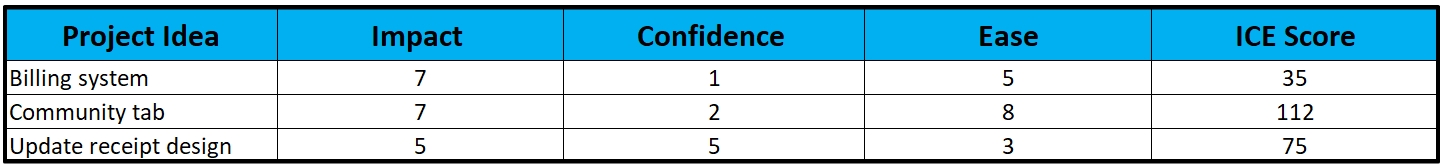
The same algorithm in the case of the choice of the ICE assessment model.
You need to evaluate each feature by the criteria of Impact, Confidence and Ease.
A convenient table also visualizes all your features:
Other ways to prioritize in Hygger
Prioritization of Value & Effort (aka Lean Prioritization)
This is a simple prioritization method based on a 2 × 2 matrix with two axes: Difficulty and
Value:
- Value is what a specific feature brings.
- Effort is the effort required to implement a feature.
As a rule, we use and recommend using Value & Effort prioritization to evaluate ideas or initial feature selection for subsequent evaluation by ICE / RICE or by our criteria (Weighted Scoring).
In Hygger, the Priority Chart tool helps to visualize the matrix (available only for Value & Effort prioritization):
- First we develop Quick Wins . These are features that bring the most value, but which can be quickly and easily implemented.
- Next - Big Bets . These features can bring a lot of value, but they are difficult to implement.
- Then - Maybes - tasks or features that will not give a lot of value, but they are easy to implement. They can be left for later.
- Finally, Time Sinks . On these features do not pay attention.
In addition, in the Hygger menu, you can choose to prioritize your own criteria - Weighted Scoring . But we will tell about this rating system and its advantages in more detail in one of the following articles.
Source: https://habr.com/ru/post/422131/
All Articles