Monsters after the holidays: AMD Threadripper 2990WX 32-Core and 2950X 16-Core (part 3 - tests)
Part 1 → Part 2 → Part 3 → Part 4 → Part 5
The “System Tests” section focuses on testing in real-world conditions that consumers face. In this section, we will look at application load times, image processing, simple physics, emulation, neural modeling, optimized computation, and the development of three-dimensional models, using readily available and customizable software. Although some of the tests more simply overlap with the capabilities of large packages, such as PCMark, (we publish these values in the office test section), it’s still worth considering different perspectives. In all tests we will explain in detail what exactly is being tested and how we are conducting the testing.
One of the most important aspects of user experience and workflow is the speed of response of the system. A good test in this case is to check the application download time. Most programs are now stored on an SSD and loaded almost instantly, but some office tools require preloading of assets. Most operating systems use caching, so when certain software is loaded frequently (web browser, office tools), it can be initialized much faster.
In the previous test suite, we checked how long it took to load a large PDF document into Adobe Acrobat. Unfortunately, this test became a nightmare in terms of programming, and refused to switch to Win10 RS3 without a fight. In the meantime, we have discovered an application that can automate this test, driving GIMP to them. GIMP is a popular and free photo editing application; it’s an open source editor and the main alternative to Adobe Photoshop. We configured it to load a large design pattern of 50 MB in size, performed the load 10 times with an interval of 10 seconds between them. Due to caching, the first 3-5 results are slower than subsequent ones, the time for caching may be inconsistent. Therefore, we derive the average of the last five results to show the processing of the CPU when the load is cached.
')
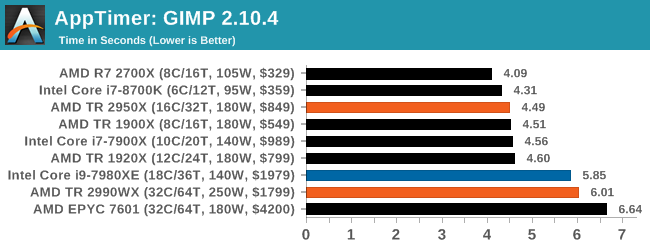
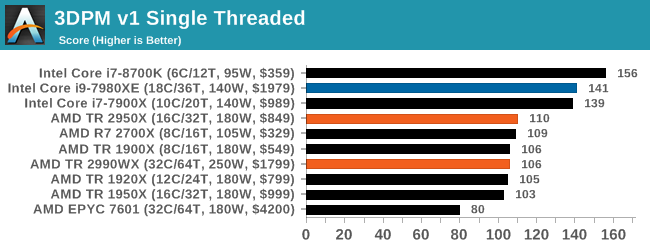
This benchmark neatly divided the contestants into two categories: processors with a small number of cores on one side, and top desktop processors - on the other. The 1920X and 2950X worked fast, and the 18-core Intel and the 32-core AMD slowed down. This is probably due to differences in the performance of one core, however, I suspect that the result could be affected by memory latency.
FCAT software was developed to detect micro-sticking, dropped frames, run graphics tests, when two video cards are combined to render the scene. Because of the game engines and graphics drivers, not all GPU combinations worked perfectly, with the result that the software fixed colors for each rendered frame and dynamically produced RAW data recording using a video capture device.
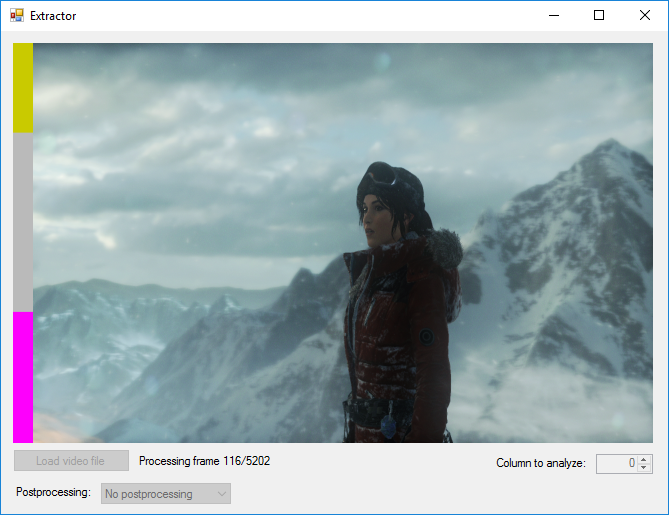
FCAT software takes recorded video, in our case it is 90 seconds 1440p of Rise of the Tomb Raider game, and converts color data into frame time data, so the system can display the “observed” frame rate and correlate with the power consumption of video accelerators. This test, because of how quickly it was compiled, is single-threaded. We start the process and as a result we get the completion time.
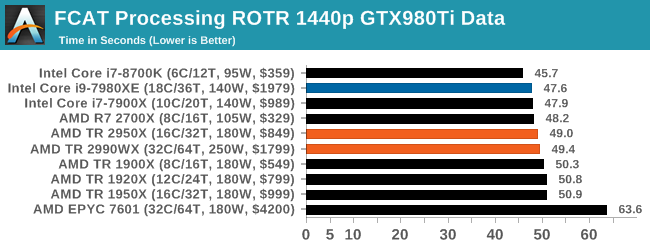
All test systems work about the same, but Intel’s faster single-processor performance places it higher than other processors. EPYC 7601 is the last in the list due to the low frequency of one core.
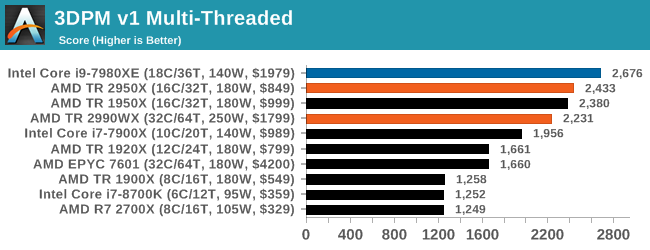
Our 3DPM test is a custom benchmark designed to simulate six different algorithms for the movement of particles in three-dimensional space. The algorithms were developed as part of my PhD thesis and, ultimately, work best on the GPU, give a good idea of how command flows are interpreted by different microarchitectures.
The key part of the algorithms is the generation of random numbers — we use relatively fast generation, which completes the implementation of dependency chains in code. The main update compared to the primitive first version of this code - the problem of False Sharing in the caches was solved, this was the main bottleneck. We are considering the use of the AVX2 and AVX512 versions of this test for future reviews.
For this test, we launch the stock set of particles using six different algorithms for 20 seconds with 10-second pauses, and report the total speed of movement of particles in millions of operations (movements) per second.
It seems that 3DPM loves streams and frequency, and therefore AMD occupies the first four places. Even the latest-generation 16-core processor from AMD surpasses the 18-core Intel processor in this test, using instructions other than AVX. It is interesting to look at the comparison between the 2990WX and EPYC 7601 - the additional frequency on the consumer processor helps improve performance by 30% +.
One of the most popular requested tests in our package is console emulation. The ability to choose a game from an outdated system and run it is very attractive and depends on the efforts of the emulator: a much more powerful x86 system is required to be able to accurately emulate an old console, different from x86. Especially if the code for this console was made taking into account some physical flaws and hardware bugs.
For our test, we use the popular Dolphin emulation software and run a computational project through it to determine how accurately our processors can emulate a console. In this test, the work under the Nintendo Wii emulation will last about 1050 seconds.
Dolphin performance, as a rule, depends on single-streaming characteristics, so Intel is again ahead, although it is strange that the last place was taken by the R7 2700X. To eliminate the erroneous result, I must run this test again. However, on the TR parts of the second generation, the higher clock frequency of 2950X allows it to overtake 2990WX by 20 seconds.
This benchmark was originally designed to model and visualize the activity of neurons and synapses in the brain. The software comes with various preset modes, we chose a small benchmark that performs brain simulation from 32 thousand neurons / 1.8 billion synapses, which is equivalent to the mollusk brain.

Any results above the "unit" are suitable for real-time work. Of the two modes, the mode “without launching synapses”, which is heavy for DRAM, and the mode “with launching synapses”, in which the processor is loaded, we choose the latter. Despite our choices, the test still affects the speed of DRAM.
With a large margin, four-matrix processors with a large number of cores are ahead, although the low frequency of the EPYC 7601 places it on the list of losers. It seems that the additional latency of the two-module structure in 2990WX did not damage the results too much, there is a suspicion that there is additional performance.
I once heard about y-Cruncher as a tool to help calculate various mathematical constants. But after talking with his developer Alex Yee (a NWU researcher and software optimization developer), I realized that he had optimized the software just in an incredible way to get the best performance. Any simulation that takes 20+ days will benefit from a 1% performance boost! Alex started working with y-Cruncher as a project back in high school, but now the project is relevant.
For our test, we run y-Cruncher v0.7.6 through all possible optimized variants of binary, single-threaded and multi-threaded computations, including binary files optimized for AVX-512. The test is to calculate 250 million characters of Pi, we use single-threaded and multi-threaded versions of this test.
Intel software is well optimized for AVX2 and AVX512 instructions, and we use this instruction set in a single-threaded test. However, when we load new cores and memory channels, both 32-core AMD processors look like worthy competitors to the Core i9, considering the cost.
One of the ISVs we have been working with for several years is Agisoft. The campaign is developing software called PhotoScan, which converts a series of 2D images into a 3D model. It is an important tool in the development and archiving of models, and relies on a number of single-threaded and multi-threaded algorithms to move from one side of the calculation to the other.
In our test, we take version 1.3.3 of the software with a large data set — photographs of 84 x 18 megapixels. We run the test on a fairly quick set of algorithms. The test is still more demanding than its forefather of 2017. As a result, we report the total time to complete the process.
2990WX is left behind, as it has cores that are not able to quickly access memory. For comparison, EPYC 7601 with twice the memory channel works almost 500 seconds (20% +) faster. Therefore, if the 2990WX receives additional memory channels, it will be able to head this list.
Interestingly, the TR 1950X bypasses the TR 2950X, which has better cache latency and higher frequency in all scenarios. Why so - a mystery.
In a professional environment, rendering is often the primary concern for processor workloads. It is used in various formats: from 3D rendering to rasterization, in such tasks as games or ray tracing, it uses the ability of software to manage meshes, textures, collisions, aliases, and physics (in animation). Most renderers offer code for the CPU, while some of them use graphics processors and choose environments that use FPGA or specialized ASICs. For large studios, processors are still the main hardware.
An improved renderer optimized for software performance, such as 3ds Max and Cinema 4D, the Corona test renders the generated scene of the standard version 1.3. Typically, the implementation of the benchmark GUI shows the process of building the scene, allowing the user to see the result as “time to complete”.

We contacted the developer, he gave us the command line version of the test, which provides a direct output of the results. Instead of building the scene, we report the average number of rays per second for six runs, because the ratio of the actions performed to the units of time is visually easier to understand.
So, AMD tore our graphics engine. Because we show the result of the Corona test in rays per second, having a total of 12 million, which transmits eight digits to our engine, which then tries to interpret it as an exponential representation of a number (1.2 x 10 ^ 7), which it cannot display on the graph . We had to convert this graph to millions of rays per second to make the engine work.
The 2990WX pulls ahead with 32 cores due to its high frequency, it is well ahead of the EPYC processor. EPYC and Core i9 are close to each other, but the TR2950X is half the price.
A high quality rendering tool, Blender is an open source product with many settings and configurations used by many high-end animation studios around the world. The organization recently released the Blender test suite, a new test may take more than an hour. To get the results, we launch one of the subtests in this package via the command line - the standard bmw27 scene in the “CPU only” mode, measure the rendering completion time.
Additional cores allow the 2990WX to outperform the EPYC and Core i9. Additional bandwidth 2990WX + 58% compared with the Core i9.
There are many different ways to handle rendering data: CPU, GPU, Accelerator and others. In addition, there are many frameworks and APIs. LuxMark - the benchmark, developed using the LuxRender mechanism, offers several different scenes and an API.
taken from the Linux version of LuxMark
In our test, we run a simple “Ball” scene on C ++ and OpenCL code, but in CPU mode. This scene begins with a rough rendering and slowly improves its quality over two minutes. The average number of kilo-rays per second is taken.
For some reason, Intel Skylake-X processors fail in our OpenCL testing. In the C ++ test, additional memory controllers on the EPYC processor set it above the TR2 and Core i9. 2990WX and Core i9 are almost equal.
The Persistence of Vision ray tracing engine is another well-known benchmarking tool that has been dormant for a while until AMD released its Zen processors. Suddenly, both Intel and AMD began to push the code into the main branch of the open source project. For our test, we use the built-in test for all cores, called from the command line.
This is another test that loves cores and frequencies, which is what the 2990WX has. 2990WX is able to complete the test in almost 20 seconds. Perhaps it is time for a larger embedded test.
The Office Test Suite is a set of industry standard benchmarks that focus on office workflows. These are synthetic tests, + we check the compiler performance in this section. To evaluate the equipment as a whole, these criteria are important to users.
Futuremark, now known as UL, has been developing tests that have been industry standards for over two decades. The last set of system tests is PCMark 10. Here, compared to PCMark 8, several tests have been improved, more attention is paid to OpenCL, and specifically in such cases as video streaming.
PCMark splits its assessments into approximately 14 different areas, including application launch, web pages, spreadsheets, photo editing, rendering, video conferencing and physics. We publish all this data in our Bench database. The key indicator for the current review is the overall score.
One of the drawbacks of PCMark is that it seems to collect all the results, yielding a certain average value in all directions. Interesting, but Intel processors are left behind, 2950X and 2700X - in the top.
A large number of AnandTech readers are software engineers who look at how hardware works. Compiling a Linux kernel is “standard” for reviewers who often compile. But our test is a bit more diverse - we use the Windows instructions for compiling Chrome, in particular, the Chrome build March 56, 2017. Google's instructions on how to compile for Windows after downloading 400,000 files from the repository are quite detailed.
In our test, following Google’s instructions, we use the MSVC compiler and ninja to manage the compilation. As you would expect, this is a multi-threaded test, with variable DRAM requirements that benefit from faster caches. Test results are the time taken to compile, which we convert to the number of compilations per day.
This test is such a pleasant combination of ST, MT streams and limited memory that it is really interesting to see the end result. Unfortunately, the output files for our new package were configured incorrectly, so despite the completion of the test, we received only a few results. But even this demonstrates an interesting metric: the 2950X is breaking out ahead of the 2990WX along with the Core i9, while the EPYC system grazes the rear because of its low frequencies.
Along with PCMark there is a benchmark 3DMark, Futuremark (UL) - a set of game tests. Each game test consists of one or two scenes, heavy for the GPU, as well as a physical test, depending on when the test was written and on which platform it is aimed. The main subjects, in order of increasing complexity, are Ice Storm, Cloud Gate, Sky Diver, Fire Strike and Time Spy.
Some of the subtests offer other options, such as Ice Storm Unlimited or Fire Strike. Ice Storm Unlimited is designed for mobile platforms with off-screen rendering. Fire Strike Ultra is designed for high-performance 4K systems with a large number of added features. It is worth noting that Time Spy currently has AVX-512 mode (which we can use in the future).
As for our tests, we send the results of each physical test to Bench, but for review we take the results of the most demanding scenes: Ice Storm Unlimited, Cloud Gate, Sky Diver, Fire Strike Ultra and Time Spy,
In game tests, it is not so noticeable that the presence of large processors with a multitude of cores does not particularly benefit performance. Game physics clearly prefers memory bandwidth. We know that Time Spy is not designed to scale more than 10 cores, and we see that the 10-core processor came first. For some test runs, the benchmark was configured incorrectly, so it will be interesting to see what it will show with other mid-level and high-level processors.
A common tool for cross-platform testing on mobile devices, PCs and Macs, GeekBench 4 is the perfect synthetic test of the system using a variety of algorithms that require maximum throughput. Tests include encryption, compression, fast Fourier transform, memory operations, n-body physics, matrix operations, histogram manipulation, and HTML passring.
I include this test because of the popularity of the request, although its results are very much synthetic. Many users often attach great importance to its results due to the fact that it is compiled on different platforms (albeit by different compilers).
We write evaluations of the main subtests (Crypto, Integer, Floating Point, Memory) into our database of test results, but for review we publish only general single and multi-threaded results.
With the increasing number of streams, video blogs and video content in general, encoding and transcoding tests are becoming more and more important. Not only does the number of home users and gamers becoming involved in converting video files and video streams grow, the servers that process data streams need to be encrypted on the fly, compressed, and decompressed logs. Our coding tests are aimed at such scenarios, and take into account the opinion of the community to provide the most current results.
A popular open source tool, Handbrake is video conversion software in every possible way, which, in a sense, is the benchmark. The danger here lies in the version numbers and in the optimization. For example, the latest software versions can take advantage of the AVX-512 and OpenCL to speed up certain types of transcoding and certain algorithms. The version we are using is clean CPU work with standard transcoding options.
We divided Handbrake into several tests using recording from a Logitech C920 1080p60 native webcam (essentially recording a stream). The record will be converted to two types of stream formats and one for archiving. Used output parameters:
Video encoding depends on the explosive mixture of multithreading, memory latency and computational power. Core i9, with instructions AVX2, takes absolute leadership in all three tests. AMD's results seem somewhat inconstant, but the 1950X and 2700X are still ahead of their fellows. Unfortunately, we did not get the results of the work of the 2950X in our initial runs, but I assume that it will show itself as a competitor to the Core i9, considering where the 1950X is located. However, 2990WX showed not the best result.
Of all our archiving / unarchiving tests, 7-zip is the most requested, and has a built-in benchmark. In our test suite, we added the latest version of this software, and run the benchmark from the command line. The results of archiving and unarchiving are displayed as a single total score.
In this test, it is clearly seen that modern processors with several matrices have a large difference in performance between compression and decompression: they perform well in one and badly in the other. In addition, we are actively discussing how Windows Scheduler implements each thread. When we get more results, we will be happy to share our thoughts on this matter.
Oh yes, this test suite was very interesting. When we first published this review, still without comment, the result of archiving at 2990WX, which turned out to be the worst, was distributed on social networks at a tremendous speed, telling about the low productivity of AMD. It was also used in conjunction with the Phoronix tests, which showed a much better picture under Linux.
But I am confused by the fact that almost no one published the result of the unarchiving test. Here, 32-core AMD processors turned out to be the best, and 16 and 18-core processors took the following places.
If you plan on reposting some results, please include others. Otherwise, you represent only half of the picture.
When I need a compression tool, I usually choose WinRAR. Many users of my generation used it more than two decades ago. The interface has hardly changed, although integration with the right-click commands in Windows is a very nice plus. It does not have a built-in benchmark, so we run a compression directory containing more than 30 60-second video files and 2000 small web files, with a normal compression rate.
WinRAR has variable threading and is demanding for caching, so in our test we run it 10 times and calculate the average value for the last five runs in order to check only the processor performance.
A set of high-frequency cores and good memory is clearly important, but an hour later, higher memory bandwidth and lower latency are more important. At the top is AMD's R7 2700X, followed by the 10-core Intel processor in second place. I’m surprised that I don’t see the leaders of the 8700K; perhaps its six cores are not enough. A large number of AMD cores did not bring victory in this competition, 32-core processors performed the task the longest.
A number of platforms, especially mobile devices, encrypt filesystems by default to protect content. On Windows-based systems, BitLocker from Microsoft (or third-party software) is often used to encrypt data. In the AES encryption test, we used the discontinued TrueCrypt in the benchmark, which tests several encryption algorithms directly in memory.
The data from this test is the combined AES encryption / decryption performance, measured in gigabytes per second. The software uses AES commands if the processor allows it, but does not use the AVX-512.
If there are many cores, this test shows good results. , , 2990WX . EPYC 7601 , 1950X. 2950X, , , 18- Core i9 Intel.
low-end small form factor , -, , . - , , - . , ( ) . , - . - , , , .
, .
, XPRT, Principled Technologies, -, , , «3». ( , ) : , , , , HTML5, , .
, . , .
WebXPRT — 2015 , - . - , , - . - . , , , . — , . « » .
WebXPRT3, , . , .
- — Speedometer 2, javascript, : , . , , , -.
«rpm», . .
- , — Octane Google. 2.0 , , , , , — .
. .
, Octane, Kraken, Mozilla. , , . Kraken , .
. , .

«» — 3DPM. , , , ( ). , , .
(-O2, -fp: fast): OpenMP . , false sharing . , , .
This transcoding test is very old, it was used by Anandtech in the days of the Pentium 4 and Athlon II processors. In it, standardized 720p video is recoded with double conversion, and the benchmark shows frames per second of each pass. The test is single-threaded, and in some architectures we run into the IPC restriction — instructions-per-clock.

Thank you for staying with us. Do you like our articles? Want to see more interesting materials? Support us by placing an order or recommending to friends, 30% discount for Habr users on a unique analogue of the entry-level servers that we invented for you: The whole truth about VPS (KVM) E5-2650 v4 (6 Cores) 10GB DDR4 240GB SSD 1Gbps from $ 20 or how to share the server? (Options are available with RAID1 and RAID10, up to 24 cores and up to 40GB DDR4).
3 months for free if you pay for new Dell R630 for half a year - 2 x Intel Deca-Core Xeon E5-2630 v4 / 128GB DDR4 / 4x1TB HDD or 2x240GB SSD / 1Gbps 10 TB - from $ 99.33 a month , only until the end of August, order can be here .
Dell R730xd 2 times cheaper? Only we have 2 x Intel Dodeca-Core Xeon E5-2650v4 128GB DDR4 6x480GB SSD 1Gbps 100 TV from $ 249 in the Netherlands and the USA! Read about How to build an infrastructure building. class c using servers Dell R730xd E5-2650 v4 worth 9000 euros for a penny?
HEDT tests: system tests
The “System Tests” section focuses on testing in real-world conditions that consumers face. In this section, we will look at application load times, image processing, simple physics, emulation, neural modeling, optimized computation, and the development of three-dimensional models, using readily available and customizable software. Although some of the tests more simply overlap with the capabilities of large packages, such as PCMark, (we publish these values in the office test section), it’s still worth considering different perspectives. In all tests we will explain in detail what exactly is being tested and how we are conducting the testing.
Application Download: GIMP 2.10.4
One of the most important aspects of user experience and workflow is the speed of response of the system. A good test in this case is to check the application download time. Most programs are now stored on an SSD and loaded almost instantly, but some office tools require preloading of assets. Most operating systems use caching, so when certain software is loaded frequently (web browser, office tools), it can be initialized much faster.
In the previous test suite, we checked how long it took to load a large PDF document into Adobe Acrobat. Unfortunately, this test became a nightmare in terms of programming, and refused to switch to Win10 RS3 without a fight. In the meantime, we have discovered an application that can automate this test, driving GIMP to them. GIMP is a popular and free photo editing application; it’s an open source editor and the main alternative to Adobe Photoshop. We configured it to load a large design pattern of 50 MB in size, performed the load 10 times with an interval of 10 seconds between them. Due to caching, the first 3-5 results are slower than subsequent ones, the time for caching may be inconsistent. Therefore, we derive the average of the last five results to show the processing of the CPU when the load is cached.
')
This benchmark neatly divided the contestants into two categories: processors with a small number of cores on one side, and top desktop processors - on the other. The 1920X and 2950X worked fast, and the 18-core Intel and the 32-core AMD slowed down. This is probably due to differences in the performance of one core, however, I suspect that the result could be affected by memory latency.
FCAT: image processing
FCAT software was developed to detect micro-sticking, dropped frames, run graphics tests, when two video cards are combined to render the scene. Because of the game engines and graphics drivers, not all GPU combinations worked perfectly, with the result that the software fixed colors for each rendered frame and dynamically produced RAW data recording using a video capture device.
FCAT software takes recorded video, in our case it is 90 seconds 1440p of Rise of the Tomb Raider game, and converts color data into frame time data, so the system can display the “observed” frame rate and correlate with the power consumption of video accelerators. This test, because of how quickly it was compiled, is single-threaded. We start the process and as a result we get the completion time.
All test systems work about the same, but Intel’s faster single-processor performance places it higher than other processors. EPYC 7601 is the last in the list due to the low frequency of one core.
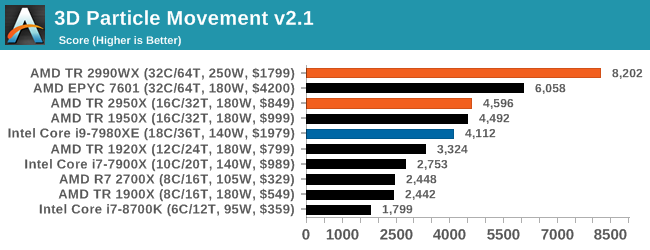
3D Particle Movement v2.1: Brownian Motion
Our 3DPM test is a custom benchmark designed to simulate six different algorithms for the movement of particles in three-dimensional space. The algorithms were developed as part of my PhD thesis and, ultimately, work best on the GPU, give a good idea of how command flows are interpreted by different microarchitectures.
The key part of the algorithms is the generation of random numbers — we use relatively fast generation, which completes the implementation of dependency chains in code. The main update compared to the primitive first version of this code - the problem of False Sharing in the caches was solved, this was the main bottleneck. We are considering the use of the AVX2 and AVX512 versions of this test for future reviews.
For this test, we launch the stock set of particles using six different algorithms for 20 seconds with 10-second pauses, and report the total speed of movement of particles in millions of operations (movements) per second.
It seems that 3DPM loves streams and frequency, and therefore AMD occupies the first four places. Even the latest-generation 16-core processor from AMD surpasses the 18-core Intel processor in this test, using instructions other than AVX. It is interesting to look at the comparison between the 2990WX and EPYC 7601 - the additional frequency on the consumer processor helps improve performance by 30% +.
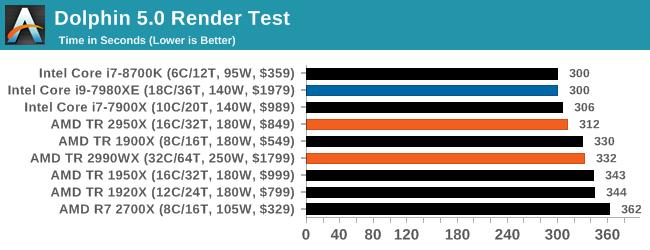
Dolphin 5.0: console emulation
One of the most popular requested tests in our package is console emulation. The ability to choose a game from an outdated system and run it is very attractive and depends on the efforts of the emulator: a much more powerful x86 system is required to be able to accurately emulate an old console, different from x86. Especially if the code for this console was made taking into account some physical flaws and hardware bugs.
For our test, we use the popular Dolphin emulation software and run a computational project through it to determine how accurately our processors can emulate a console. In this test, the work under the Nintendo Wii emulation will last about 1050 seconds.
Dolphin performance, as a rule, depends on single-streaming characteristics, so Intel is again ahead, although it is strange that the last place was taken by the R7 2700X. To eliminate the erroneous result, I must run this test again. However, on the TR parts of the second generation, the higher clock frequency of 2950X allows it to overtake 2990WX by 20 seconds.
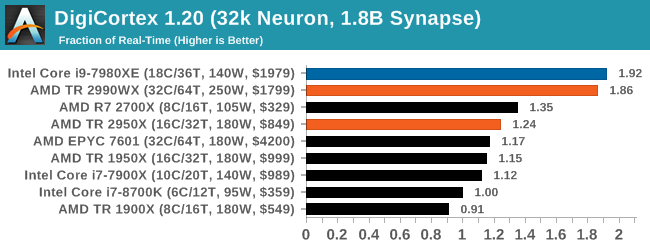
DigiCortex 1.20: Mollusc Brain Modeling
This benchmark was originally designed to model and visualize the activity of neurons and synapses in the brain. The software comes with various preset modes, we chose a small benchmark that performs brain simulation from 32 thousand neurons / 1.8 billion synapses, which is equivalent to the mollusk brain.
Any results above the "unit" are suitable for real-time work. Of the two modes, the mode “without launching synapses”, which is heavy for DRAM, and the mode “with launching synapses”, in which the processor is loaded, we choose the latter. Despite our choices, the test still affects the speed of DRAM.
With a large margin, four-matrix processors with a large number of cores are ahead, although the low frequency of the EPYC 7601 places it on the list of losers. It seems that the additional latency of the two-module structure in 2990WX did not damage the results too much, there is a suspicion that there is additional performance.
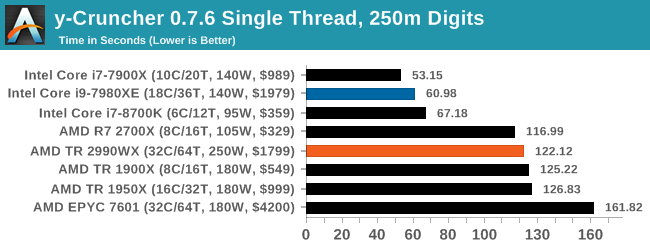
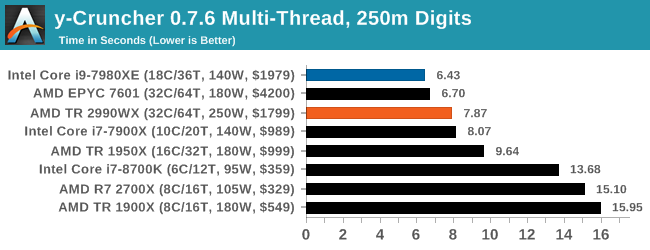
y-Cruncher v0.7.6: calculations optimized for micro-architecture
I once heard about y-Cruncher as a tool to help calculate various mathematical constants. But after talking with his developer Alex Yee (a NWU researcher and software optimization developer), I realized that he had optimized the software just in an incredible way to get the best performance. Any simulation that takes 20+ days will benefit from a 1% performance boost! Alex started working with y-Cruncher as a project back in high school, but now the project is relevant.
For our test, we run y-Cruncher v0.7.6 through all possible optimized variants of binary, single-threaded and multi-threaded computations, including binary files optimized for AVX-512. The test is to calculate 250 million characters of Pi, we use single-threaded and multi-threaded versions of this test.
Intel software is well optimized for AVX2 and AVX512 instructions, and we use this instruction set in a single-threaded test. However, when we load new cores and memory channels, both 32-core AMD processors look like worthy competitors to the Core i9, considering the cost.
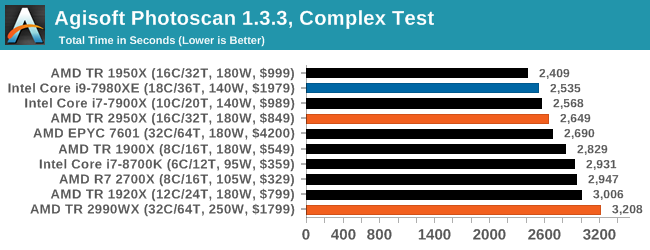
Agisoft Photoscan 1.3.3: 2D image conversion to 3D model
One of the ISVs we have been working with for several years is Agisoft. The campaign is developing software called PhotoScan, which converts a series of 2D images into a 3D model. It is an important tool in the development and archiving of models, and relies on a number of single-threaded and multi-threaded algorithms to move from one side of the calculation to the other.
In our test, we take version 1.3.3 of the software with a large data set — photographs of 84 x 18 megapixels. We run the test on a fairly quick set of algorithms. The test is still more demanding than its forefather of 2017. As a result, we report the total time to complete the process.
2990WX is left behind, as it has cores that are not able to quickly access memory. For comparison, EPYC 7601 with twice the memory channel works almost 500 seconds (20% +) faster. Therefore, if the 2990WX receives additional memory channels, it will be able to head this list.
Interestingly, the TR 1950X bypasses the TR 2950X, which has better cache latency and higher frequency in all scenarios. Why so - a mystery.
HEDT Benchmarks: Rendering Tests
In a professional environment, rendering is often the primary concern for processor workloads. It is used in various formats: from 3D rendering to rasterization, in such tasks as games or ray tracing, it uses the ability of software to manage meshes, textures, collisions, aliases, and physics (in animation). Most renderers offer code for the CPU, while some of them use graphics processors and choose environments that use FPGA or specialized ASICs. For large studios, processors are still the main hardware.
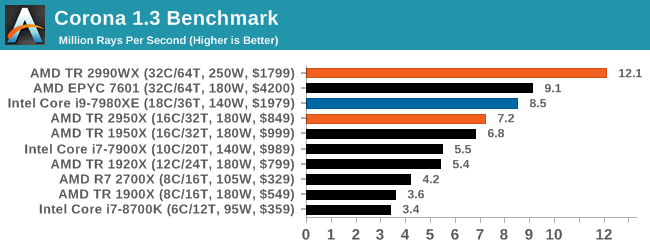
Corona 1.3: Performance Render
An improved renderer optimized for software performance, such as 3ds Max and Cinema 4D, the Corona test renders the generated scene of the standard version 1.3. Typically, the implementation of the benchmark GUI shows the process of building the scene, allowing the user to see the result as “time to complete”.
We contacted the developer, he gave us the command line version of the test, which provides a direct output of the results. Instead of building the scene, we report the average number of rays per second for six runs, because the ratio of the actions performed to the units of time is visually easier to understand.
So, AMD tore our graphics engine. Because we show the result of the Corona test in rays per second, having a total of 12 million, which transmits eight digits to our engine, which then tries to interpret it as an exponential representation of a number (1.2 x 10 ^ 7), which it cannot display on the graph . We had to convert this graph to millions of rays per second to make the engine work.
The 2990WX pulls ahead with 32 cores due to its high frequency, it is well ahead of the EPYC processor. EPYC and Core i9 are close to each other, but the TR2950X is half the price.
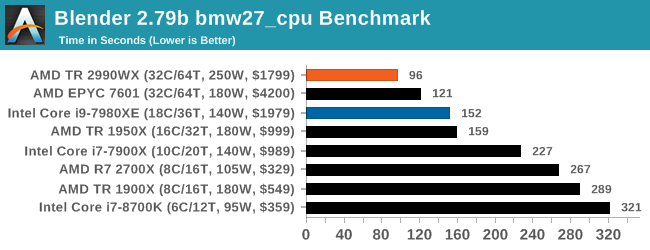
Blender 2.79b: 3D Creation Suite
A high quality rendering tool, Blender is an open source product with many settings and configurations used by many high-end animation studios around the world. The organization recently released the Blender test suite, a new test may take more than an hour. To get the results, we launch one of the subtests in this package via the command line - the standard bmw27 scene in the “CPU only” mode, measure the rendering completion time.
Additional cores allow the 2990WX to outperform the EPYC and Core i9. Additional bandwidth 2990WX + 58% compared with the Core i9.
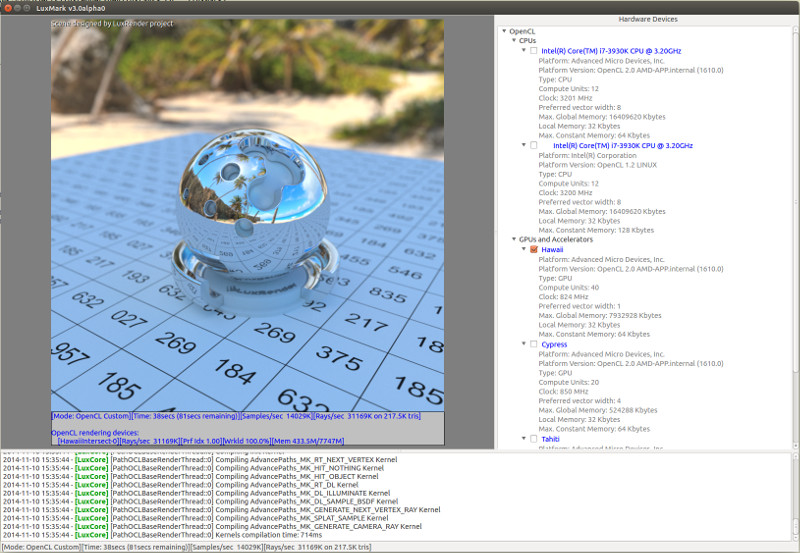
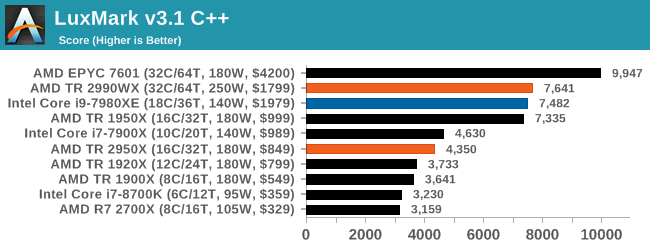
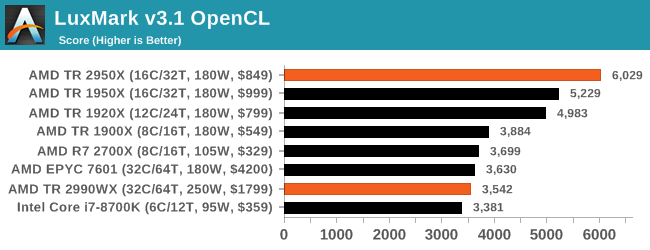
LuxMark v3.1: LuxRender via various code paths
There are many different ways to handle rendering data: CPU, GPU, Accelerator and others. In addition, there are many frameworks and APIs. LuxMark - the benchmark, developed using the LuxRender mechanism, offers several different scenes and an API.
taken from the Linux version of LuxMark
In our test, we run a simple “Ball” scene on C ++ and OpenCL code, but in CPU mode. This scene begins with a rough rendering and slowly improves its quality over two minutes. The average number of kilo-rays per second is taken.
For some reason, Intel Skylake-X processors fail in our OpenCL testing. In the C ++ test, additional memory controllers on the EPYC processor set it above the TR2 and Core i9. 2990WX and Core i9 are almost equal.
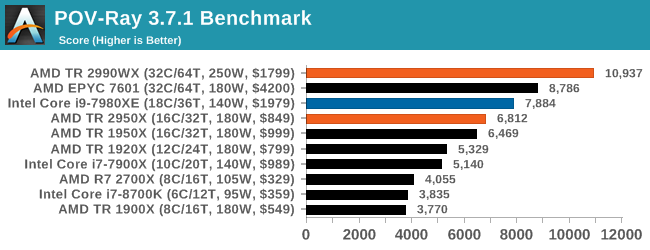
POV-Ray 3.7.1: ray tracing
The Persistence of Vision ray tracing engine is another well-known benchmarking tool that has been dormant for a while until AMD released its Zen processors. Suddenly, both Intel and AMD began to push the code into the main branch of the open source project. For our test, we use the built-in test for all cores, called from the command line.
This is another test that loves cores and frequencies, which is what the 2990WX has. 2990WX is able to complete the test in almost 20 seconds. Perhaps it is time for a larger embedded test.
HEDT Benchmarks: Office Tests
The Office Test Suite is a set of industry standard benchmarks that focus on office workflows. These are synthetic tests, + we check the compiler performance in this section. To evaluate the equipment as a whole, these criteria are important to users.
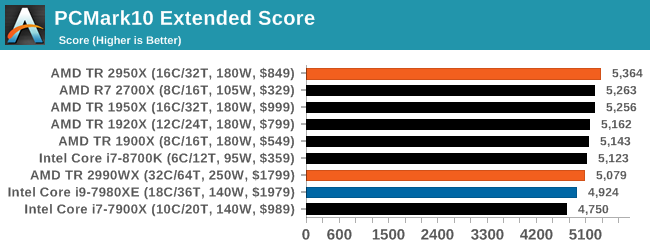
PCMark 10: industry standard
Futuremark, now known as UL, has been developing tests that have been industry standards for over two decades. The last set of system tests is PCMark 10. Here, compared to PCMark 8, several tests have been improved, more attention is paid to OpenCL, and specifically in such cases as video streaming.
PCMark splits its assessments into approximately 14 different areas, including application launch, web pages, spreadsheets, photo editing, rendering, video conferencing and physics. We publish all this data in our Bench database. The key indicator for the current review is the overall score.
One of the drawbacks of PCMark is that it seems to collect all the results, yielding a certain average value in all directions. Interesting, but Intel processors are left behind, 2950X and 2700X - in the top.
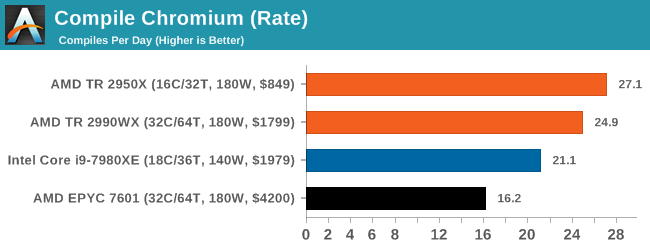
Chromium Compile: Windows VC ++ Compiling Chrome 56
A large number of AnandTech readers are software engineers who look at how hardware works. Compiling a Linux kernel is “standard” for reviewers who often compile. But our test is a bit more diverse - we use the Windows instructions for compiling Chrome, in particular, the Chrome build March 56, 2017. Google's instructions on how to compile for Windows after downloading 400,000 files from the repository are quite detailed.
In our test, following Google’s instructions, we use the MSVC compiler and ninja to manage the compilation. As you would expect, this is a multi-threaded test, with variable DRAM requirements that benefit from faster caches. Test results are the time taken to compile, which we convert to the number of compilations per day.
This test is such a pleasant combination of ST, MT streams and limited memory that it is really interesting to see the end result. Unfortunately, the output files for our new package were configured incorrectly, so despite the completion of the test, we received only a few results. But even this demonstrates an interesting metric: the 2950X is breaking out ahead of the 2990WX along with the Core i9, while the EPYC system grazes the rear because of its low frequencies.
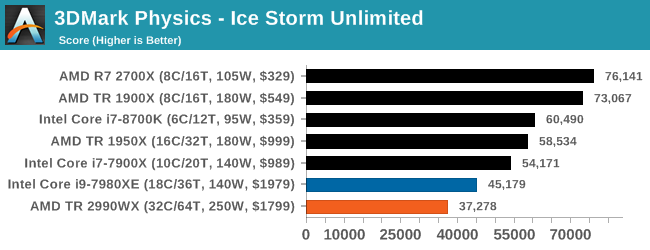
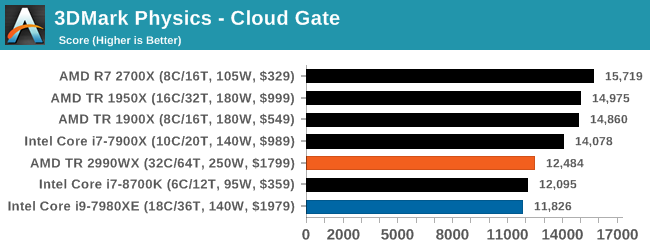
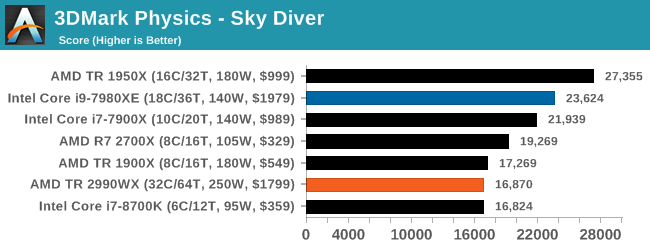
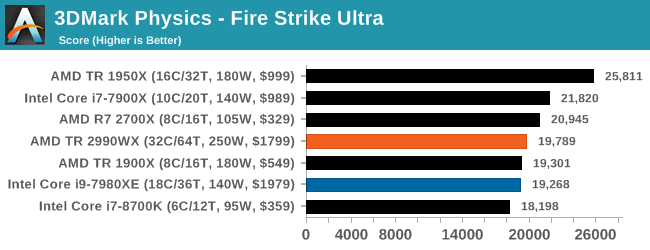
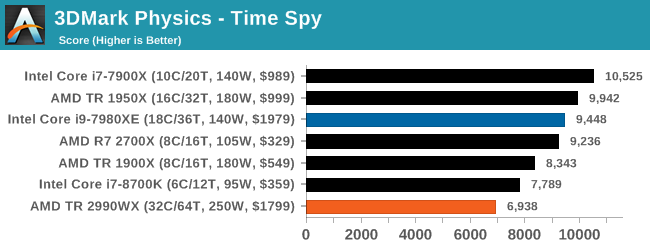
3DMark Physics: calculating physics in games
Along with PCMark there is a benchmark 3DMark, Futuremark (UL) - a set of game tests. Each game test consists of one or two scenes, heavy for the GPU, as well as a physical test, depending on when the test was written and on which platform it is aimed. The main subjects, in order of increasing complexity, are Ice Storm, Cloud Gate, Sky Diver, Fire Strike and Time Spy.
Some of the subtests offer other options, such as Ice Storm Unlimited or Fire Strike. Ice Storm Unlimited is designed for mobile platforms with off-screen rendering. Fire Strike Ultra is designed for high-performance 4K systems with a large number of added features. It is worth noting that Time Spy currently has AVX-512 mode (which we can use in the future).
As for our tests, we send the results of each physical test to Bench, but for review we take the results of the most demanding scenes: Ice Storm Unlimited, Cloud Gate, Sky Diver, Fire Strike Ultra and Time Spy,
In game tests, it is not so noticeable that the presence of large processors with a multitude of cores does not particularly benefit performance. Game physics clearly prefers memory bandwidth. We know that Time Spy is not designed to scale more than 10 cores, and we see that the 10-core processor came first. For some test runs, the benchmark was configured incorrectly, so it will be interesting to see what it will show with other mid-level and high-level processors.
GeekBench4: Synthetic Test
A common tool for cross-platform testing on mobile devices, PCs and Macs, GeekBench 4 is the perfect synthetic test of the system using a variety of algorithms that require maximum throughput. Tests include encryption, compression, fast Fourier transform, memory operations, n-body physics, matrix operations, histogram manipulation, and HTML passring.
I include this test because of the popularity of the request, although its results are very much synthetic. Many users often attach great importance to its results due to the fact that it is compiled on different platforms (albeit by different compilers).
We write evaluations of the main subtests (Crypto, Integer, Floating Point, Memory) into our database of test results, but for review we publish only general single and multi-threaded results.
HEDT Benchmarks: Encoding Tests
With the increasing number of streams, video blogs and video content in general, encoding and transcoding tests are becoming more and more important. Not only does the number of home users and gamers becoming involved in converting video files and video streams grow, the servers that process data streams need to be encrypted on the fly, compressed, and decompressed logs. Our coding tests are aimed at such scenarios, and take into account the opinion of the community to provide the most current results.
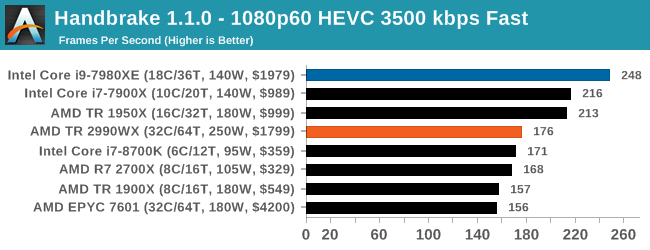
Handbrake 1.1.0: streaming and archiving video transcoding
A popular open source tool, Handbrake is video conversion software in every possible way, which, in a sense, is the benchmark. The danger here lies in the version numbers and in the optimization. For example, the latest software versions can take advantage of the AVX-512 and OpenCL to speed up certain types of transcoding and certain algorithms. The version we are using is clean CPU work with standard transcoding options.
We divided Handbrake into several tests using recording from a Logitech C920 1080p60 native webcam (essentially recording a stream). The record will be converted to two types of stream formats and one for archiving. Used output parameters:
- 720p60 at 6000kbps
- 1080p60 at 3500 kbps, faster bit rate, faster setting, main profile
- 1080p60 HEVC at 3500 kbps variable bit rate, main setting
Video encoding depends on the explosive mixture of multithreading, memory latency and computational power. Core i9, with instructions AVX2, takes absolute leadership in all three tests. AMD's results seem somewhat inconstant, but the 1950X and 2700X are still ahead of their fellows. Unfortunately, we did not get the results of the work of the 2950X in our initial runs, but I assume that it will show itself as a competitor to the Core i9, considering where the 1950X is located. However, 2990WX showed not the best result.
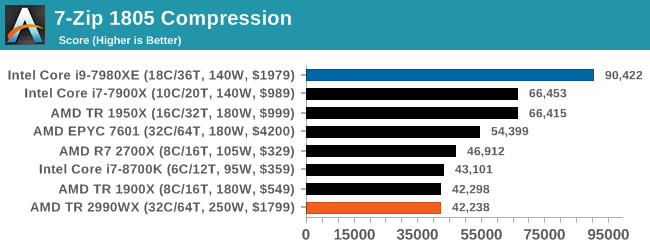
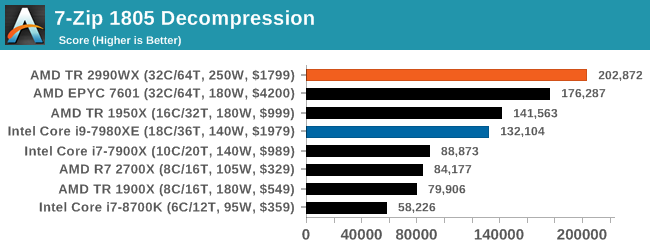
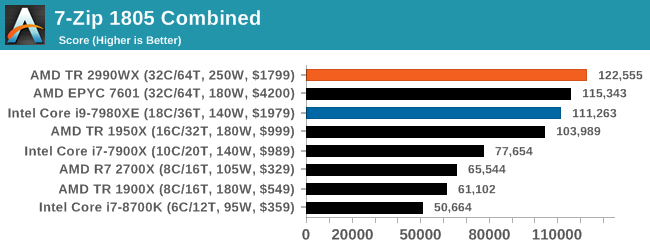
7-zip v1805: the popular open source archiver
Of all our archiving / unarchiving tests, 7-zip is the most requested, and has a built-in benchmark. In our test suite, we added the latest version of this software, and run the benchmark from the command line. The results of archiving and unarchiving are displayed as a single total score.
In this test, it is clearly seen that modern processors with several matrices have a large difference in performance between compression and decompression: they perform well in one and badly in the other. In addition, we are actively discussing how Windows Scheduler implements each thread. When we get more results, we will be happy to share our thoughts on this matter.
Oh yes, this test suite was very interesting. When we first published this review, still without comment, the result of archiving at 2990WX, which turned out to be the worst, was distributed on social networks at a tremendous speed, telling about the low productivity of AMD. It was also used in conjunction with the Phoronix tests, which showed a much better picture under Linux.
But I am confused by the fact that almost no one published the result of the unarchiving test. Here, 32-core AMD processors turned out to be the best, and 16 and 18-core processors took the following places.
If you plan on reposting some results, please include others. Otherwise, you represent only half of the picture.
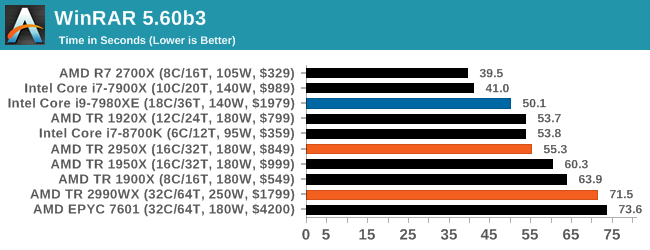
WinRAR 5.60b3: Archiver
When I need a compression tool, I usually choose WinRAR. Many users of my generation used it more than two decades ago. The interface has hardly changed, although integration with the right-click commands in Windows is a very nice plus. It does not have a built-in benchmark, so we run a compression directory containing more than 30 60-second video files and 2000 small web files, with a normal compression rate.
WinRAR has variable threading and is demanding for caching, so in our test we run it 10 times and calculate the average value for the last five runs in order to check only the processor performance.
A set of high-frequency cores and good memory is clearly important, but an hour later, higher memory bandwidth and lower latency are more important. At the top is AMD's R7 2700X, followed by the 10-core Intel processor in second place. I’m surprised that I don’t see the leaders of the 8700K; perhaps its six cores are not enough. A large number of AMD cores did not bring victory in this competition, 32-core processors performed the task the longest.
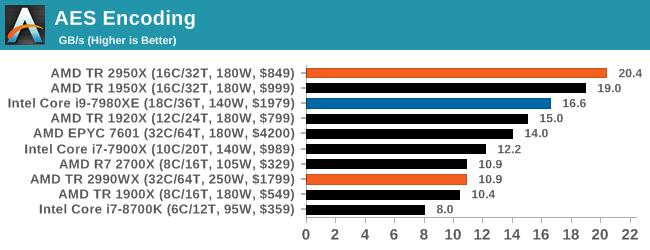
AES Encryption: File Protection
A number of platforms, especially mobile devices, encrypt filesystems by default to protect content. On Windows-based systems, BitLocker from Microsoft (or third-party software) is often used to encrypt data. In the AES encryption test, we used the discontinued TrueCrypt in the benchmark, which tests several encryption algorithms directly in memory.
The data from this test is the combined AES encryption / decryption performance, measured in gigabytes per second. The software uses AES commands if the processor allows it, but does not use the AVX-512.
If there are many cores, this test shows good results. , , 2990WX . EPYC 7601 , 1950X. 2950X, , , 18- Core i9 Intel.
HEDT Benchmarks: -
low-end small form factor , -, , . - , , - . , ( ) . , - . - , , , .
, .
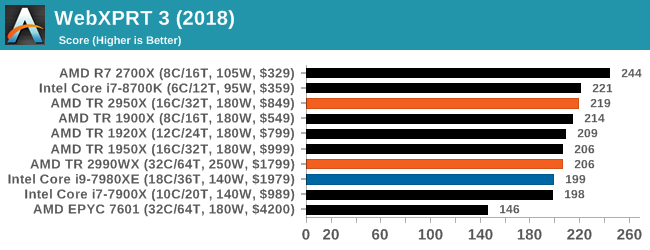
WebXPRT 3: - ,
, XPRT, Principled Technologies, -, , , «3». ( , ) : , , , , HTML5, , .
, . , .
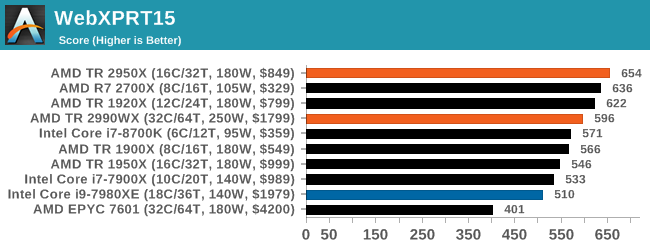
WebXPRT 2015: HTML5 Javascript Web UX
WebXPRT — 2015 , - . - , , - . - . , , , . — , . « » .
WebXPRT3, , . , .
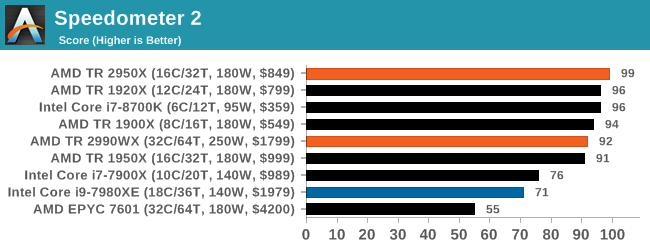
Speedometer 2: Javascript Frameworks
- — Speedometer 2, javascript, : , . , , , -.
«rpm», . .
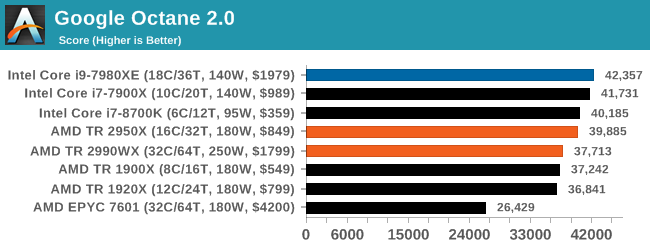
Google Octane 2.0: Core Web Compute
- , — Octane Google. 2.0 , , , , , — .
. .
Mozilla Kraken 1.1: Core Web Compute
, Octane, Kraken, Mozilla. , , . Kraken , .
. , .
3DPM v1: 3DPM v2.1
«» — 3DPM. , , , ( ). , , .
(-O2, -fp: fast): OpenMP . , false sharing . , , .
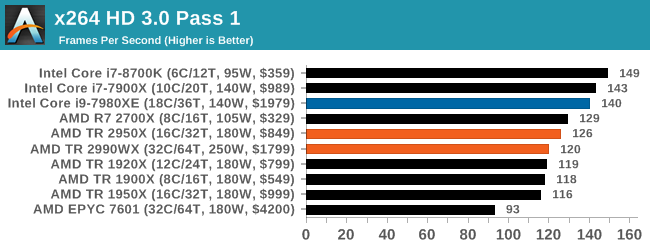
x264 HD 3.0: outdated transcoding test
This transcoding test is very old, it was used by Anandtech in the days of the Pentium 4 and Athlon II processors. In it, standardized 720p video is recoded with double conversion, and the benchmark shows frames per second of each pass. The test is single-threaded, and in some architectures we run into the IPC restriction — instructions-per-clock.
Thank you for staying with us. Do you like our articles? Want to see more interesting materials? Support us by placing an order or recommending to friends, 30% discount for Habr users on a unique analogue of the entry-level servers that we invented for you: The whole truth about VPS (KVM) E5-2650 v4 (6 Cores) 10GB DDR4 240GB SSD 1Gbps from $ 20 or how to share the server? (Options are available with RAID1 and RAID10, up to 24 cores and up to 40GB DDR4).
3 months for free if you pay for new Dell R630 for half a year - 2 x Intel Deca-Core Xeon E5-2630 v4 / 128GB DDR4 / 4x1TB HDD or 2x240GB SSD / 1Gbps 10 TB - from $ 99.33 a month , only until the end of August, order can be here .
Dell R730xd 2 times cheaper? Only we have 2 x Intel Dodeca-Core Xeon E5-2650v4 128GB DDR4 6x480GB SSD 1Gbps 100 TV from $ 249 in the Netherlands and the USA! Read about How to build an infrastructure building. class c using servers Dell R730xd E5-2650 v4 worth 9000 euros for a penny?
Source: https://habr.com/ru/post/421521/
All Articles