Budget debugger for ESP-32 and its configuration
Recently, when writing a library for ESP-32, it became necessary to catch deadlocks, which sometimes arose because of my curvature, which necessitated the purchase of a debugger board with a JTAG interface. What came of it - read under the cut.
Devices and materials
Our main character, or rather the goal of debugging:
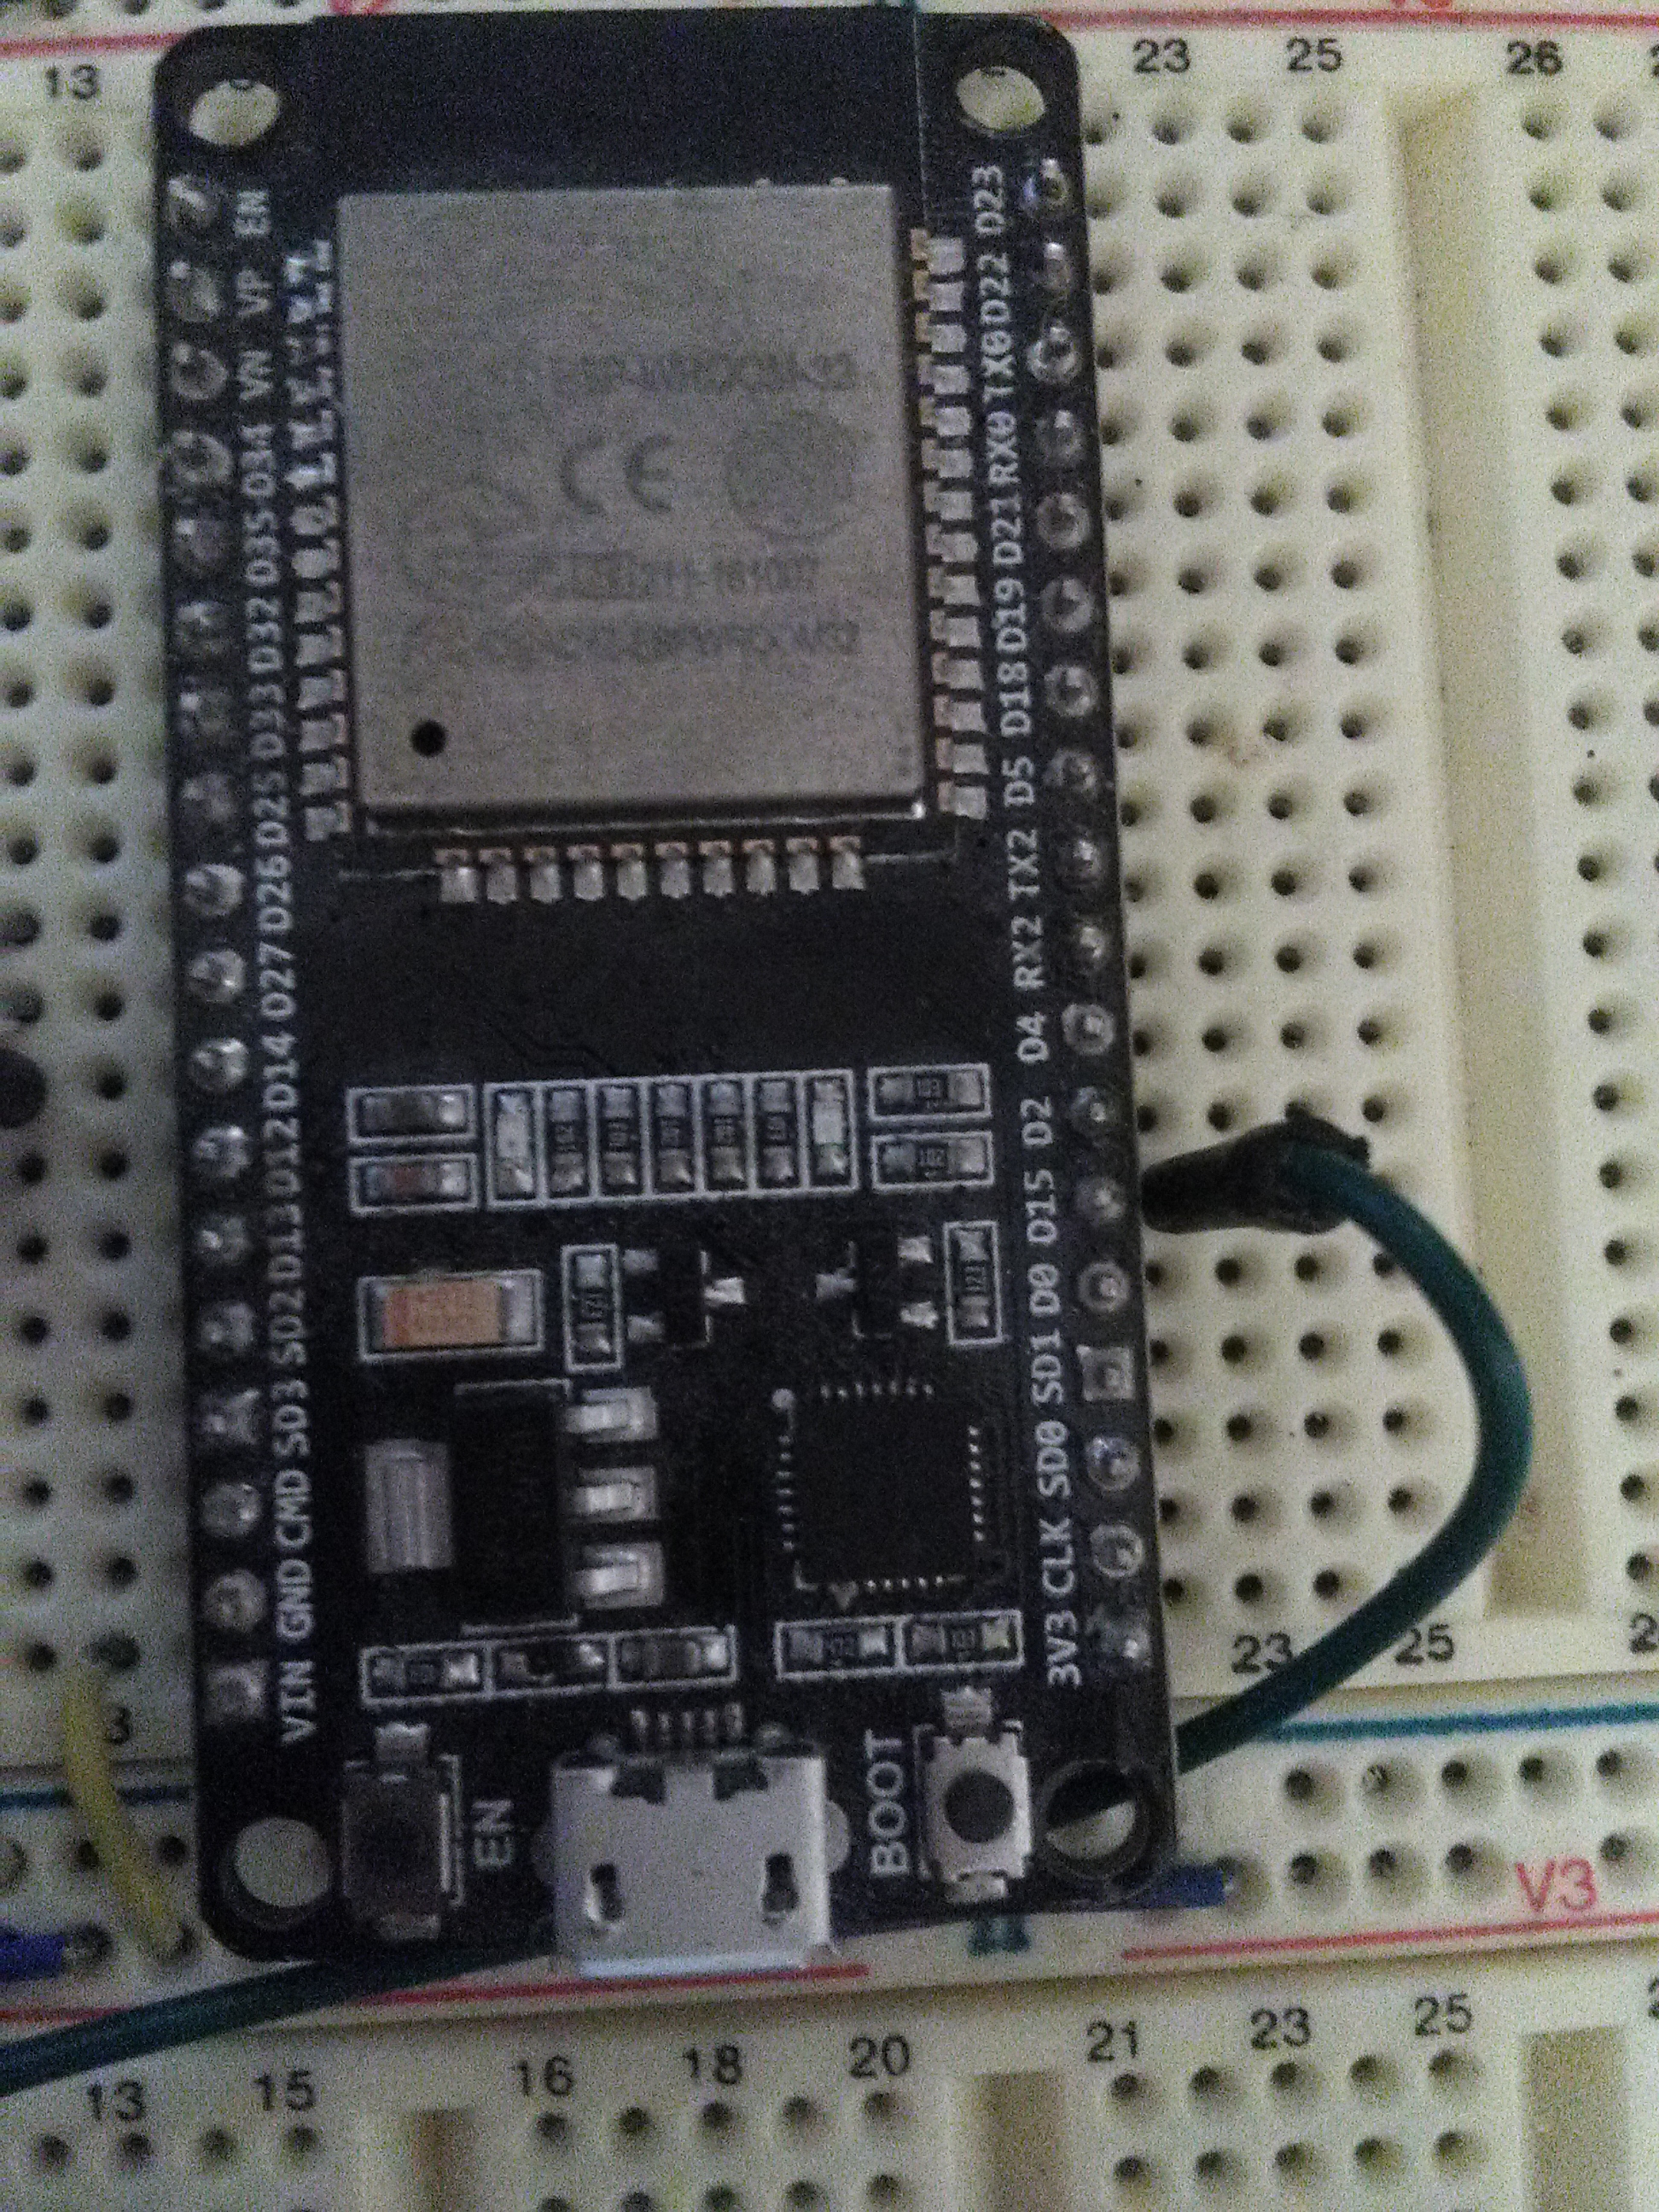
Board based on the ESP-WROOM-32 chip. I will not give the link, because in that place everything has already been bought up.
Now - the debug board itself:
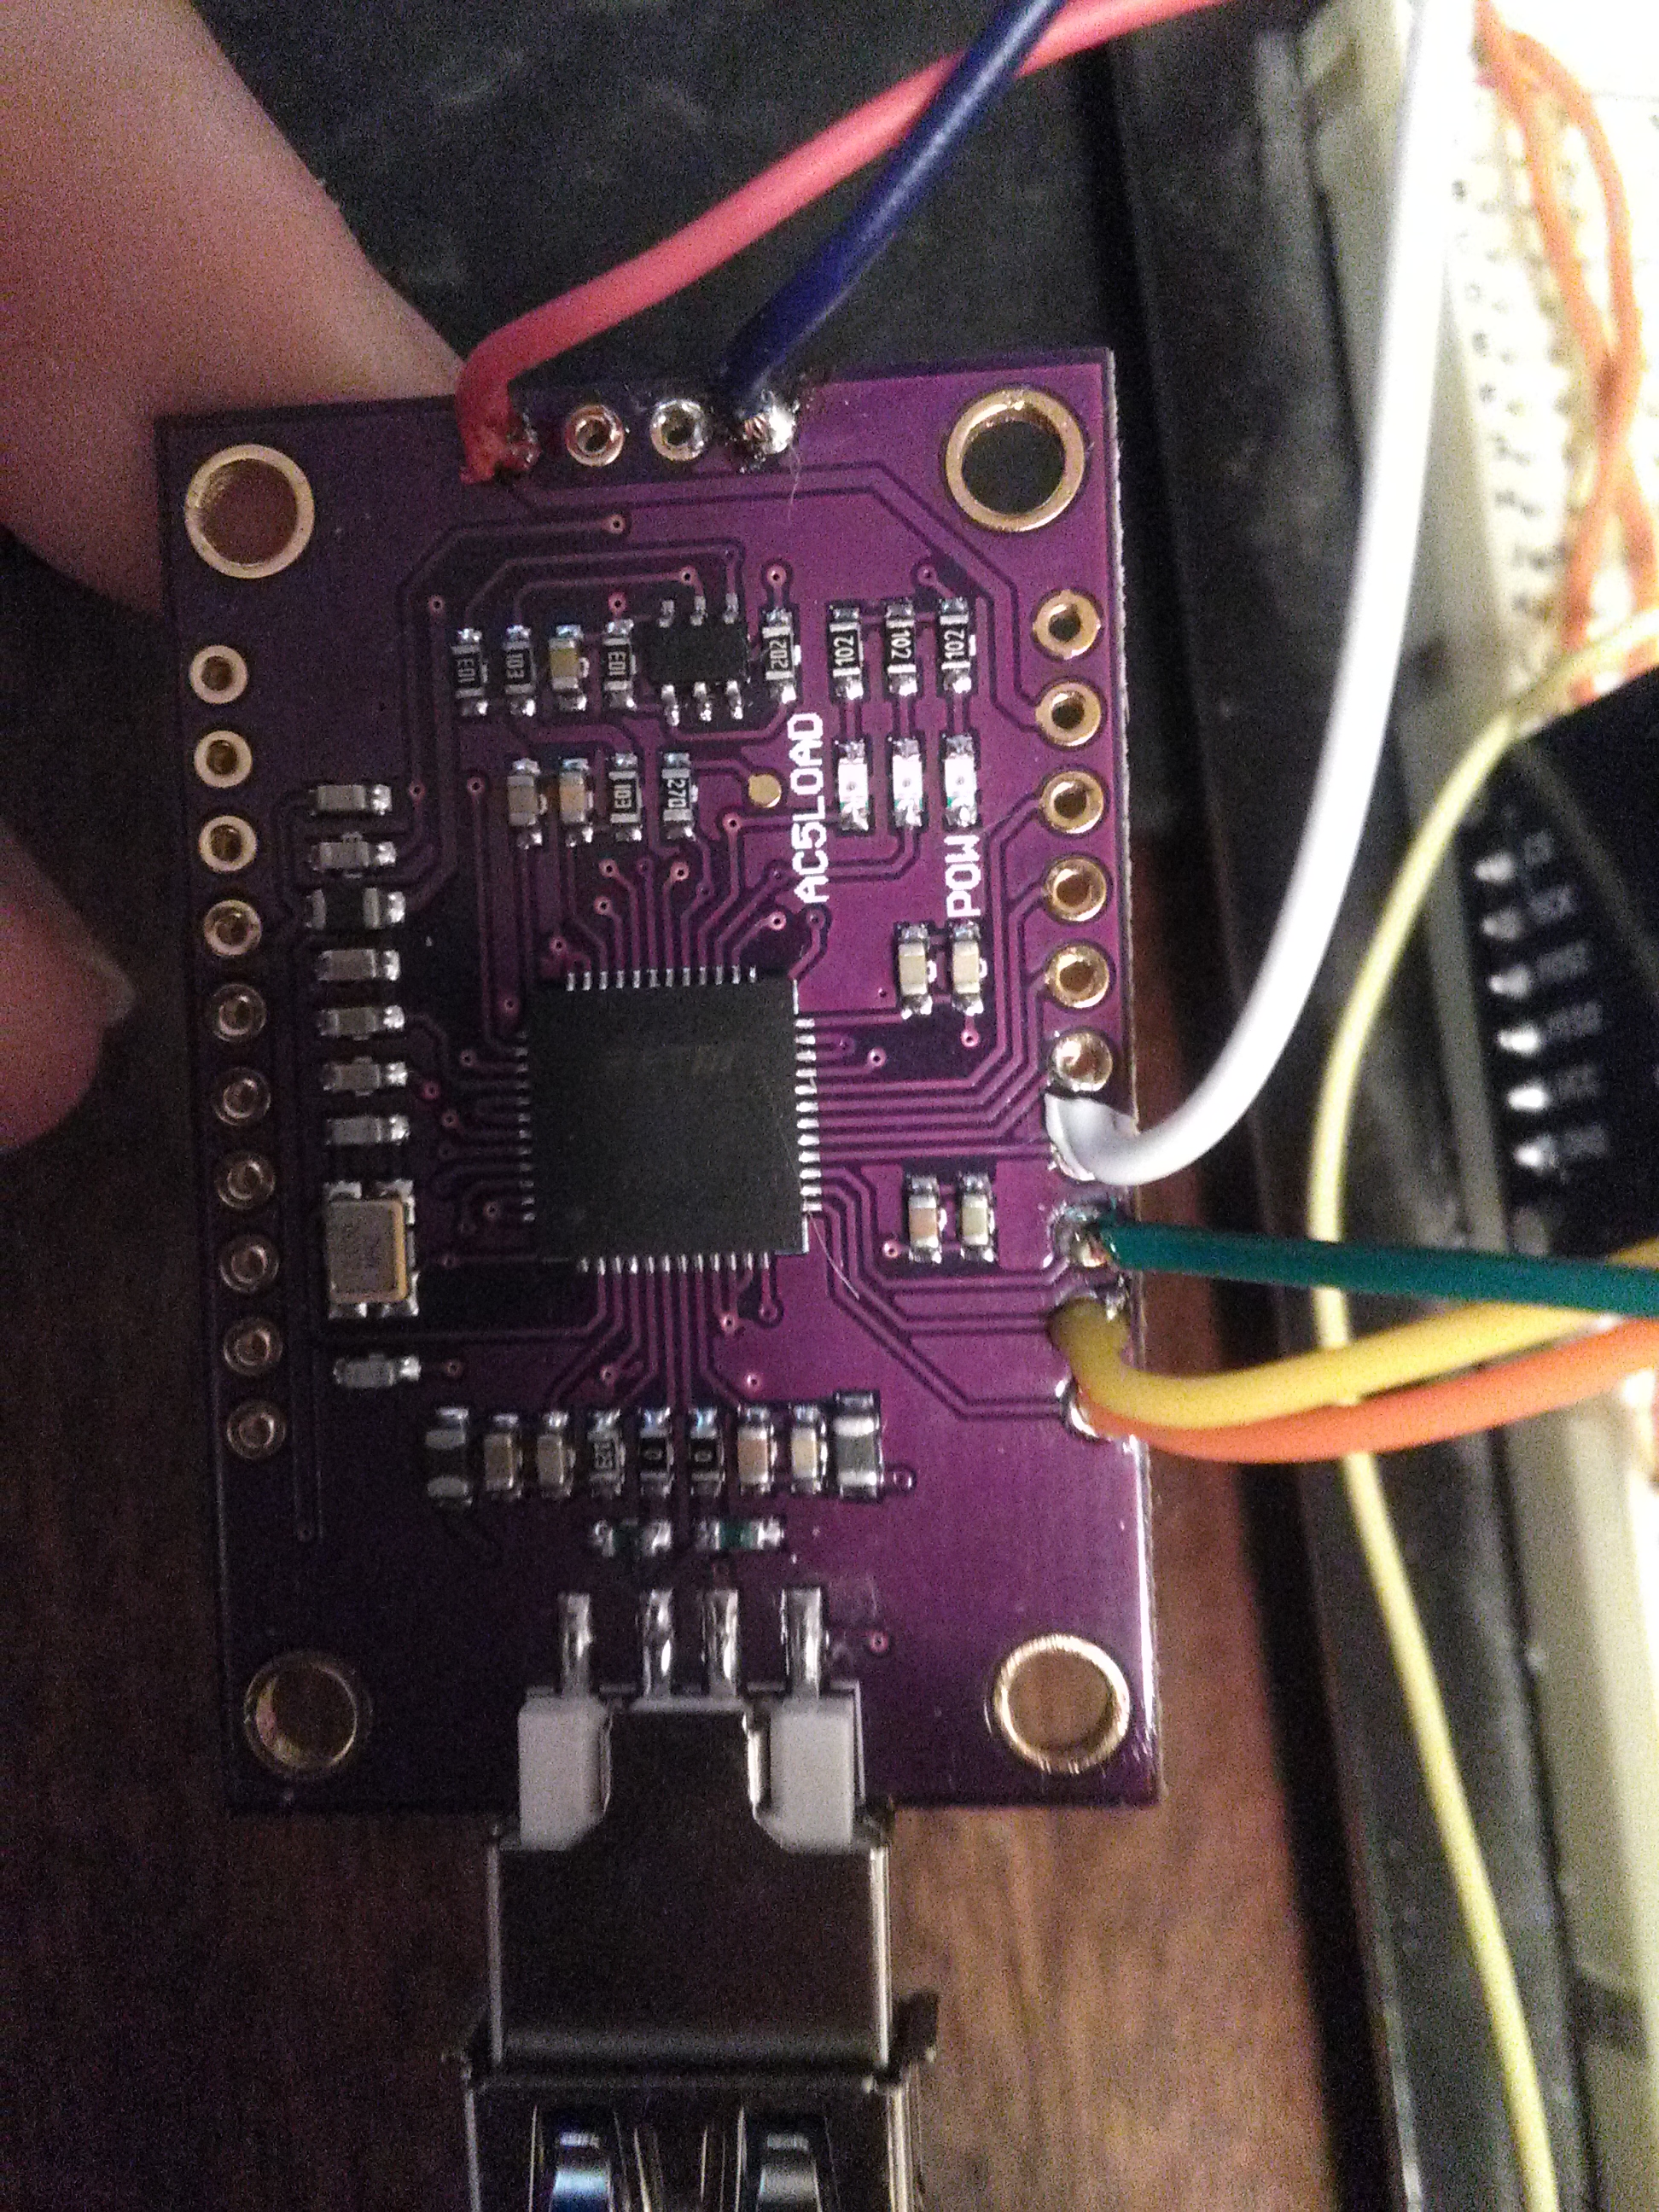

CJMCU FT232H
I did not bother and ordered on aliexpress for 740.08 rubles. together with the delivery of ePacket. The fee comes with non-soldered legs, which we only have to hand, because we do not need them.
A set of wires, 6 pieces: one end to solder, the other to ESP-32.
I also highly recommend the USB extension cable, it will be tight without it ...
Computer with (X) Ubuntu 18.04.
Customization
Installing OpenOCD for ESP-32
Here you can safely refer to the esp-idf docks themselves:
sudo apt-get install make libtool pkg-config autoconf automake texinfo libusb-1.0 libftdi1-2 git git clone --recursive https://github.com/espressif/openocd-esp32.git # https://github.com/espressif/openocd-esp32/releases cd openocd-esp32 ./bootstrap ./configure # , FTDI-based adapters make -j6 sudo make install Separately, I note that I put this version of OpenOCD in the system ( sudo make install ), which is unacceptable when you have different OpenOCD for different devices.
OpenOCD setup for us
At this stage, I divided the config for the debug card and the ESP-32 itself. It turned out like this:
board.cfg:
transport select jtag adapter_khz 20000 # # set ESP32_ONLYCPU 1 # # set ESP32_RTOS none # RTOS source [find target/esp32.cfg] interface.cfg:
interface ftdi ftdi_vid_pid 0x0403 0x6014 ftdi_layout_init 0x0c08 0x0f1b Writing a Udev rule
Due to rights issues, we will not be able to access the USB device. This can be fixed with one line of the udev rule:
echo 'SUBSYSTEM=="usb", ATTR{idVendor}=="0403", ATTR{idProduct}=="6014", GROUP="plugdev, MODE="0666"' | sudo tee /etc/udev/rules.d/99-JTAG.rules sudo systemctl restart udev.service sudo udevadm control --reload-rules Helper script
Among other things, a script like this is very convenient:
openocd_command:
#!/bin/bash echo "$@" | telnet localhost 4444 It allows you to quickly send commands directly to the OpenOCD daemon. But more about that later.
We connect the CJMCU board to the ESP-32
Here we need wires and a soldering iron, without this in any way. Below is a table of what to connect and why.
| Contact CJMCU | JTAG Assignment | Contact ESP-32 |
|---|---|---|
| AD0 | TCK | 13 |
| AD1 | TDI | 12 |
| AD2 | Tdo | 15 |
| AD3 | Tms | 14 |
| + 5V | VIN (read in detail!) | |
| + 3.3V | 3V3 (read in detail!) | |
| GND | GND (suddenly) |
About VIN and 3V3
If you do not want to pull a separate wire from the computer to ESP-32 devkit, then you can connect + 5V to the VIN. The firmware will go through JTAG, which, as personal experience has shown, is much faster. One minus of this option is that it is not possible to watch the UART log, but IMHO debugger completely removes the need for this action.
As noted in the comments, the ESP-32 itself cannot be used for 5V, only on devkits. If you need to debug a separate chip, you can power up the converter from the CJMCU itself by connecting + 3.3V on it to 3V3 on ESP-32. But I can’t say anything about whether the power of the converter is enough. Better take a separate power supply. And yes, it’s not worth connecting 5V and 3.3V at the same time.
At the same time, GND must always be connected!
Checking OpenOCD
Run OpenOCD like this:
openocd -s ' interface.cfg board.cfg' -f interface.cfg -f board.cfg If everything went well, you’ll be shown something like this:
Open On-Chip Debugger 0.10.0-dev (2018-08-22-14:47) Licensed under GNU GPL v2 For bug reports, read http://openocd.org/doc/doxygen/bugs.html adapter speed: 20000 kHz esp32 interrupt mask on Info : ftdi: if you experience problems at higher adapter clocks, try the command "ftdi_tdo_sample_edge falling" Info : clock speed 20000 kHz Info : JTAG tap: esp32.cpu0 tap/device found: 0x120034e5 (mfg: 0x272 (Tensilica), part: 0x2003, ver: 0x1) Info : JTAG tap: esp32.cpu1 tap/device found: 0x120034e5 (mfg: 0x272 (Tensilica), part: 0x2003, ver: 0x1) Info : esp32: Debug controller was reset (pwrstat=0x5F, after clear 0x0F). Info : esp32: Core was reset (pwrstat=0x5F, after clear 0x0F). Info : Detected debug stubs @ 3ffb3134 on core0 of target 'esp32' cpu0: Current bits set: BreakIn BreakOut RunStallIn cpu1: Current bits set: BreakIn BreakOut RunStallIn This suggests that it all worked!
Important : the OpenOCD process should spin as long as you are busy debugging.
Enable Eclipse
There are a number of steps that are beautifully described in the official documentation , and I will not repeat them.
Debugging Tips in Eclipse
Forget about the EN button aki reset on the board. Restart do only through "Terminate and relaunch".
For firmware use
openocd_command 'program_esp32 _/.bin 0x10000 verify'You can add this as an assembly target by placing the
openocd_commandcustom command, and in the "name of the target" field, enter the arguments (without quotes).You may not get what you expected after stopping and resuming. My library to play the sound after this makes no sense of how abnormal jokes with a timer.
This is where my current experience with this system ends. I wish you a fruitful debugging (let's be honest, it does not happen to be pleasant)!
')
Source: https://habr.com/ru/post/421291/
All Articles