About wear SSD on real examples
A year ago, we added a collection of metrics from SMART disk attributes on client servers to our agent. At that moment we did not add them to the interface and show them to customers. The fact is that we do not remove metrics via smartctl, but pull ioctl directly from the code so that this functionality works without installing smartmontools on client servers.
The agent removes not all available attributes, but only the most significant and least vendor-specific ones (otherwise we would have to maintain a database of disks similar to smartmontools).
Now finally got around to checking out what we were taking there. And it was decided to start with the "media wearout indicator" attribute, which shows in percent the remaining SSD recording resource. Under the cut there are several stories in pictures about how this resource is spent in real life on servers.
Are there dead SSDs?
There is an opinion that newer more productive ssds come out more often than the old ones manage to be killed. Therefore, the first thing it was interesting to look at the most dead in terms of the recording resource disk. The minimum value for all ssd of all clients is 1%.
We immediately wrote to the client about it, it turned out to be a hedgehog in Detus. Host support immediately replaced ssd:

It would be very interesting to see what the situation looks like from the operating system's point of view when ssd stops servicing the recording (we are now looking for an opportunity to conduct an intentional mockery of ssd to look at the metrics of this script :)
How fast are SSDs killed?
Since we started collecting metrics a year ago, and we do not delete metrics, there is an opportunity to look at this metric in time. Unfortunately, the server with the highest flow rate is connected to okmeter only 2 months ago.

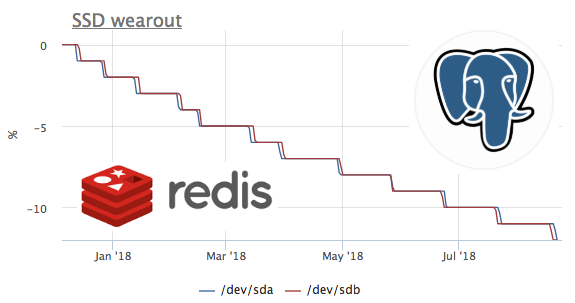
On this graph, we see how, in 2 months, 8% of the recording resource was burned. That is, with the same recording profile, these ssd will be enough for 100 / (8/2) = 25 months. I don’t know much or little, but let's see what kind of load is there?

We see that only ceph works with a disk, but we understand that ceph is only a layer. In this case, the ceph client on several nodes acts as a repository for the kubernetes cluster, let's see what inside k8s generates the most recordings on the disk:

Absolute values do not coincide, most likely due to the fact that ceph works in a cluster and the record from redis is multiplied due to data replication. But the load profile allows you to confidently say that the entry is initiated by redis. Let's see what happens in radish:

here you can see that on average less than 100 requests per second are executed that can change data. Recall that redis has 2 ways to write data to disk :
- RDB - periodic snapshots of the entire database to disk, when redis starts, we read the last dump into memory, and we lose data between the dumps
- AOF - we write a log of all changes, at start redis loses this log and all the data is in memory, we lose only the data between the fsync of this log
As everyone probably guessed, in this case, RDB is used with a frequency of 1 minute dump:

SSD + RAID
According to our observations, there are three main configurations of the disk subsystem of servers with the presence of SSD:
- in server 2 SSD collected in raid-1 and everything lives there
- the server has HDD + raid-10 from ssd, usually used for classic RDBMS (system, WAL and part of the data on the HDD, and on the SSD the hottest in terms of reading data)
- The server has free-standing SSDs (JBOD), typically used for nosql type cassandra
In case ssd are collected in raid-1, the recording goes on both disks, respectively, wear goes at the same speed:
But I came across a server in which the picture is different:

At the same time, only mdraid partitions (all raid-1 arrays) are mounted:

By the metrics of the record, it is also clear that more entries are being sent to / dev / sda:

It turned out that one of the partitions on / dev / sda is used as a swap, and the swap i / o on this server is quite noticeable:

Worn SSD and PostgreSQL
In fact, I wanted to see the ssd wear rate under various write loads in Postgres, but as a rule, they are used very carefully on the loaded ssd bases and the massive recording goes to the HDD. While looking for a suitable case, I came across one very interesting server:

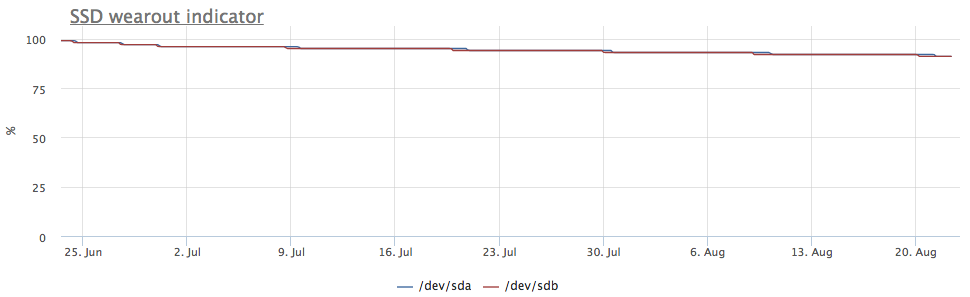
The wear of two ssd in raid-1 for 3 months was 4%, but judging by the speed of the WAL recording, this postgress writes less than 100 Kb / s:
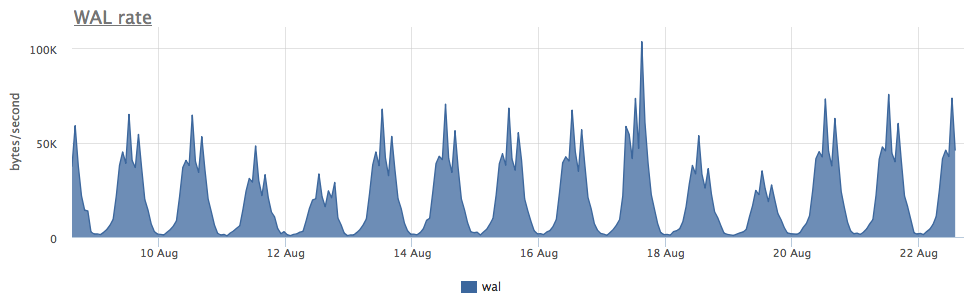
It turned out that postgres is actively using temporary files, working with which creates a constant stream of writing to disk:

Since the postgresql diagnostics are pretty good, we can find out exactly what we need to repair:

As you can see here, this particular SELECT generates a bunch of temporary files. In general, SELECTs sometimes post a record without any temporary files - here we have already talked about it.
Total
- The amount of writing to disk that Redis + RDB creates does not depend on the number of modifications in the database, but on the size of the base + dump interval (and in general, this is the highest level of write amplification in data warehouses I know)
- Actively used swap on ssd is bad, but if you need to bring jitter into ssd wear (for reliability raid-1), then you may pass for the option :)
- In addition to WAL and database datafiles, they can also write all sorts of temporary data to disk.
We at okmeter.io believe that in order to get to the root of the problem, an engineer needs a lot of metrics about all the layers of the infrastructure. We are doing all we can to help :)
')
Source: https://habr.com/ru/post/420937/
All Articles