KDD 2018, third day, main program

Today, finally, the main conference program has begun. Acceptance rate this year was only 8%, i.e. must perform the best of the best of the best. Applied and research flows are clearly separated, plus several separate related activities. Application flows look more interesting, there are reports mainly from major (Google, Amazon, Alibaba, etc.). I will tell about those performances which I managed to attend.
Data for good
The day began with a fairly lengthy speech that the data should be useful and used for good. A professor at the University of California is speaking (it is worth noting that there are a lot of women at KDD, both among students and speakers). All this is expressed in the abbreviation FATES:
- Faireness - no bass in model predictions, everything is gender-neutral and tolerant.
- Acountability - there must be someone or something responsible for the decisions made by the machine.
- Transparency - transparency and explanability of decisions.
- Ethic - when working with data, special emphasis should be placed on ethics and privacy.
- Safety and security - the system must be safe (do not harm) and protected (resistant to manipulative influences from the outside)
This manifesto, unfortunately, rather expresses desire and weakly correlates with reality. A politically correct model will be only if all signs are removed from it; the responsibility to transfer to someone specific is always very difficult; the further the DS develops, the more difficult it is to interpret what happens inside the model; on ethics and privacy, there were some good examples on the first day, but otherwise, the data are often quite arbitrary.
')
Well, it must be admitted that modern models are often not safe (the autopilot can ditch the car with the driver) and are not protected (you can pick up examples that break the work of the neural network without even knowing how the network works). An interesting recent work by DeepExplore : a system for searching for vulnerabilities in neural networks generates, including images, forcing the autopilot to steer in the wrong direction.

The following is yet another definition of Data Science as “DS is the study of extracting value form data”. In principle, quite good. At the beginning of the speech, the speaker made a special reservation that DSs often look at the data only from the moment of analysis, whereas the full life cycle is much wider, and this, in particular, is reflected in the definition.
Well, not without a few examples of laboratory work.
Let us again analyze the problem of assessing the influence of many causes on the result, but not from an advertising point of view, but as a whole. There is still not published article . Consider, for example, the question of which actors to choose for a film in order to collect a good box office. We analyze the acting lists of the highest-grossing films and try to predict the contribution of each of the actors. But! There are so-called confounders , which affect how effective the actor will be (for example, Stallone will do well in a trashy thriller, but not in a romantic comedy). To choose the right, you need to find all the confounders and evaluate them, but we will never be sure that we have found everyone. Actually, the article proposes a new approach - deconfounder. Instead of selecting confounders, we explicitly introduce latent variables and evaluate them in unsupervised mode, and then we learn the model with their account. All this sounds rather strange, because it looks like a simple variant of embeddings, in which the novelty is not clear.
Some more beautiful examples were shown, how AI and so on move to their university.
E-commerce and Profiling
Went to the commerce application section. In the beginning there were some very interesting reports, at the end a certain amount of porridge, but first things first.
New User Modeling and Churn prediction
Snapchat is an interesting work on predicting churn. The guys use the idea, which we also ran in successfully 4 years ago: before predicting the outflow, users should be divided into clusters by type of behavior. At the same time, the vector space for the types of actions they turned out to be quite poor, from just a few types of interactions (we, at one time, had to make a selection of signs, to go from three hundred to one and a half), but they enrich the space with additional statistics and consider it as a time series As a result, clusters are obtained not so much about what users do, as about how often they do it.
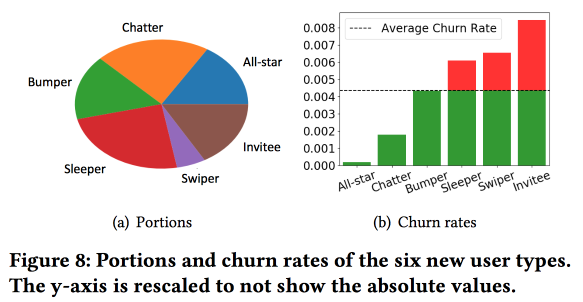
An important observation: the network has a “core” of the most densely connected and active users of 1.7 million people. At the same time, the behavior and retention of the user strongly depends on whether he can contact someone from the “core”.
Then we start building a model. Take newbies for half a month (511 thousand), simple features and ego-networks (size and density), and see if they are associated with the “core”, etc. We will feed the users' behavior to LSTM and obtain the accuracy of the outflow forecast slightly higher than that of logreg (by 7-8%). But then the interesting begins. To take into account the specifics of individual clusters, we will train several LSTM in parallel, and on top we will attach the attention-layer. As a result, such a scheme begins to work on clustering (which of the LSTMs received attention), and on the outflow forecast. Gives another + 5-7% increase in quality, and logreg already looks pale. But! In fact, it would be fair to compare it with a segmented logreg, which was trained separately for clusters (which can be obtained in simpler ways).
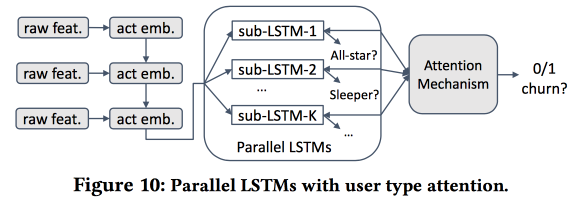
I asked about interpretability: after all, the outflow is often predicted not to get a forecast, but to understand what factors influence it. The speaker was clearly prepared for this question: for this purpose, the selected clusters are used and analyzed, than those of them, where outflow projections are higher, are distinguished from others.
Universal User Representation
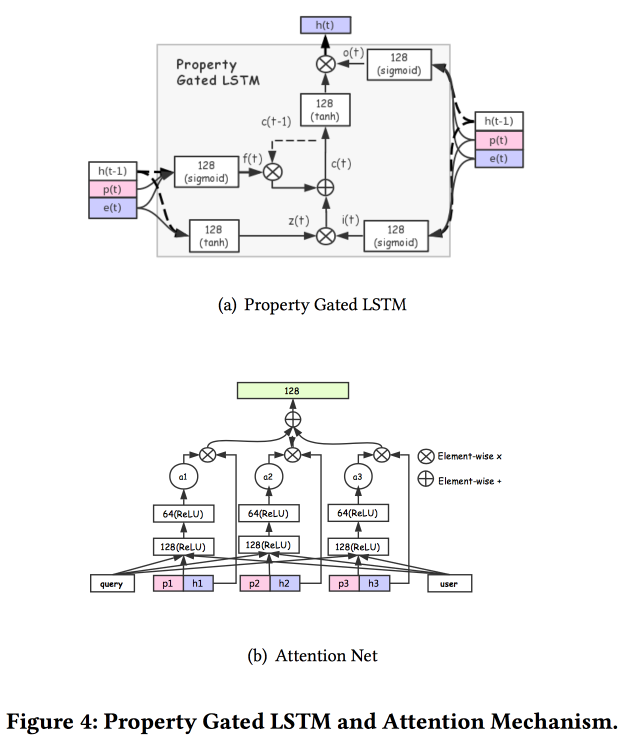
Alibaba guys talk about how to build user embeds. It turns out that having many user views is bad: many are not finalized, forces are wasted. They managed to make a universal idea and show that it works better. Naturally on neural networks. The architecture is fairly standard, already in one form or another has been described more than once at a conference. Facts from user behavior are input, build embedding on them, give it all to LSTM, hang the attention layer on top, and next to it an additional grid of static features, marry multitask (in fact, several small grids for a specific task) . We teach all this together, exit with attention and will be the embedding of the user.
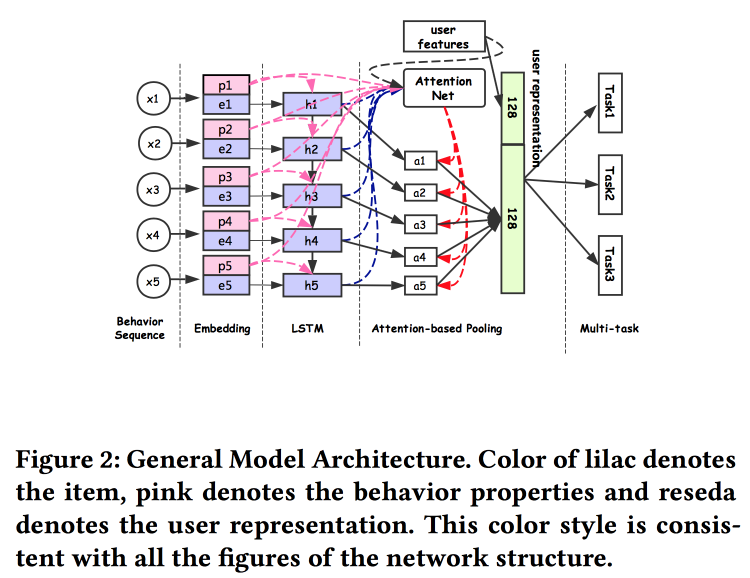
There are several more complex additions: in addition to simple attention, they add “in-depth” attention net, and also use a modified version of LSTM - property gated LSTM
The tasks that run it all on are: CTR prediction, price preference prediction, prediction prediction, learning to rank, fashion, prediction, shop prediction. Dataset for 10 days includes 6 * 10 9 examples for training.
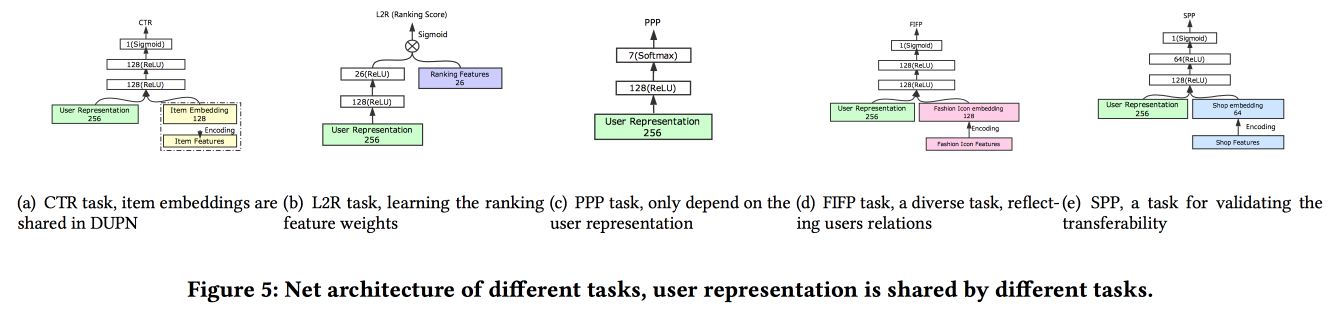
Next was an unexpected one: they train all this on TensorFlow, on a CPU cluster of 2,000 machines with 15 cores, it takes 4 days to fill up the data for 10 days. Therefore, further training is provided day after day (10 hours on this cluster). I didn’t have time to ask about GPU / FPGA :(. Adding a new task is done either through full retraining, or through additional training of a shallow mesh (netwrok fine tuning). specific tasks. A / B test showed an increase of 2-3% in various indicators.
E-Tail product return prediction
Predict the return of goods by the user after purchase, the work presents IBM. Unfortunately, while in open access there is no text. Returning goods is a serious problem costing $ 200 billion a year. To build a return forecast, use a model of a hypergraph linking products and baskets, try to find the closest hypergraph in this basket, and then estimate the likelihood of return. To prevent the return of the online store there are many opportunities, for example, to offer a discount for removing certain items from the cart.
Immediately noted that there is a significant difference between the baskets with duplicates (for example, two identical T-shirts of different sizes) and without, therefore, we must immediately build different models for these two cases.
The general algorithm is called HyperGo:
- We build a hypergraph to represent purchases and returns with information from the user, product, basket.
- Next, use local graph cut based on random walk to get local information for the forecast.
- Separately, we consider baskets with doubles and no doubles.
- We use Bayesian methods to assess the impact of a single product in the basket.
Compare the quality of the forecast return with kNN on baskets, weighted by Jacquard kNN, rationing the number of duplicates, we get an increase in the result. There was a link to GitHub on the slides, but it was not possible to find their sources, and there is no link in the article.
OpenTag: Open Attribute Value Extraction from Product Profiles
Quite an interesting job from Amazon. Challenge: Set different facts for Alexa to make her answer questions better. They say how complicated everything is, old systems do not know how to work with new words, often require a large number of handwritten rules and heuristics, and the results are so-so. Solving all the problems will help, of course, the neural grids with the embednig-LSTM-attention architecture that has already become familiar, but we will make the LSTM double, and on top of it will throw a Conditional Random Field .

We will solve the problem of tagging a sequence of words. Tags will show where we begin and end the sequence of certain attributes (for example, the taste and composition of dog food), and LSTM will try to predict them. As a bun and a curtsey in the direction of Mechanical Turk, active model training is used. To select the examples that need to be sent to the additional markup, heuristics are used “to take those examples where the tags are most often intersected between eras”.
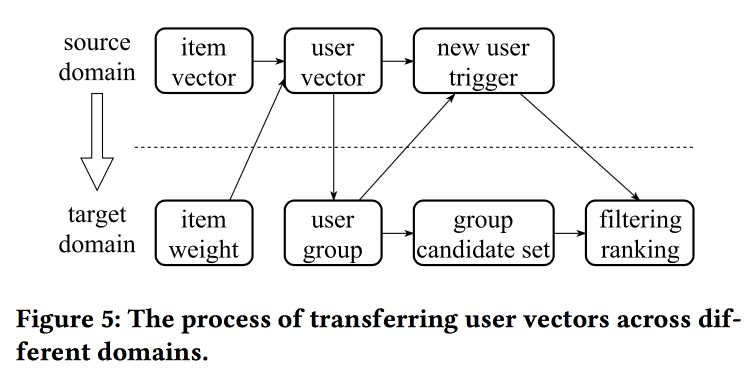
Learning and Transferring IDs Representation in E-commerce
In their work, colleagues from Alibaba again return to the issue of building embeddings, this time looking not just at users, but at the ED in principle: for products, brands, categories, users, etc. Interaction sessions are used as a source of data, and additional attributes are taken into account. Skipgrams are used as the main algorithm.
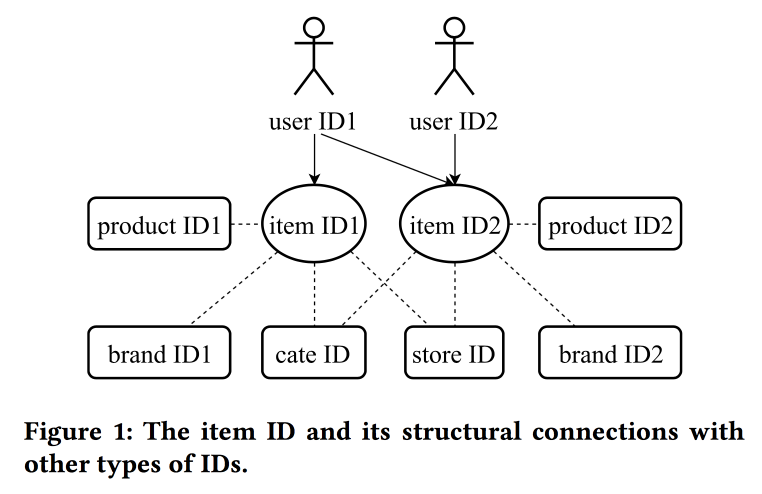
The speaker has a very difficult pronunciation with a strong Chinese accent. Understanding what is happening is almost not realistic. One of the “tweaks” of the work is in the mechanics of transferring views with a lack of information, for example, from item to user through averaging (quickly, you don’t need to learn the whole model). With old items, you can initialize new ones (apparently, by content similarity), as well as transfer the user's view from one domain (electronics) to another (clothing).
In general, it is not entirely clear where the novelty is here, apparently, it is necessary to dig into the details; in addition, it is not clear how this relates to the previous story about unified user views.
Online Parameter Selection for Web-based Ranking Problems
Very interesting work from comrades from LinkedIn. The essence of the work is to choose online the optimal parameters of the algorithm, taking into account several competing goals. Consider the tape as an application area and try to increase the number of sessions of some types:
- A session with some viral action (VA).
- Session with sending resume (JA).
- Session with interaction with content in the tape (EFS).
The ranking function in the algorithm is a weighted average of the predicted conversion to these three goals. Actually, weights are those parameters that we will try to optimize online. Initially, they formulate a business problem as “maximize the number of viral sessions while maintaining the other two types not below a certain level”, but then transform it a bit for ease of optimization.
We model the data with a set of binomial distributions (whether the user converts to the desired target or not, seeing a tape with certain parameters), where the probability of success for the given parameters is the Gaussian process (its own for each type of conversion). Next we use the Thompson semper with “infinite- handed ” gangsters to select the optimal parameters (not online, but offline on historical data, therefore for a long time). They give a few tips: use bold points to build the initial grid and be sure to add epsilon-greedy -sampling (with a chance to epsilon try a random point in space), otherwise you can overlook the global maximum.
Simulate sampling offline once an hour (you need a lot of samples), the result is a certain distribution of optimal parameters. Further, when a user comes in from this distribution, they take specific parameters for tape building (it is important to do this consistently with the seed from the user ID for initialization so that the user's tape does not change radically).
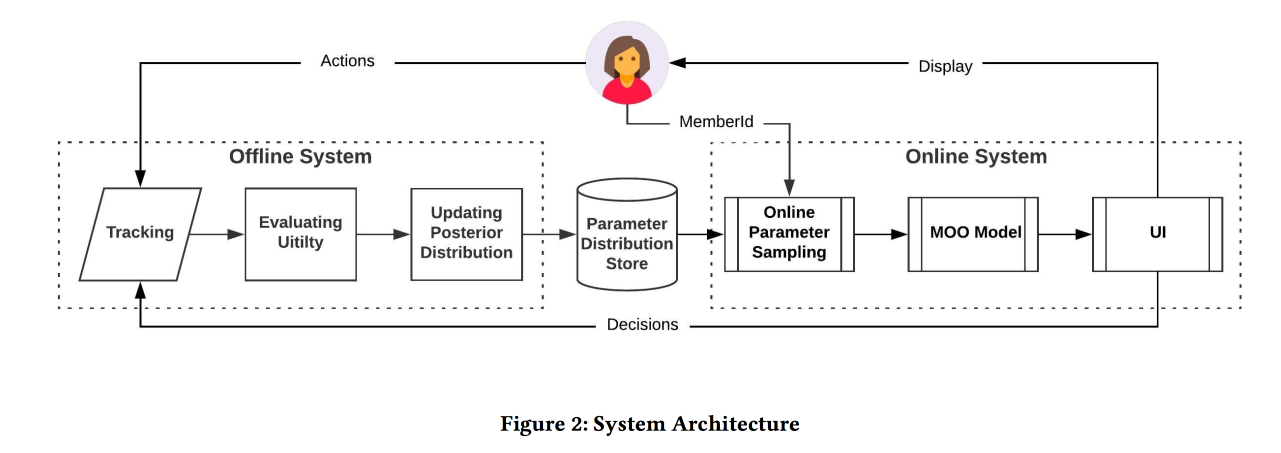
According to the results of the A / B experiment, we received an increase in sending resumes by 12% and likes by 3%. Share some observations:
- It is easier to make sampling easier than trying to add more information to the model (for example, about the day of the week / hour).
- We assume in this approach independence of goals, but it is not clear whether it is (or rather, no). However, the approach works.
- Business must set goals and thresholds.
- It is important to exclude a person from the process and let him do something useful.
Near Real-time Optimization of Activity based notification
Another job from LinkedIn, this time about managing notifications. We have people, events, delivery channels and long-term goals to increase user engagement without a significant negative in the form of complaints and formal replies from push. The task is important and difficult, and you have to do everything correctly: the right people in the right time to send the right content through the right channel and in the right amount.
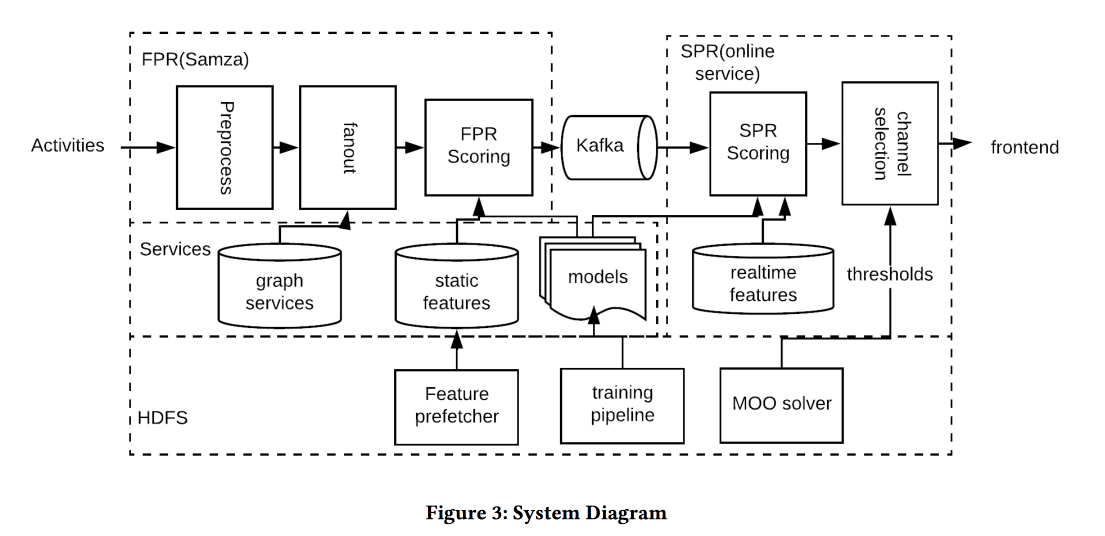
The system architecture in the picture above, the essence of what is happening is approximately as follows:
- We filter every spam at the entrance.
- The right people: the helmet to everyone who is strongly connected with the author / content, balancing the threshold for the strength of communication, manage the coverage and relevance.
- The right time: immediately send content for which time is important (events of friends), the rest can be held for less dynamic channels.
- Proper content: use logreg! Build a prediction model of a click on a bunch of signs, separately for the case when a person is in the application and when there is not.
- The correct channel: we set different thresholds for relevance, the most strict for pushing, lower - if the user is now in the application, even lower - for the mail (there are all sorts of digests / advertisements in it).
- The correct volume: the circumcision model by volume is at the exit, it also looks at relevance, it is recommended to do it individually (good threshold heuristics - minimum score of sent objects for the last few days)
On the A / B-test received a few percent increase in the number of sessions.
Real-time Personalization using Embeddings for Search Ranking at Airbnb
And this was the best application paper from AirBnB. Task: to optimize the issuance of similar placements and search results. We decide through the construction of embeddings of placements and users in the same space in order to further evaluate the similarity. It is important to remember that there is a long-term history (user preferences) and a short-term (current user / session content).
Without further ado, we use word2vec for embedding of places on click sequences in search sessions (one session - one document). But some modifications still do (KDD, as in any way):
- We take the session, during which there was a reservation.
- What is ultimately booked is kept as a global context for all session elements during a w2v update.
- Negatives in training are sampled in the same city.

The effectiveness of this model is checked in three standard ways:
- Check in offline: how quickly we can raise the right hotel up in the search session.
- Check with assessors: built a special tool for visualizing similar ones.
- A / B-test: spoiler, CTR has grown significantly, bookings have not increased, but now they happen before
We try to rank the results of search results not only ahead of time, but also to re-arrange (therefore real-time) when a response is received - a click on one sentence and ignore the other. The approach is to collect the clicked and ignored places in two groups, to find in each centroid of embeddings (there is a special formula), and then in the ranking we raise similar to clicks, omit similar to skips.
On the A / B-test, we got an increase in bookings, the approach stood the test of time: it was invented a year and a half ago and is still spinning in production.
And if you need to look in another city? By clicks, it is not possible to arrange in advance; there is no information about the attitude of users to places in this locality. To circumvent this problem, we introduce “content embeddings”. At first we will get a simple discrete space of signs (cheap / expensive, in the center / on the outskirts, etc.) of the order of about 500 thousand types (for both places and people). Next we build embeddings by type. When training, do not forget to add a clear negative refusal (when the landlord has not confirmed the reservation).
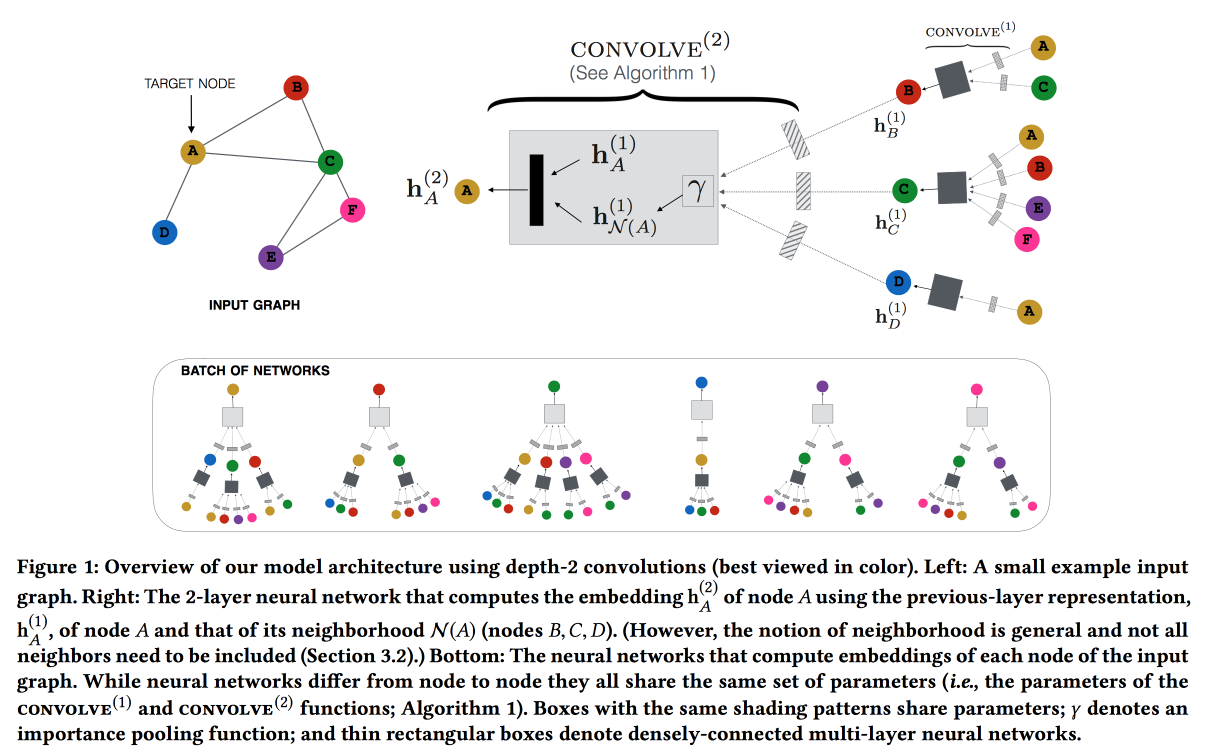
Graph Convolution Neural Networks for Web-Scale Recommender Systems
Work from Pinterest on pin recommendations. Consider the bipartite graph of user pins and add network features to the recommendations. The graph is very large - 3 billion pins, 16 billion interactions, it was not possible to get the classic graph embeddings. As a result, starting from the GraphSAGE system, which builds embeddings according to the local structure (we look at the embeddings of our neighbors and update our own, we update our neighbors according to the message passing model), build PinSAGE . After embeddings are built, it is recommended through the search for the nearest neighbors in the embedding space.
Further "bloody details" begin:
- It is advised to use max margin loss.
- Training goes together on a CPU / GPU: The CPU samples a packet of subgraphs of the same structure (so that the GPU can effectively pair in parallel) and sends the GPU. He does not wait for the answer, immediately begins to prepare the next package.
- For vertices, with a high degree, not all neighbors are taken, but random walk is sampled.
- They use the Curriculum Learning approach: they are gradually adding more and more hard negative examples. on which the model in past epochs was often mistaken.
- On top of Map reduce, apply a trained convolution and get embeddings for all vertices.
As a result, they clearly showed that the scheme works better than visual similarity, according to annotations and the current collaboration. Implemented, proved to be good on the A / B-test.
Q & R: A Two-Stage Approach Toward Interactive Recommendation
“And what will happen if we give the opportunity to the referee to ask the user what he wants?” - this was the question the guys from YouTube asked in their work . Questions considered only one format: “on what topic would you like to watch the video?”. and used the result to optimize “onboarding” (there is, it turns out, a place in YouTube where you can set your own interests).
Now YouTube recommendations are built using Video-RNN, which predicts video ID. The guys decided to take the same architecture, but predict the ID of a certain topic, and also add information about the topic over the old grid (post fusion). Below is the result (finally somewhere used GRU , and then all LSTM and LSTM).

We train this happiness on 7 days of data, we test on the 8th, we take users with enough views. Interestingly, theme prediction works 8% better than multi-class classification by bug-of-word sequence. In the A / B test, interleaving is + 0.7% to the viewing time on the main page, +1.23% from opening notifications.
After that, they switched to onboarding: when using a personalized collection, the user fills the onboarding 18% more often, which ultimately results in a +4% increase in viewing time.
Graph and social nets
After lunch, I decided to listen to research presentations, since the topic, as they say, is close to heart.
Graph Classification using Structural Attention
Quite an interesting work on the classification of graphs, focused on "large size" graphs. As examples, mainly looked at different molecules, such as drugs. Earlier in this area, graphlists were used, but on large graphs it’s difficult, so we will train the grid.
In essence, we do LSTM by the sequence of walks along the graph, but we add a kind of attention-layer, which, by the type of the current vertex, gives the probabilities to which types of vertices we need to move further. This layer focuses our wandering in the right direction. As a type I considered a chemical element, on the sidelines I threw an idea to the author to move from vertex types to some simple embeddings, and said that he would try.
The network is being trained on the RL model: we give it a wander along the graph for a limited number of steps, if after this the classification has failed, we give a penalty. In addition to attention, leading the walk, on top of LSTM is added self-attention, which looks at the whole history of the walk (already familiar scheme). When crossing, we get several “agents” who will take walks and aggregate their answers.
Tested on data on the structure of drugs, compared only with simple baseline with motivation - we do not see the entire graph. Walking does not always work, they want to try TreeLSTM .
SpotLight: Detecting Anomalies in Streaming Graphs
The authors are trying to find anomalies in the interaction graphs, for example, spam ringing, port scanning, switch fallout. Anomaly is defined as "the sudden appearance or disappearance of a large dense subgraph." The task is complicated by the fact that anomalies must be determined on a continuous basis, having limited memory and time.
The basic idea is to use "hashing" graphs in a certain metric space and comparing the sequence of snapshots of hashes. If at some point the snapshot jumps somewhere far, then we have an anomaly.
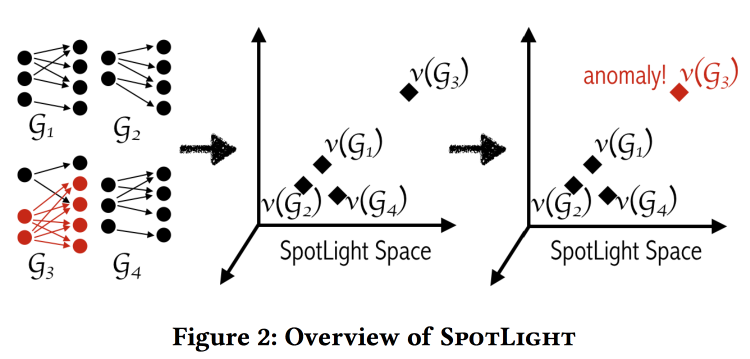
The hashing algorithm impresses with its simplicity: take two random regions of the graph and calculate how many connections there are between them. The result will be one hash dimension. Repeat the procedure for the remaining dimensions. To calculate the hash it is not necessary to see the entire graph, the hash can be counted on the flow of events on adding / deleting links.
Despite the seemingly naive, the authors provide some theoretical guarantees on the separability of situations with and without anomalies. Tested on labeled DARPA dataset . It seems to work well, while in comparison with the baselines, they miss different types of attacks (i.e. there is a potential for an ensemble).
Adversarial Attacks on Graph Networks
And now the best research work . Adversary is very popular on the Internet, especially in the recommendations, search, etc .: attackers are trying to raise their website / content higher. Nowadays, networks working with graphs are becoming increasingly common in the industry - are they resistant to attacks (spoiler is not)? As an example, consider the task of restoring a class of nodes of a graph with incomplete markup.
In principle, an attacker has many possibilities:
- Change attributes on "your" node.
- Change the connection of "his" node.
- Try to "throw" the connection to another node.
- The attack can be directed not only at the process of crossing, but also at the process of learning (poisoning).
They offer two approaches to cracking. With open information about the network that needs to be hacked, they are doing a counter network, when closed, they use a genetic algorithm. . .
, unnoticeability: , ?
Multi-Round Influence maximization
. , , .
, ( , ).
-- :
- : , .
- : , .
- - : inffluencer- . , .
Reverse-Reachable sets: inffluencer-, , .
EvoGraph: An Effective and Efficient Graph Upscaling Method for Preserving Graph Properties
. , , .
, , power law. , , «» , : «» .

, , . .
data science . . , . .
All models are wrong, but some are useful — data science, , , . «» ( , , adversarial ..)
www.embo.org/news/articles/2015/the-numbers-speak-for-themselves — (overfitting, selection bias, , ..)
1762 The Equitable Life Assurance Society , .
: 2011- , ( — «», ). UK:
- , .
- , .
- : .
- «» , .
- , , .
- .
« ».
. F — Fairness, . ML ( ) , «» .
Source: https://habr.com/ru/post/420885/
All Articles