Zabbix on steroids: how the Sbertech single monitoring platform is arranged
Hi, Habr! My name is Sergey Prutskikh, I lead the monitoring direction of Sberbank-Technologies. The main task of our organization is the development and testing of software products for Sberbank. To do this, the company focuses on a large IT infrastructure - 15,000 servers are divided into approximately 1,500 test environments, which belong to more than 500 automated systems. In total, about 10 thousand specialists work with them.
In 2015, we began to create a centralized monitoring service. And everything was limited not only implementation. It was necessary to work out a lot of regulations, instructions, as well as the relationship between the units of Sbertech within the framework of monitoring. In this post I will tell you in detail how we chose the platform, what principles everything was created for and what we did in the end.

Here are the goals we pursued in the project:
')
Looking ahead, I can say that all the goals in one degree or another have already been fulfilled by now. And some related problems monitoring also helped to solve.
In addition to the goals, we formulated the principles, the ideology that was followed during the whole project:
Practically in all projects where I participated, sooner or later a table appeared with a comparison of the functionality of various systems, in which a particular system was given an obvious advantage.
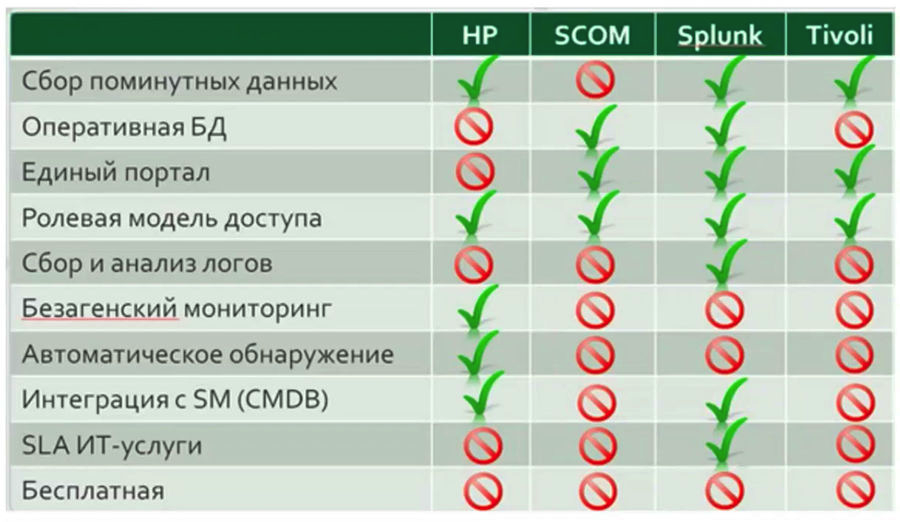
In my opinion, such a comparative analysis cannot be done before starting to work directly with the monitoring service, and even more so it is not necessary to make a decision on the choice of a particular decision based on this analysis. Until the system in your company runs for at least a short period of time, it is not possible to unambiguously judge which particular functions exactly in your company will be in demand. Such tables can be a great help if you for some reason want to change the monitoring system.
You can talk a lot about how to compare the size of several installations of monitoring systems, but all the characteristics selected for this are, in my opinion, quite subjective. In order for you to have a more accurate idea of the size of our installation, I decided to give examples of similar services in other companies, which Zabbix representatives told at the Highload conference.
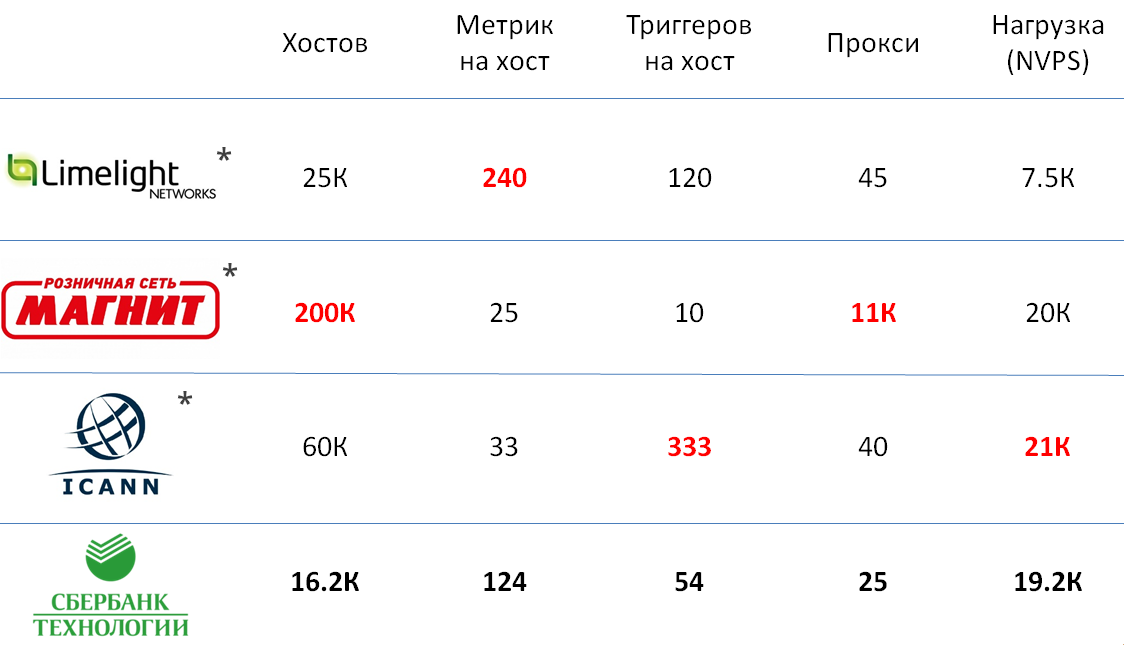
As you can see, the Zabbix instance in Sbertech is not much inferior to the largest installations, and in terms of total load it is level with them.
In the second half of 2017, we conducted a Zabbix pilot to monitor the PROM infrastructure. Then we formulated a number of qualitative criteria, which we refer to the absolute advantages of Zabbix:
For the sake of justice, I cannot fail to mention the major, in my opinion, flaws of Zabbix. Of these, you can also make a decent list:
Now a few words about the quantitative indicators and the architecture of our system.
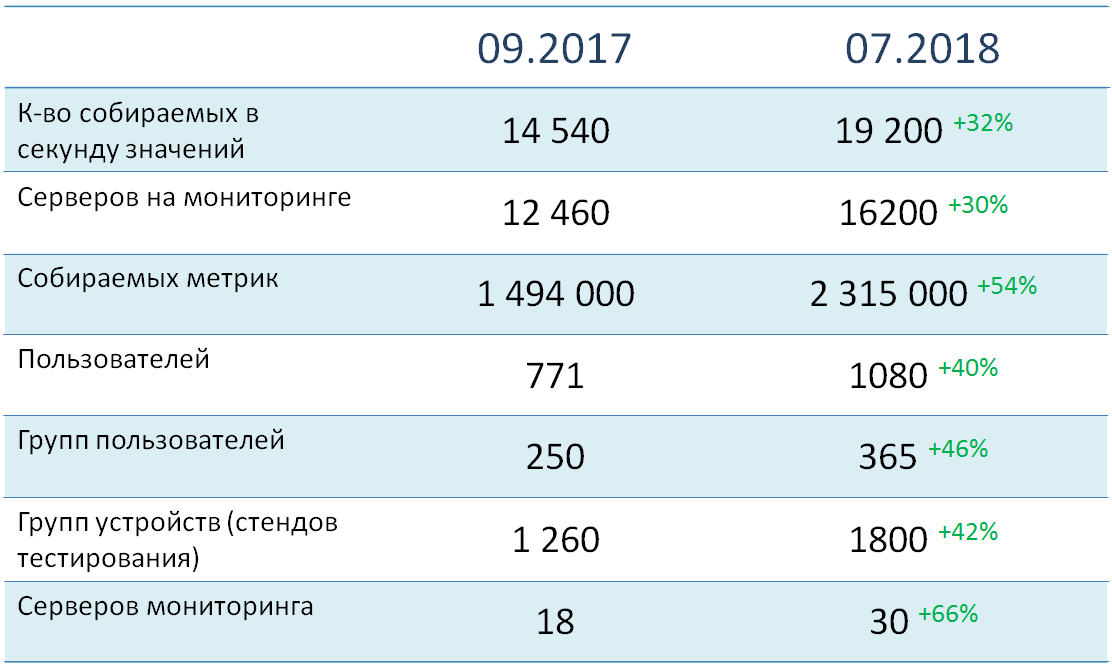
Currently, more than 16 thousand objects (mainly servers) are being monitored, from which almost two and a half million metrics are collected. Their total system load is about 19 thousand values per second. All monitoring objects are distributed over more than 1800 groups of devices, the vast majority of which correspond to specific test environments. At the moment, more than 1000 users are registered in the system, which are divided into 365 functional groups.
As you can see, we pay quite a lot of attention to the distribution of devices and users into groups. This allows you to significantly increase the accuracy of alerts from our service.
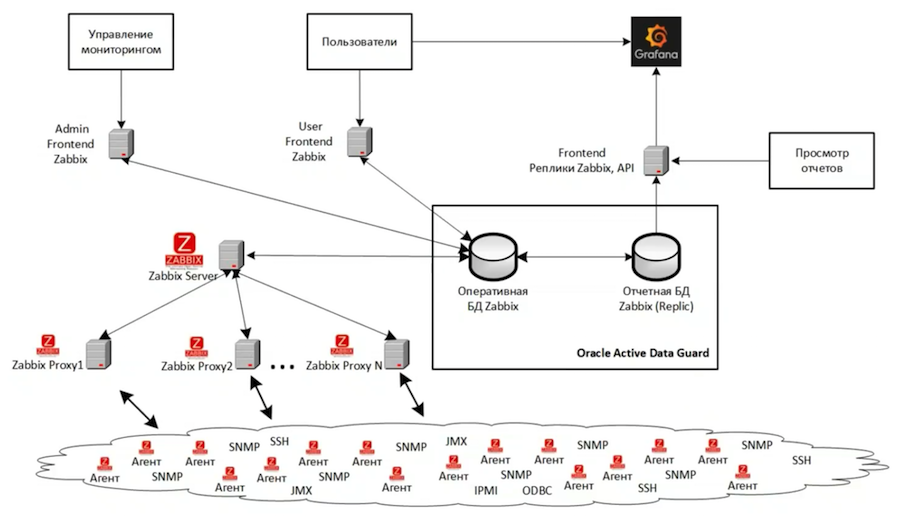
In total, we have three Zabbix instances. The diagram shows the architecture of the largest of them, which monitors the main IT infrastructure for development and testing. Another instance is monitoring the monitoring infrastructure. And the third instance is used for the development and testing of new monitoring tools. The entire structure of the main instance is virtualized on the basis of VMWare. In general, if possible, it is better not to use any virtualization system, because it is more difficult to search and solve performance problems in the case of a virtual infrastructure.
The backend is based on Oracle Active Data Guard and consists of two databases - the main one and the replica. We have three frontends:
In this story, I decided not to focus on the basic functionality that is implemented in almost any monitoring - fixing accidents, collecting information about the performance or availability of IT systems. Focus on the distinctive features of our service.
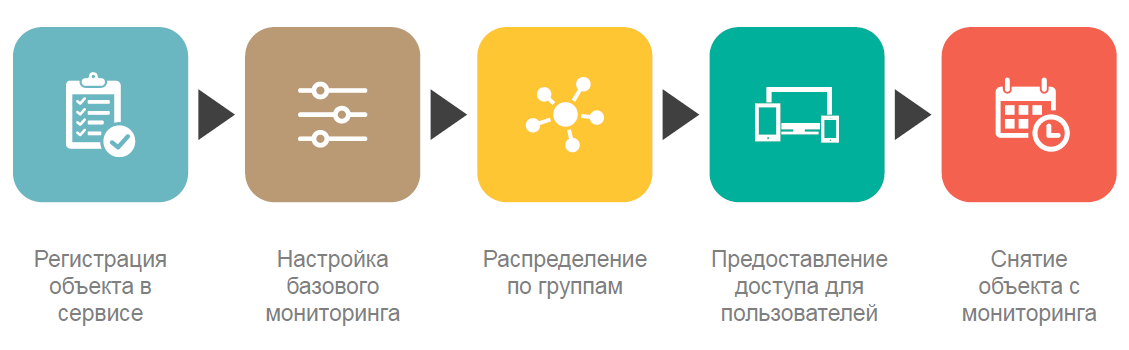
These features primarily include a high degree of automation of typical tasks. We practically do not spend time setting up servers for monitoring, providing access to monitoring results, but focus mainly on developing the service and adding new non-standard features to it. This is greatly helped by more than 200 automation scripts developed since the introduction of the monitoring service into trial operation.
But before you register an agent in Zabbix, you still need to install it. As I wrote above, one of the shortcomings of Zabbix I see is the lack of tools for managing monitoring agents. Therefore, for the installation of agents, we have organized a separate job within our DevOps processes. The figure below shows the installation of the agent.
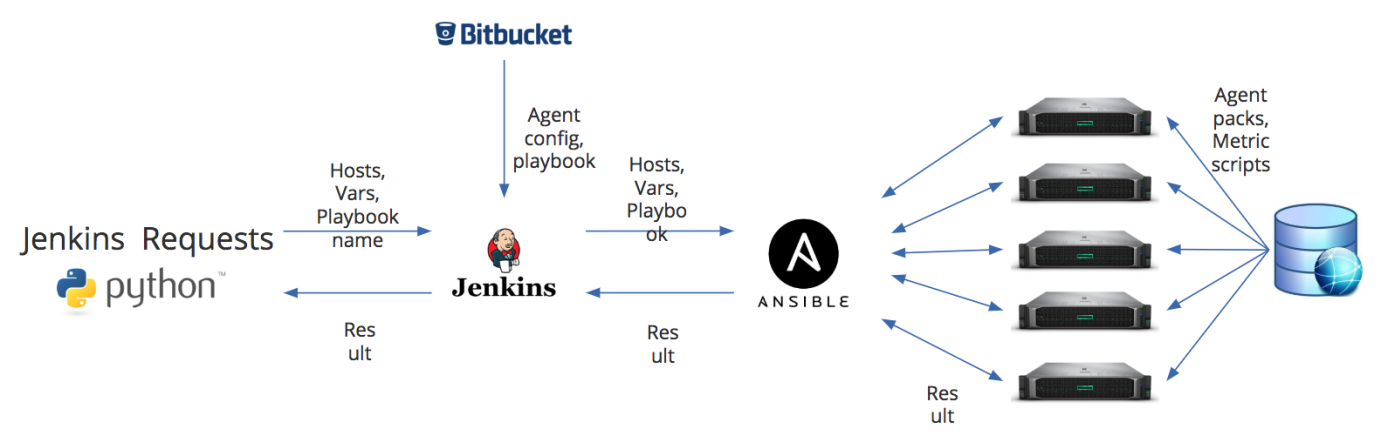
We have two main entry points. This is either a Python script — it sends, through the REST API, the job Jenkins information about the hosts to which you need to install or update the agent, a list of additional variables, and the name of the playbook that you want to run on Ansible. Or default data can go from Bitbucket. But in Jenkins they can be completely replaced according to the variables that we passed. And it helps us, for example, to update agents that are monitored by different proxy servers. The peculiarity of our process is that the Zabbix agent config is formed almost on the fly.
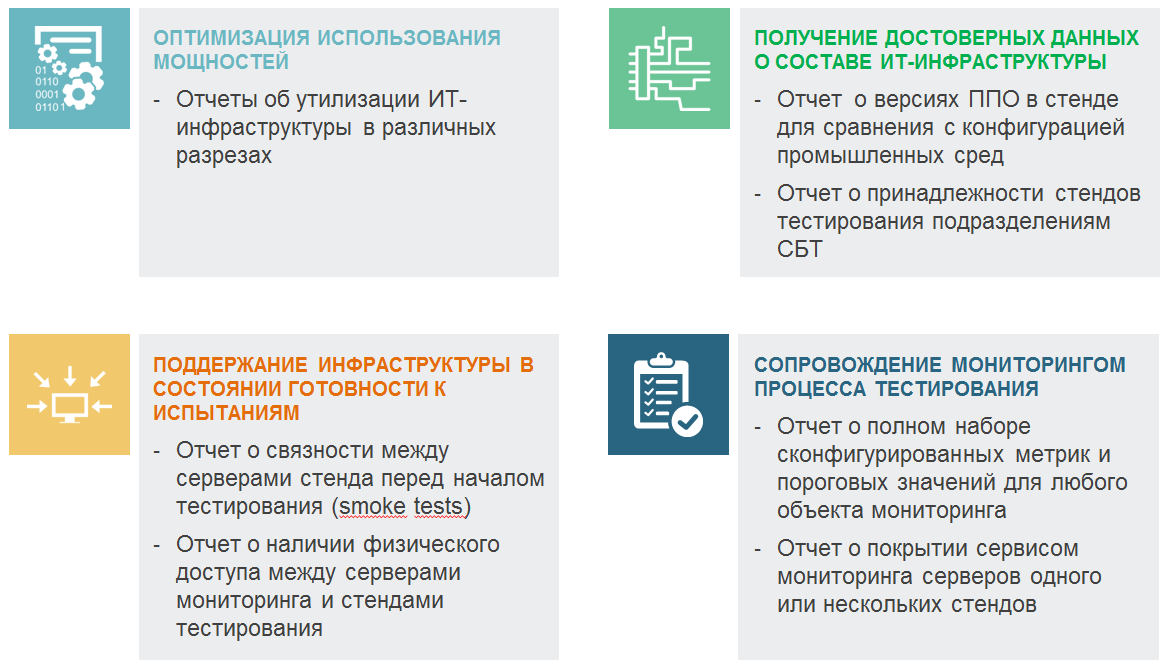
Already at the start of the project, it became clear that the standard reporting tools provided by the Zabbix toolkit will not allow us to fulfill all our needs. In this regard, a separate reporting subsystem was implemented on the basis of the microservice architecture, which significantly expands the capabilities of basic monitoring reports. Now we have already more than twenty reports. Here are some examples along with realizable goals:
Throughout the service, we have evolved email alerts. Here is what they look like at the moment:
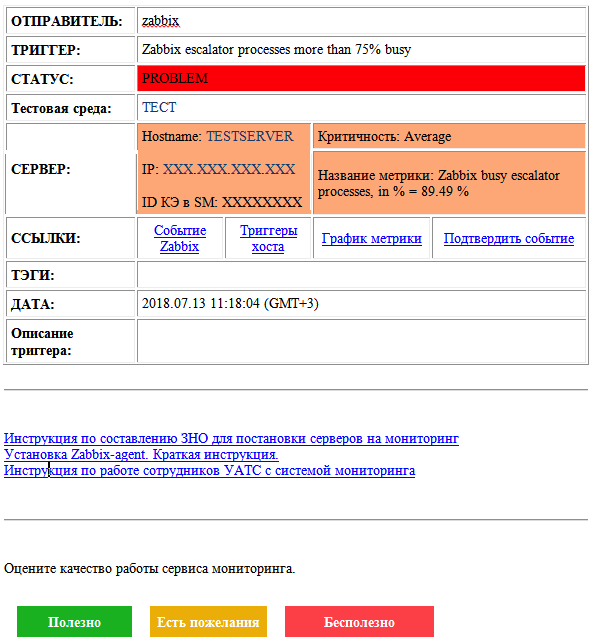
Here there is both information about the problem and its status, and about the monitoring object. There are links to related metrics and events, a field to describe the problem, links to instructions, and a feedback form. For more critical accidents, of course, we also have an SMS distribution.
Such informative alerts allowed us to minimize the communication of most of our users with Zabbix itself. Enough to receive this very mailing. We have grouped users well - there are 365 groups per 1080 people. Therefore, the distribution turns out to be quite punctual - and, accordingly, not annoying. Many of our users have almost forgotten that we have, in fact, Zabbix - they use the mailing list and the Grafana visualization system.
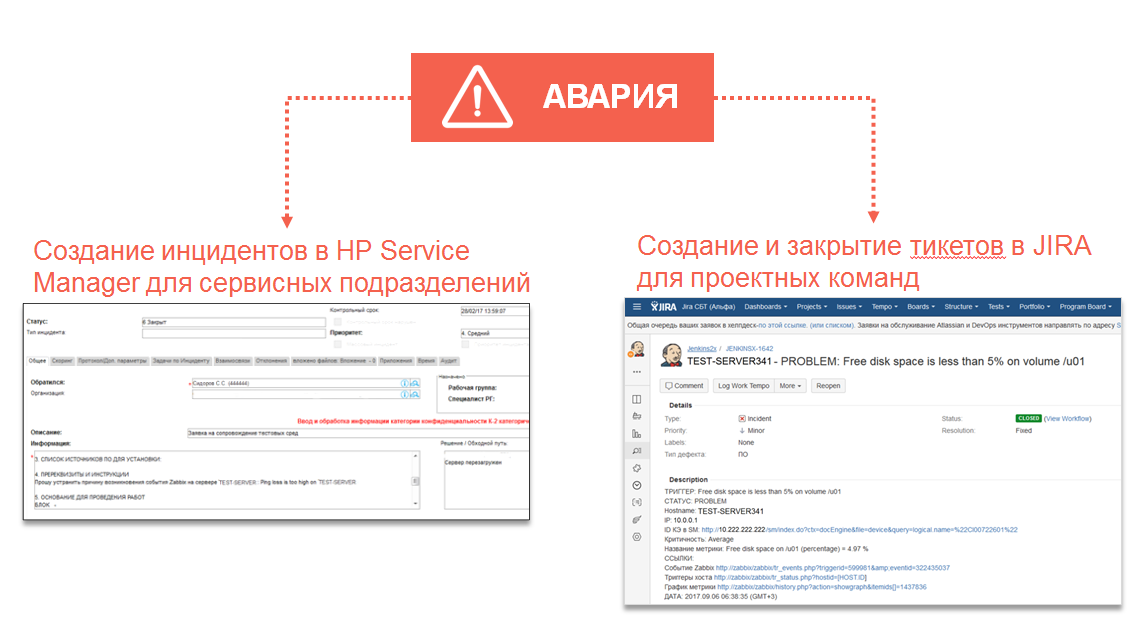
The project initially included the integration of monitoring with some of our IT infrastructure management processes. If the monitoring service recorded an accident, you can create a ticket for it - for those teams that work more with Jira. For service departments, it is possible to create incidents in HP Service Manager:
On the basis of Zabbix, a method for optimizing the utilization of IT infrastructure was also developed and automated. Three main parameters are optimized: the amount of CPU, RAM and hard drives. This technique works on the basis of a moving average and a 90% percentile. Based on this technique, any object or server falls into one of three categories: underutilized, optimally loaded, overloaded.
The above shows how this technique is applied to a specific server. Pink corridor - the value of the moving average. Wide green corridor - raw data. And blue is the 90% percentile.
Integration with the configuration database allowed to automate most of the tasks associated with providing access and building a service-resource model. Thanks to this integration, a set of reports was developed to audit the compliance of a real infrastructure with the way it is described in accounting systems. That is, we can compare how the infrastructure is listed in our accounting systems with what it really is.
Zabbix-based monitoring service also acts as an automation tool and data provider for accessibility management. It monitors the availability of testing tools, as well as the ability to record technological windows.
Based on this functionality, we recently completed the development of a subsystem that tracks the availability of testing polygons. Monitoring is conducted both in the context of testing stands, and in the section of departments. The average value for one day and seven days is calculated.
As I mentioned earlier, one of the important criteria for the functioning of the service is user satisfaction. From 2017, we started collecting feedback:
On this chart, you can see a consistently high satisfaction of the company's employees with the monitoring service since 2017.
Within the framework of the monitoring project, the structure and rules for filling the monitoring knowledge base were developed, which include:
To simplify the work with the monitoring system, we recently started recording video courses. As a result, almost 70% of user requests are closed by sending them relevant links to articles or videos from the knowledge base. This significantly reduced the burden of consulting, which, as we know, is very large among monitoring specialists.
One of the side effects of the introduction of a centralized service was the massive failure of Sbertech units from local monitoring tools during 2016. This allowed the release of a small part of the resources of the units. I will note that the rejection of local systems took place on a voluntary basis and the decision of the units was made on the basis of the advantages provided by the centralized monitoring service.
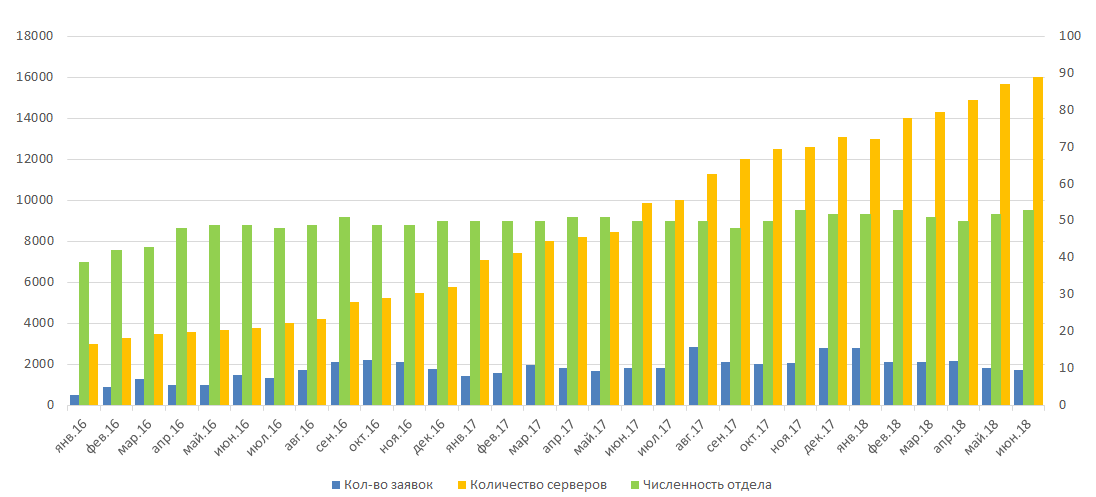
Since the beginning of full-scale work in 2016, the service has been a great help to system administrators. Although the size of the IT infrastructure continues to grow linearly, the administration department does not need to be expanded yet. And this is not least the merit of the monitoring system. With its help, we were also able to stabilize the growth in the number of applications that come to the system administration department from related departments
As a result of KTS optimization in 2016 and its automation based on the monitoring service, it was possible to free up and distribute a large amount of unused resources into the pools of divisions: 600 CPU cores, almost 7.5 terabytes of RAM and about 50 terabytes of disk space.
In 2015, we began to create a centralized monitoring service. And everything was limited not only implementation. It was necessary to work out a lot of regulations, instructions, as well as the relationship between the units of Sbertech within the framework of monitoring. In this post I will tell you in detail how we chose the platform, what principles everything was created for and what we did in the end.
The main goals and ideology of the project
Here are the goals we pursued in the project:
')
- Obtaining reliable data on the size and composition of the IT infrastructure;
- Optimize the use of IT capacity;
- Reducing the cost of maintaining and operating the IT infrastructure of the development and testing environments;
- IT infrastructure support in readiness for development and testing;
- Prompt informing professionals about the problems in the work of test environments;
- Compliance audit of the environments of test environments and industrial AFM is not a typical task for us;
- Data collection for testing results reports, ensuring measurement of critical parameters at all stages of testing.
Looking ahead, I can say that all the goals in one degree or another have already been fulfilled by now. And some related problems monitoring also helped to solve.
In addition to the goals, we formulated the principles, the ideology that was followed during the whole project:
- User satisfaction is one of the main indicators of monitoring. At the ITSMf 2017 conference, I talked about monitoring the IT infrastructure, and the fifth NOT in that report is: “DO NOT force your employees to work with the monitoring system”. The point is to motivate, not commit. This is achieved by properly aligned KPI. At the beginning of the service such KPI may not yet appear. Nevertheless, it is very important to start benefiting potential customers from the first days of monitoring work.
- Minimum time for rework. For this we use the elements of Agile. They help to quickly provide new features and get feedback from customers.
- The openness of the system both for improvements, which is expressed in creating a single backlog, requests to which any employee can write, and in terms of providing information - our service allows you to get information about the monitoring configuration, which is usually hidden.
- High degree of integration into daily work. Our priority is to implement the functionality that users need on a daily basis. This helped in a relatively short time to popularize the monitoring service within the company.
Choosing a monitoring system
Practically in all projects where I participated, sooner or later a table appeared with a comparison of the functionality of various systems, in which a particular system was given an obvious advantage.
In my opinion, such a comparative analysis cannot be done before starting to work directly with the monitoring service, and even more so it is not necessary to make a decision on the choice of a particular decision based on this analysis. Until the system in your company runs for at least a short period of time, it is not possible to unambiguously judge which particular functions exactly in your company will be in demand. Such tables can be a great help if you for some reason want to change the monitoring system.
Comparison with other Zabbix installations
You can talk a lot about how to compare the size of several installations of monitoring systems, but all the characteristics selected for this are, in my opinion, quite subjective. In order for you to have a more accurate idea of the size of our installation, I decided to give examples of similar services in other companies, which Zabbix representatives told at the Highload conference.
As you can see, the Zabbix instance in Sbertech is not much inferior to the largest installations, and in terms of total load it is level with them.
Advantages of Zabbix
In the second half of 2017, we conducted a Zabbix pilot to monitor the PROM infrastructure. Then we formulated a number of qualitative criteria, which we refer to the absolute advantages of Zabbix:
- Open source. Unlimited possibilities for processing and customization.
- The openness of the mechanism and the source of the collection of metrics. In commercial enterprise solutions, many metrics are incomprehensible - various bottlenecks, memory leaks, which even vendor technical support often cannot. Zabbix has no such problem - you can always clearly say how it collects certain metrics. Thus, the credibility of the system by system administrators increases.
- The relative ease of scaling is primarily due to the introduction of additional proxy servers to which part of the load can be transferred. If the performance limit of one instance is reached, it is possible to raise the second one and combine both under one visualization system (Grafana).
- Cool API - in my opinion, this is one of the main advantages of Zabbix. A high-quality, well-developed and understandable API opens up tremendous opportunities for integration with related systems, automation, etc.
- Monitoring dynamic objects is a trifle, but nice. In Zabbix this monitoring is simple and intuitive, it allows you to achieve good results very quickly. Dynamic objects are any objects that appear and disappear on servers during their lifetime: file systems, network interfaces, and others. Therefore, there is a need to automate the setting and removal of these objects from monitoring.
- Relatively small number of components. In commercial solutions, each component is a separate subsystem with its own base, which must be separately installed. And Zabbix is a single system in which all methods of monitoring are concentrated at once: agent, agentless, network and others - only 14 types.
- Data Visualization with Grafana. Integration with Grafana makes it possible to build graphics and create really convenient dashboards.
- Availability of monitoring the availability of IT-services. Zabbix has a built-in subsystem that can calculate the availability of IT services for further use in the SLA.
- Flexibility to create metrics and their thresholds. Here Zabbix has ample opportunities to configure complex monitoring metrics:
- first of all, this is the creation of calculated metrics : on the basis of several simple metrics, one complex is calculated.
- preprocessing of metrics values is available - this is when you, for example, load a large data array into Zabbix, and then, before putting a specific metric into the database, Zabbix analyzes the array and pulls exactly the data that you want to save as a metric .
- master metrics. It is possible to collect an array of data on an object in one survey into one big metric, and then use it as a data source for other metrics. This allows you to reduce the number of requests and synchronize the collection of all metrics on time. - The possibility of internal monitoring. Zabbix, as an open source product, has performance problems. However, a well-thought-out internal monitoring system helps to quickly deal with these problems.
Disadvantages of Zabbix
For the sake of justice, I cannot fail to mention the major, in my opinion, flaws of Zabbix. Of these, you can also make a decent list:
- Low degree of automation of work with the backend. I will make a reservation that I did not have the opportunity to experiment with all the variants of the DBMS. As a backend of Zabbix, our company uses Oracle DBMS. Mass operations can take more than an hour - for example, updating or changing metrics, which is tied to a large number of objects (15 thousand network nodes).
- Lack of built-in monitoring agent monitoring tools. In commercial products such tools are available. In Zabbix this is not yet. There is not even an update toolkit on agents. Of course, everything can be done independently, but it would be better to get these opportunities out of the box.
- So far, the low study of monitoring the availability of IT-services. It's great that there is monitoring, but it needs to be further developed. Now it is not possible to somehow restrict user access to any specific parts of the service-resource model (hereinafter CPM). If the CPM tree is large, the web interface starts to slow down. And the possibilities for customizing the availability calculation in this subsystem are so far low.
- Long updates. The last update of the database took us about eight hours. At this time, the monitoring service was unavailable. Alternatively, you can request support scripts and update separately.
- Modest functionality of the embedded visualization subsystem. Grafana solves this problem, but the integrated visualization leaves much to be desired.
- Built-in monitoring DBMS (ODBC). The fact is that such monitoring opens a separate connection for Zabbix each time the metrics are polled. And if you have a large base (with a large number of metrics collected), then the pool of connections in it may overflow and the base will stop responding, including for the target systems. Zabbix has an alternative monitoring tool (for example, DBforBIX), but setting it up for a large number of objects is quite a laborious task. Plus, you need to write a separate automation.
- Insufficient flexibility of IT infrastructure inventory. On the one hand, it's nice that it is. On the other hand, it looks like a separate tab for any monitoring object on which a rigidly defined set of inventory fields with hard-coded names is located. To change something, you already have to go into the source code of the frontend. It is also impossible to change the number of these fields and sizes - there is a risk to break something in the next update.
- Lack of automation of network mapping. For comparison, you can cite HP OpenView Network Node Manager, which is well able to build network topology maps in automatic mode. In Zabbix, everything will have to be built manually. Perhaps, for this reason, this functionality is practically not demanded by us.
- Insufficient flexibility of the role model. Zabbix has only four user roles with fixed capabilities. In addition, there is no possibility out of the box to restrict user access to the Zabbix API. That is, if the user has access to the frontend, then he automatically has access to the API. In our case, this led to the fact that with inept requests users seriously loaded the system. In addition, it is not possible to give the user access, for example, to read metrics without access, to edit the settings of the monitoring object.
System architecture
Now a few words about the quantitative indicators and the architecture of our system.
Currently, more than 16 thousand objects (mainly servers) are being monitored, from which almost two and a half million metrics are collected. Their total system load is about 19 thousand values per second. All monitoring objects are distributed over more than 1800 groups of devices, the vast majority of which correspond to specific test environments. At the moment, more than 1000 users are registered in the system, which are divided into 365 functional groups.
As you can see, we pay quite a lot of attention to the distribution of devices and users into groups. This allows you to significantly increase the accuracy of alerts from our service.
In total, we have three Zabbix instances. The diagram shows the architecture of the largest of them, which monitors the main IT infrastructure for development and testing. Another instance is monitoring the monitoring infrastructure. And the third instance is used for the development and testing of new monitoring tools. The entire structure of the main instance is virtualized on the basis of VMWare. In general, if possible, it is better not to use any virtualization system, because it is more difficult to search and solve performance problems in the case of a virtual infrastructure.
The backend is based on Oracle Active Data Guard and consists of two databases - the main one and the replica. We have three frontends:
- For administrative tasks, it is configured to perform heavy, complex, and long-term operations that heavily load the server;
- User - with more rigid settings that do not allow users to overload the main monitoring system too much;
- For reporting, he looks at the cue and has been adapted to interact with read-only databases. Grafana is connected to it, which provides high-quality visualization of monitoring data.
Features of the implementation
In this story, I decided not to focus on the basic functionality that is implemented in almost any monitoring - fixing accidents, collecting information about the performance or availability of IT systems. Focus on the distinctive features of our service.
These features primarily include a high degree of automation of typical tasks. We practically do not spend time setting up servers for monitoring, providing access to monitoring results, but focus mainly on developing the service and adding new non-standard features to it. This is greatly helped by more than 200 automation scripts developed since the introduction of the monitoring service into trial operation.
But before you register an agent in Zabbix, you still need to install it. As I wrote above, one of the shortcomings of Zabbix I see is the lack of tools for managing monitoring agents. Therefore, for the installation of agents, we have organized a separate job within our DevOps processes. The figure below shows the installation of the agent.
We have two main entry points. This is either a Python script — it sends, through the REST API, the job Jenkins information about the hosts to which you need to install or update the agent, a list of additional variables, and the name of the playbook that you want to run on Ansible. Or default data can go from Bitbucket. But in Jenkins they can be completely replaced according to the variables that we passed. And it helps us, for example, to update agents that are monitored by different proxy servers. The peculiarity of our process is that the Zabbix agent config is formed almost on the fly.
Reporting
Already at the start of the project, it became clear that the standard reporting tools provided by the Zabbix toolkit will not allow us to fulfill all our needs. In this regard, a separate reporting subsystem was implemented on the basis of the microservice architecture, which significantly expands the capabilities of basic monitoring reports. Now we have already more than twenty reports. Here are some examples along with realizable goals:
Alerts
Throughout the service, we have evolved email alerts. Here is what they look like at the moment:
Here there is both information about the problem and its status, and about the monitoring object. There are links to related metrics and events, a field to describe the problem, links to instructions, and a feedback form. For more critical accidents, of course, we also have an SMS distribution.
Such informative alerts allowed us to minimize the communication of most of our users with Zabbix itself. Enough to receive this very mailing. We have grouped users well - there are 365 groups per 1080 people. Therefore, the distribution turns out to be quite punctual - and, accordingly, not annoying. Many of our users have almost forgotten that we have, in fact, Zabbix - they use the mailing list and the Grafana visualization system.
Integration with management processes
The project initially included the integration of monitoring with some of our IT infrastructure management processes. If the monitoring service recorded an accident, you can create a ticket for it - for those teams that work more with Jira. For service departments, it is possible to create incidents in HP Service Manager:
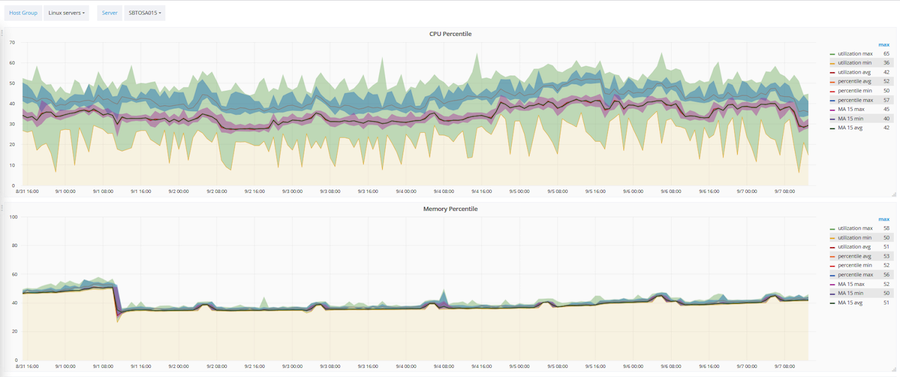
On the basis of Zabbix, a method for optimizing the utilization of IT infrastructure was also developed and automated. Three main parameters are optimized: the amount of CPU, RAM and hard drives. This technique works on the basis of a moving average and a 90% percentile. Based on this technique, any object or server falls into one of three categories: underutilized, optimally loaded, overloaded.
The above shows how this technique is applied to a specific server. Pink corridor - the value of the moving average. Wide green corridor - raw data. And blue is the 90% percentile.
Integration with the configuration database allowed to automate most of the tasks associated with providing access and building a service-resource model. Thanks to this integration, a set of reports was developed to audit the compliance of a real infrastructure with the way it is described in accounting systems. That is, we can compare how the infrastructure is listed in our accounting systems with what it really is.
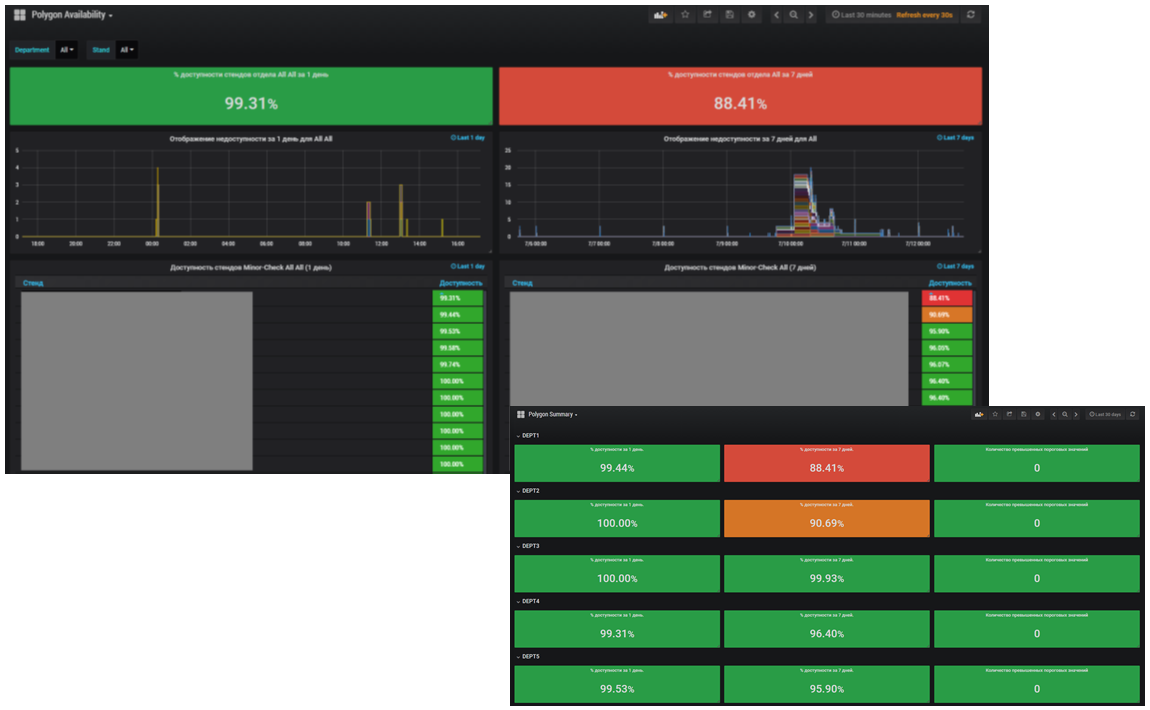
Zabbix-based monitoring service also acts as an automation tool and data provider for accessibility management. It monitors the availability of testing tools, as well as the ability to record technological windows.
Based on this functionality, we recently completed the development of a subsystem that tracks the availability of testing polygons. Monitoring is conducted both in the context of testing stands, and in the section of departments. The average value for one day and seven days is calculated.
Results of the project
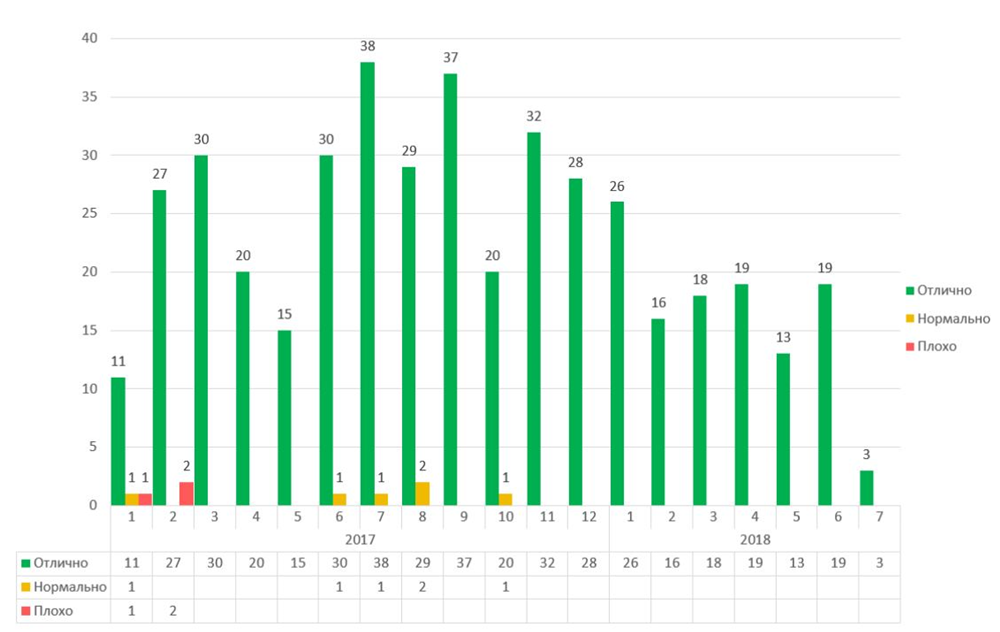
As I mentioned earlier, one of the important criteria for the functioning of the service is user satisfaction. From 2017, we started collecting feedback:
On this chart, you can see a consistently high satisfaction of the company's employees with the monitoring service since 2017.
Within the framework of the monitoring project, the structure and rules for filling the monitoring knowledge base were developed, which include:
- Rules of work with monitoring services
- Rules for the preparation of applications for access
- Instructions for expanding the monitoring functionality
- Description of the capabilities of the monitoring service
- Information about the reports you can get
- Description of accident response processes
To simplify the work with the monitoring system, we recently started recording video courses. As a result, almost 70% of user requests are closed by sending them relevant links to articles or videos from the knowledge base. This significantly reduced the burden of consulting, which, as we know, is very large among monitoring specialists.
One of the side effects of the introduction of a centralized service was the massive failure of Sbertech units from local monitoring tools during 2016. This allowed the release of a small part of the resources of the units. I will note that the rejection of local systems took place on a voluntary basis and the decision of the units was made on the basis of the advantages provided by the centralized monitoring service.
Since the beginning of full-scale work in 2016, the service has been a great help to system administrators. Although the size of the IT infrastructure continues to grow linearly, the administration department does not need to be expanded yet. And this is not least the merit of the monitoring system. With its help, we were also able to stabilize the growth in the number of applications that come to the system administration department from related departments
As a result of KTS optimization in 2016 and its automation based on the monitoring service, it was possible to free up and distribute a large amount of unused resources into the pools of divisions: 600 CPU cores, almost 7.5 terabytes of RAM and about 50 terabytes of disk space.
Source: https://habr.com/ru/post/420731/
All Articles