Simple metrics and a way to save time when searching for problems in the infrastructure
 Not so long ago, in a data center in which we rent servers, another mini incident happened. As a result, there were no serious consequences for our service; according to the available metrics, we managed to understand what is happening in just a minute. And then I imagined how I would have had to wrestle if there were only 2 simple metrics missing. Under the cut a short story in pictures.
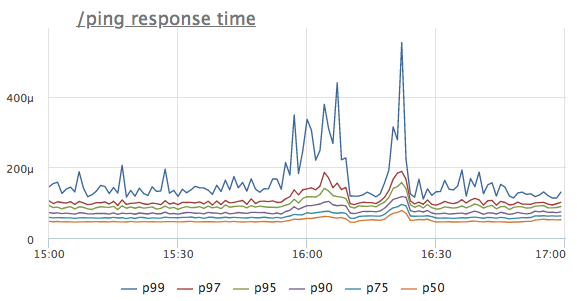
Imagine that we saw an anomaly on the response time of a certain service. For simplicity, let's take the handler / ping, which does not contact any databases or neighboring services, but simply gives '200 OK' (it is needed for load balancers and k8s for a health check service)

What thought comes first? That's right, the service does not have enough resources, most likely the CPU! We look at the consumption of the product:
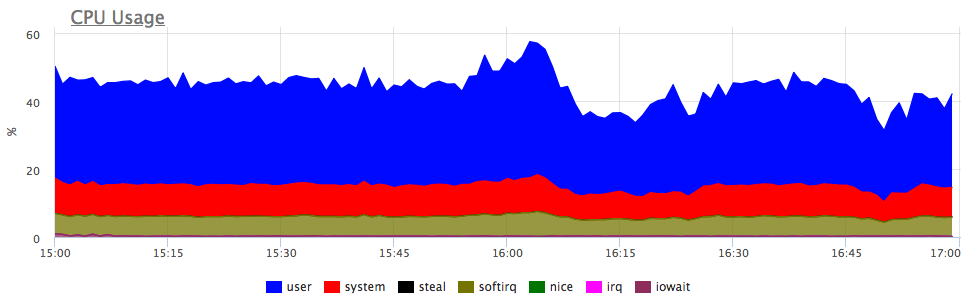
Yes, there are similar bursts. Next, we look at the consumption in the context of services on the server:
')
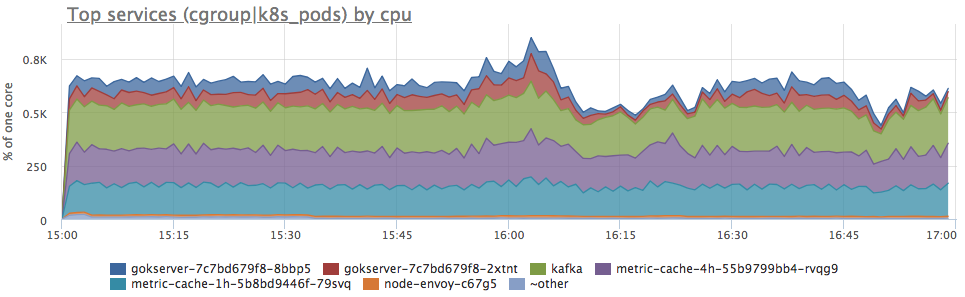
We see that the consumption of the prots increased in proportion to all services. It is impossible to say anything further clearly: you can go and see whether the load profile has changed (since all components are connected and an increase in input requests can actually cause a proportional increase in resource consumption) or understand what has become of the server resources.
Of course, I tried as best I could to keep the intrigue, but at the beginning of the article you probably already guessed that the server simply had a decrease in the number of available cpu cycles. In dmesg, it looks like this:
CPU3: Core temperature above threshold, cpu clock throttled (total events = 88981)
Roughly speaking, we have lowered the frequency due to overheating of the processor. We look at the temperature:
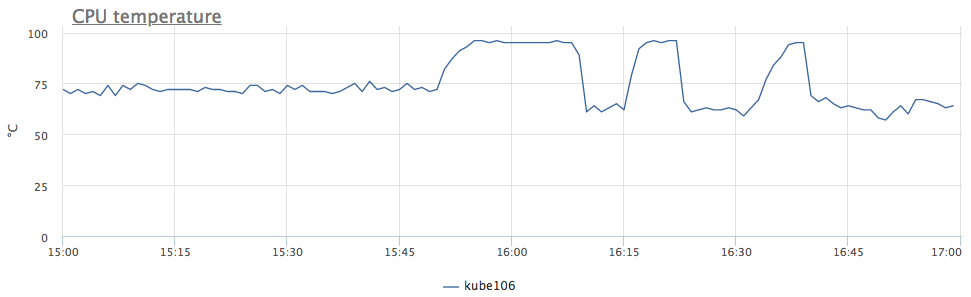
Now everything is clear. Since we have similar behavior was observed immediately in 6 servers, we realized that the problem was in DC, and not in everything, but only in certain rows of racks.
But back to the metrics. We potentially want to know if the servers will overheat in the future, but this is not a reason to add a graph of processor temperature to all dashboards and check it every time.
Usually, triggers are used to optimize the process of tracking some metrics. But what threshold to choose for the trigger temperature of the processor?
It is because of the difficulty to choose a good threshold for a trigger, many engineers dream of an anomaly detector, which itself will not find the settings, I don `t know what :)
The first thought is to set the temperature at the threshold at which our service started having problems. And if you never had overheating? Of course you can look at my schedule and decide for yourself that 95 ° C is what you need, but let's think a little more.
The problem is not because of degrees, but because the frequency has gone down! Let's track the number of such events.
In linux, this can be removed from sysfs:
/sys/devices/system/cpu/cpu*/thermal_throttle/package_throttle_count

To be honest, we don’t even display this metric anywhere, we only have an auto-trigger for all clients, which is triggered when the threshold is reached "> 10 events / second". According to our statistics, there is almost no false positives at this threshold.
Yes, this trigger rarely works, but when this happens, it makes life a lot easier!
We at okmeter.io most of the time are engaged in the development of our database of auto-riggers, which make it easier for our customers to find unknown problems for them.
Source: https://habr.com/ru/post/420663/
All Articles