We write GeoIP exporter for Prometheus with visualizations in Grafana in 15 minutes
Hello to all!
I want to share with you how easy it is to write my exporter for Prometheus at Golang and show how this can be done using the example of a small program that keeps track of where the current TCP connections are geographically established.
0. Disclaimer
I would like right at the very beginning to outline, so to speak, the scope of this publication and say about what it does not tell, so that later there are no questions:
- Yes, this is not customer visualization. This is a visualization of remote connections . That is, it does not divide connections into those in which the connection was initiated by the remote server and those that were initiated by this machine, and will show everything on the map - for example, the server with the repository, where updates are now being downloaded to your machine.
- Yes, I understand that there are anonymization tools on the network that hide the real client IP. The purpose of this tool is not to identify the exact GPS coordinates of any client, but to have at least a general idea of their geography.
- whois provides information more accurate than the country of the IP address, but here I was bound by the limit of the plugin for Grafan, which only renders countries, but not cities.
1. We write "back-end": exporter on go
So, the first thing we need to do is to write an exporter, which will actually collect data from our server and give it to Prometheus. The choice of languages here is great: Prometheus has client libraries for writing exporters in many popular languages, but I chose Go, firstly, because it is so "more native" (since Prometheus itself is written on it), well, secondly, since I use in my DevOps practice.
Well, pretty lyrics, let's get down to the code. Let's start writing "from the bottom up": first, functions for determining the country by IP and the list of remote IP addresses itself, and then sending all this to Prometheus.
1.1. We determine the country by IP address
Well, there’s absolutely everything in the forehead, I didn’t become philosophical and just used the service freegeoip.net , whose API at the time of writing this article has already become deprecated, and now they offer to register for free and be able to make 10,000 requests per month (which is enough ). Everything is simple: there is an endpoint of the form http://api.ipstack.com/<IP>?access_key=<API_KEY> , which simply returns json to us with the field country_code we need - this is all that we need for visualization.
So, we will write a package for pulling the country by IP.
// Package geo implements function for searching // for a country code by IP address. package geo import ( "encoding/json" "fmt" "io/ioutil" "net/http" ) // Type GeoIP stores whois info. type GeoIP struct { Ip string `json:""` CountryCode string `json:"country_code"` CountryName string `json:""` RegionCode string `json:"region_code"` RegionName string `json:"region_name"` City string `json:"city"` Zipcode string `json:"zipcode"` Lat float32 `json:"latitude"` Lon float32 `json:"longitude"` MetroCode int `json:"metro_code"` AreaCode int `json:"area_code"` } // Function GetCode returns country code by IP address. func GetCode(address string) (string, error) { response, err = http.Get("http://api.ipstack.com/" + address + "?access_key=<API_KEY>&format=1&legacy=1") if err != nil { fmt.Println(err) return "", err } defer response.Body.Close() body, err = ioutil.ReadAll(response.Body) if err != nil { fmt.Println(err) return "", err } err = json.Unmarshal(body, &geo) if err != nil { fmt.Println(err) return "", err } return geo.CountryCode, nil } Pay attention to the legacy=1 parameter; I have to use it for backward compatibility; you, of course, if you use their API, use the latest version.
1.2. Creating a list of TCP connections
Here, use the github.com/shirou/gopsutil/net package and filter the connections with ESTABLISHED status, excluding local IP addresses and addresses from the custom blacklist, which can be sent to the exporter at launch (for example, to exclude all your own public IP addresses)
// Package conn implements function for collecting // active TCP connections. package conn import ( "log" "github.com/gree-gorey/geoip-exporter/pkg/geo" "github.com/shirou/gopsutil/net" ) // Type Connections stores map of active connections: country code -> number of connections. type Connections struct { ConnectionsByCode map[string]int `json:"connections_by_code"` } // Function RunJob retrieves active TCP connections. func (c *Connections) RunJob(p *Params) { if p.UseWg { defer p.Wg.Done() } c.GetActiveConnections(p.BlackList) } // Function GetActiveConnections retrieves active TCP connections. func (c *Connections) GetActiveConnections(blackList map[string]bool) { cs, err := net.Connections("tcp") if err != nil { log.Println(err) } c.ConnectionsByCode = make(map[string]int) for _, conn := range cs { if _, ok := blackList[conn.Raddr.IP]; !ok && (conn.Status == "ESTABLISHED") && (conn.Raddr.IP != "127.0.0.1") { code, err := geo.GetCode(conn.Raddr.IP) if code != "" && err == nil { _, ok := c.ConnectionsByCode[code] if ok == true { c.ConnectionsByCode[code] += 1 } else { c.ConnectionsByCode[code] = 1 } } } } } 1.3. And finally, send everything to Prometheus
More precisely, he will take everything. Just listen to the port and give it collected metrics.
Using github.com/prometheus/client_golang/prometheus we create a Gauge type metric. In fact, it was possible to create a Counter , just later we would use the rate when querying the database. Perhaps the latter, from the point of view of Prometheus, is more effective, but while I was writing this exporter (six months ago) I was just starting to get acquainted with Prometheus and for me Gauge was enough:
location = prometheus.NewGaugeVec( prometheus.GaugeOpts{ Name: "job_location", Help: "Location connections number", }, []string{"location"}, ) By collecting metrics using the preceding paragraphs, we update our vector:
for code, number := range c.ConnectionsByCode { location.With(prometheus.Labels{"location": code}).Set(float64(number)) } We start all this with an infinite loop in a separate gorutin, and in the main one we simply bind the port and wait for our metrics to be taken by Prometheus:
prometheus.MustRegister(location) http.Handle("/metrics", prometheus.Handler()) log.Fatal(http.ListenAndServe(*addr, nil)) Actually, all the code can be viewed in the repository on GitHub , I do not want to copy-paste everything here.
2. "Front-end": Grafana
But for a start, of course, you need to tell Prometheus to collect our metrics:
- job_name: 'GeoIPExporter' scrape_interval: 10s static_configs: - targets: ['127.0.0.1:9300'] (or using service discovery, if you, for example, Kubernetes). Prometheus can be forced to re-read the config by sending a HUP signal to it:
$ pgrep "^prometheus$" | xargs -i kill -HUP {} We go to it in the UI and check that the metrics are collected:

Great, now it's the Grafan's turn. We will use the plugin grafana-worldmap-panel , which must be pre-installed:
$ grafana-cli plugins install grafana-worldmap-panel Next, go to it in the UI and click add panel -> Worldmap Panel. In the Metrics tab, enter the following query:
sum(job_location) by (location) And specify the legend format: {{location}} . It should look like this:

Next, go to the Worldmap tab and configure everything as in the screenshot:

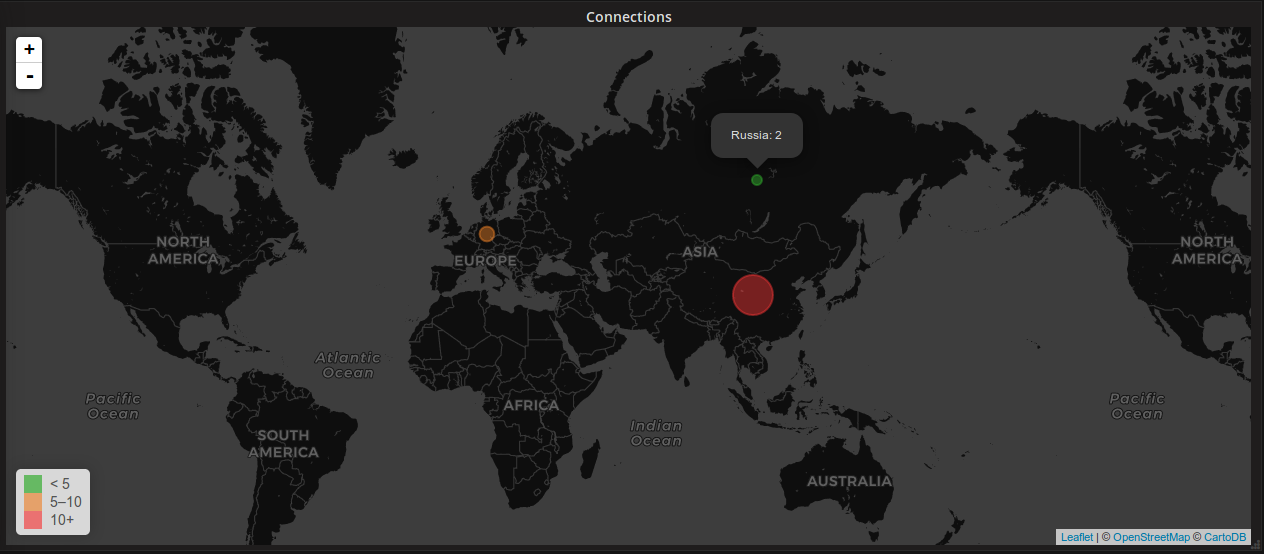
And that's it! Enjoying our map.
In this simple way, you can make a beautiful map of compounds in Grafan.
Thank you for your attention and waiting for your comments.
Todo
Of course, to use the tool for its intended purpose, you need to finish it: filter the addresses of local subnets and much more. By the way, if anyone is interested and wants to develop this exporter - welcome to the repository on GitHub!
Links
')
Source: https://habr.com/ru/post/420633/
All Articles