Features using Druid on the example of Odnoklassniki

My name is Yuri Nevinitsin, and I deal with the internal statistics system in “OK”. I want to talk about how a 50-terabyte real-time analytical system, in which billions of events are logged daily, we transferred from Microsoft SQL to a column database called Druid. And at the same time you will learn a few recipes for using Druid 'a.
Why do we need statistics?
We want to know everything about our site, so we journal not only the behavior of disks, processors, etc., but also every user action, every interaction between subsystems and all internal processes of almost all our systems. The statistics system is closely integrated into the development process.
Based on data from the statistics system, our managers set teams goals, track their achievement and key indicators. Administrators and developers monitor the work of all systems, investigate incidents and anomalies. Automatic monitoring constantly monitors and at the early stage identifies malfunctions, makes predictions for exceeding the limits. We also constantly run features and experiments, make updates and changes. And we monitor the effect of all these actions through the statistics system. If she refuses, we will not be able to make changes to the site.
')
Our statistics is presented mainly in the form of graphs. Usually the chart displays several days at once, so that the dynamics are clear. Here is an example of my experiments with Druid. Here is the data load schedule (lines / 5 min).
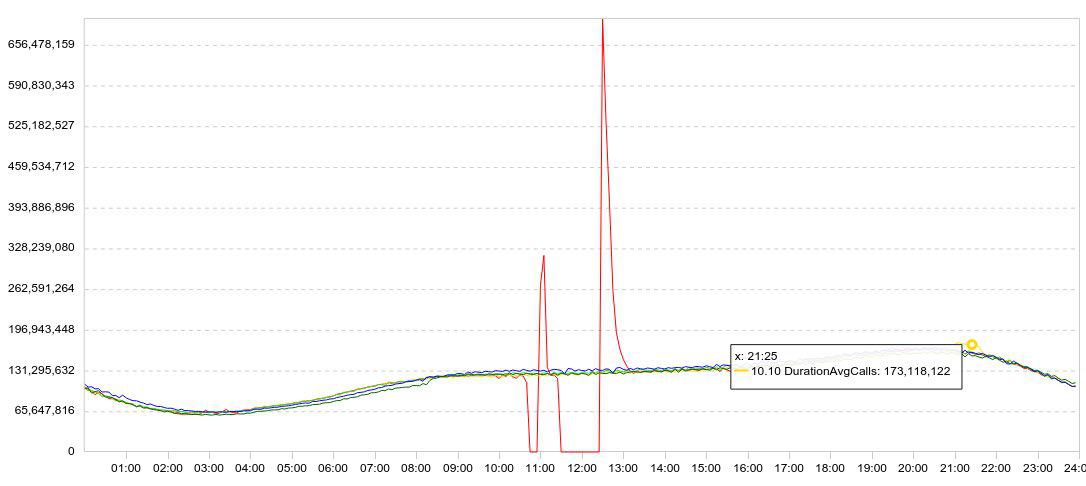
I slowed down the download (the red graph falls to zero), waited a while, restarted the download, and watched how quickly Druid could load the accumulated data (peaks after the failures).
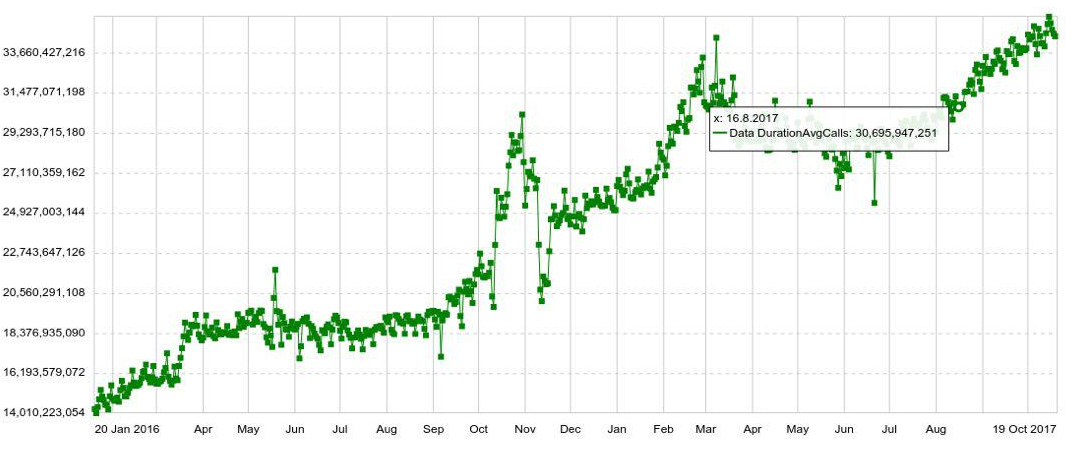
Any schedule can be expanded in any parameter, for example, by host, table, operation, etc. We also have long-term charts with annual dynamics. For example, below is a daily schedule to increase the number of entries in Druid.
We can also combine several graphs on separate panels (dashboards), which turned out to be very convenient. And even if the user needs to see only a couple of hundreds of graphs, he still opens them not individually, but in a panel, which increases the load on the system.
Problem
While the amount of data was small, we coped well with SQL. But with the growth of data, the issuance of graphs slowed down. And in the end, statistics at rush hour began to lag behind for half an hour, and the average response time of one chart reached 6 seconds. That is, someone received a schedule for 2 seconds, someone for 10-20, and someone for a minute. (You can read about the development of the SQL system here )
When you investigate an anomaly or incident, you usually need to open and see a dozen charts, each of which follows from the previous one, they cannot be opened at the same time. I had to wait 10 times for 10-20 seconds. This is very annoying.
Migration
It was possible to squeeze something else out of the system, add servers ... But around the same time, Microsoft changed the licensing policy. If we continued to use SQL Server, we would have to give millions of dollars. Therefore, we decided to migrate.
The requirements were:
- Statistics should not fall behind (more than 2 minutes).
- The schedule should open no more than 2 seconds.
- The entire panel should open no more than 10 seconds.
- The system must be fault tolerant, able to survive the loss of the data center.
- The system should be easily scalable.
- The system should be convenient for modifying, so we wanted it to be in Java.
All this was offered to us only by Druid. It also has a preliminary aggregation, which allows you to save some more volume, and indexing during data insertion. Druid supports all types of queries that are needed for our statistics. Therefore, it seemed that we could easily substitute Druid instead of SQL Server.
Of course, the role of a candidate for the move, we considered not only Druid. My first thought was to replace Microsoft SQL Server with PostgreSQL. However, this would only solve the problem of financial costs, but would not help with the availability and scaling.
We also analyzed Influx, but it turned out that the part that is responsible for high availability and scalability is closed. Prometheus, with all due respect to its performance, is more focused on monitoring and cannot boast of high availability or simple scalability. OpenTSDB is also more suitable for monitoring, it does not have indices for all fields. We did not consider Click House, as it was not at that time.
Put Druid. Terabytes of data migrated. And immediately after switching from SQL Server to Druid, the number of graph views increased 5 times. Then they started to launch “heavy” statistics, which they were afraid to launch before, because SQL would hardly have coped.
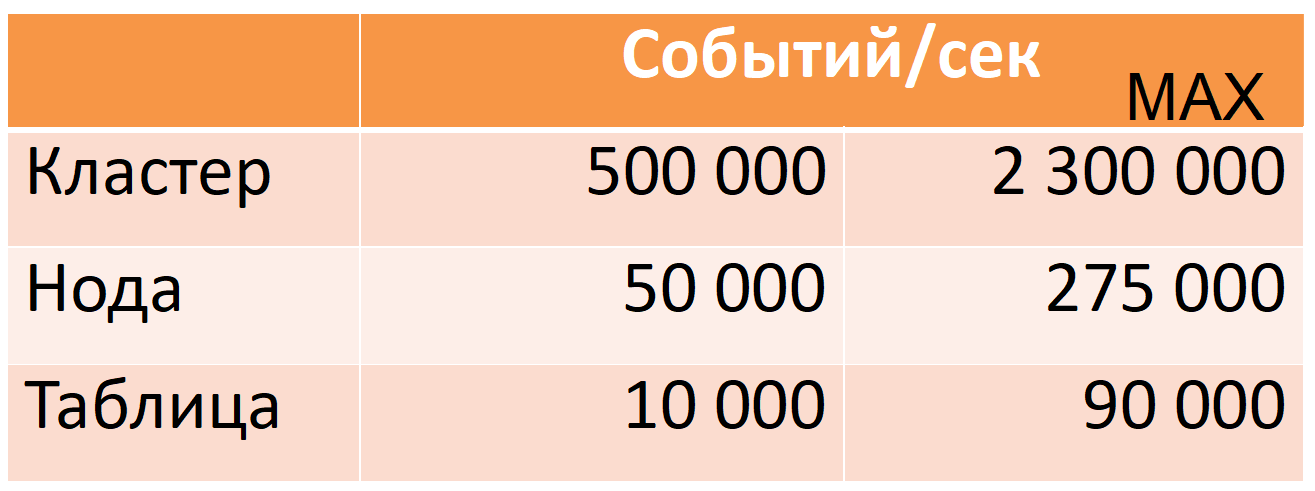
Now Druid of 12 nodes (40 cores, 196 GB RAM) takes 500 thousand events per second during rush hour, while there is a large margin of safety (column MAX: almost fivefold CPU margin).
These metrics are captured on production data. I'll tell you how we achieved this, but first I will describe Druid myself first.
Druid
This is a distributed column timeseries OLAP-system. In its documentation, there are no usual for the SQL world concepts table (datasource instead) and string (event instead), but I will use them for ease of description.
Druid is based on several data assumptions (limitations):
- each data line has a timestamp that grows monotonously (within the default 10-minute window).
- the data does not change, Insert only (there is no Update operation).
This allows you to cut data into so-called segments of time. A segment is a minimal indivisible and invariable “partition” of one table for a certain period of time. All data operations, all requests are performed by segment.
Each segment is self-sufficient: in addition to the main table, written in a column view, it also contains reference books and indices necessary for the execution of queries. We can say that a segment is a small column read-only database (A more detailed description of the segment device will be below).
In turn, this leads to “distribution”: the ability to divide a large amount of data into small segments in order to perform computations in parallel (both on one machine and on many at once).
If you need to “update” at least one line, you will have to reload the entire segment. It is possible and everything is ready for it. Each segment has a version, and a segment with a more recent version will automatically replace the segment with the old version (however, if you need to update regularly, then it is worth reevaluating whether Druid is suitable for this usecase).
To describe the device segment, consider a simple example in the usual tabular form:
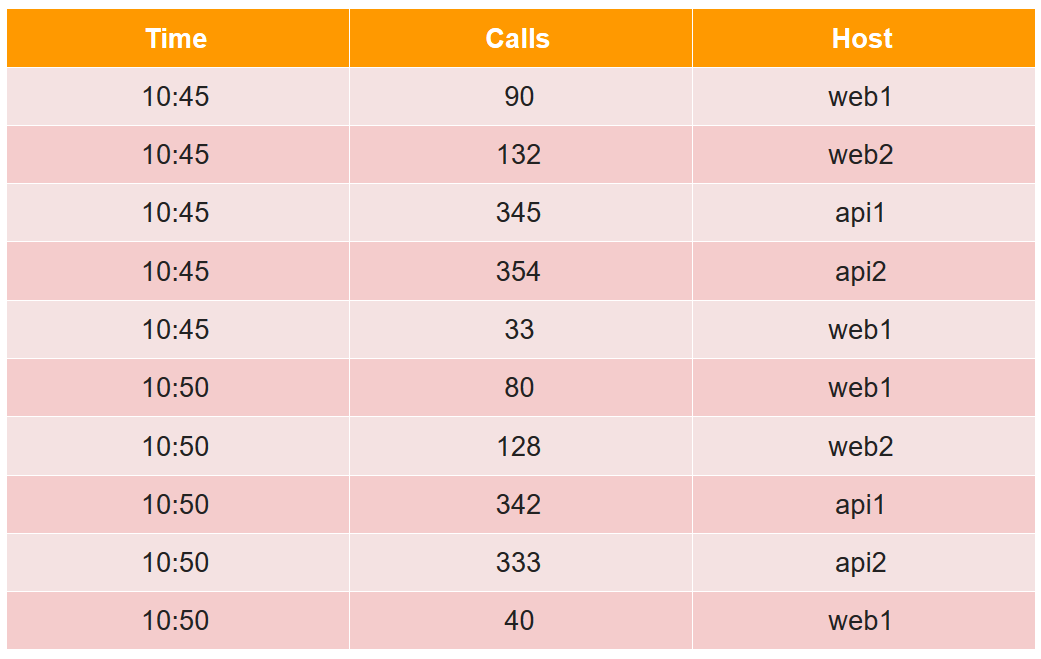
In this table, the number of calls (calls) for two five-minutes from four hosts (note, for host web1, two lines in each five-minute).
All data cells from the point of view of the druid are divided into three types:
- timestamp - UTC timestamp in ms (in the example it's Time).
- metrics is what you need to calculate (sum, min, max, count, ...), and they need to be known in advance for each table (in the example, this is Calls, and we’ll assume that this is the sum).
- dimensions is something for which you can group and filter (they are not necessary to know in advance and can be changed on the fly) (in the example, this is Host).
When inserting, all rows are grouped by the full set of dimensions + timestamp, and if they match, the “her” aggregation function is applied to each of the metrics (as a result, there are no rows with the same set of dimensions + timestamp). Thus, our example after insertion into the druid will look like this:
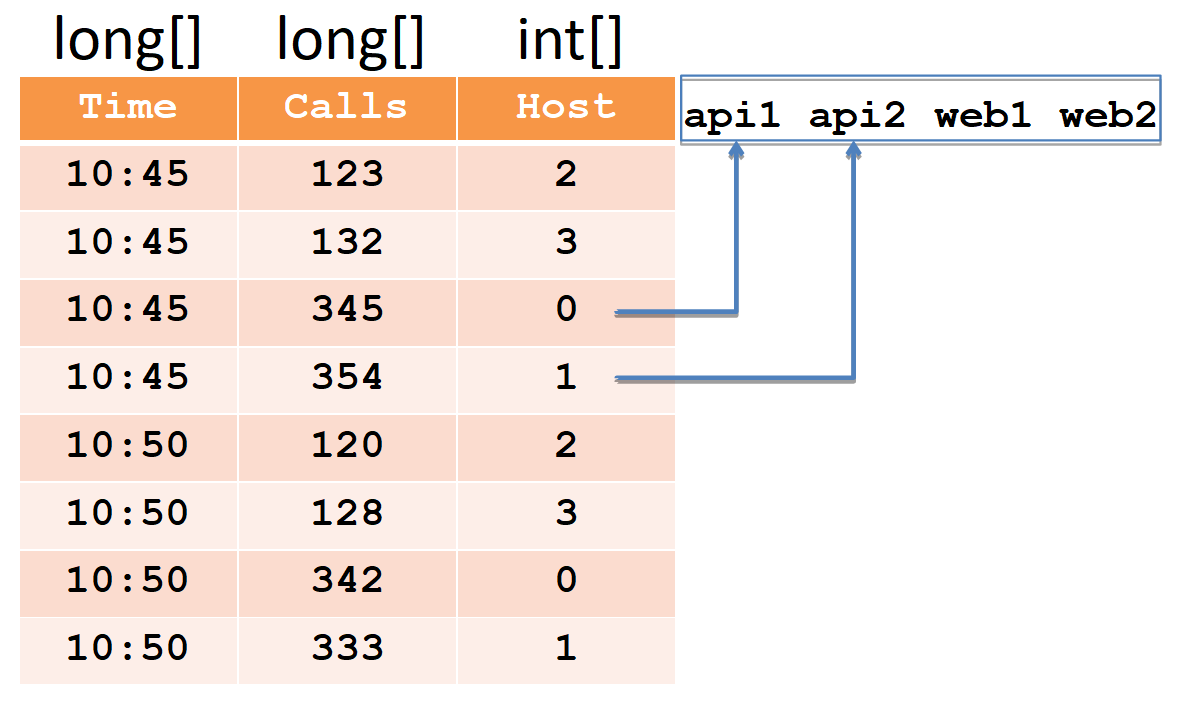
Timestamp and all metrics (in our case, it is Time and Calls) will be recorded as arrays of long numbers (float and double are also supported). For each of the dimensions (in our case, this is Host), a dictionary will be created - a sorted set of strings (with host names). The host column itself will be written as an array of int, pointing to numbers in the dictionary.
Please note that after insertion into the druid, pairs of lines for the web1 host with the matching timestamp were aggregated, and the total amount was recorded in the calls (it is impossible to extract the original data from the druid).
Indexes are required for fast data filtering, as there may be millions of rows and thousands of hosts. Indices are bitmaps, one for each line in the dictionary.

Units indicate the line numbers in which this host participates. To filter the two hosts, you need to take two bitmaps, combine them through OR, and in the resulting bitmap unit select the line numbers.
Druid consists of many components.
First, it has several external dependencies.

- Storage. There Druid simply stores the segments in compressed form. This may be a local directory, HDFS, Amazon S3. Only space is used here, no calculations are done.
- Meta: a database for meta information. This database contains a complete map of data: which segments are relevant, which are outdated, which path are in storage.
- With the help of ZooKeeper, the system performs discovery and announces on which druid nodes which segments are available for querying.
- Cache of executed requests, it can be memcached or local cache in java heap.
Secondly, the Druid itself consists of components of several kinds.
- Realtime nodes load the fresh data stream in the order they are received and serve requests for it.
- Historical nodes contain the entire mass of data and serve requests for it. When we say that we have a 300 TB cluster, we mean historical nodes.
- Broker is responsible for the distribution of computations between historical and realtime nodes.
- The Coordinator is responsible for the distribution of segments by historical nodes and for replication.
- Indexing service, which allows (re-) to load data in batches, for example, in order to “update” a part of the data.
Data stream

Bold arrows indicate the data stream, thin ones - the metadata stream.
A realtime node takes data, indexes it, and cuts it into segments by time, for example, by day.
Each new segment of realtime-node writes in storage and leaves its copy to serve requests for it. She then writes the metadata, indicating that a new segment has appeared in the repository along such a path.
This information is received by the coordinator, periodically re-reading the metadata base. When he finds a new segment, he (via ZooKeeper) orders several historical nodes to download this segment. Those download and (via ZooKeeper) announce that they have a new segment. When a realtime node receives this message (via ZooKeeper), it deletes its copy to make room for new data.
Query Processing

Three types of nodes are involved in processing requests: broker, realtime and historical. The request comes to a broker who knows which nodes on which segments are located. It distributes the query across the historical (and realtime) nodes that store the desired segments. Historical nodes also parallelize the calculations as much as possible, send the results to the broker, and he gives them to the client. By combining this scheme with column data storage, Druid can process large amounts of information very quickly.
High availability
As you remember, Druid in the list of dependencies has a base for metadata, which happens to be MySQL or PostgreSQL. Apache Derby is also mentioned, but this product cannot be used for production, only for development (as I understand it, derby is used in the embedded form so that in the dev-environment it doesn’t raise mysql / pgsql).
What happens if this base fails (and / or storage and / or coordinator)? A realtime node will not be able to write metadata (and / or segments). Then the coordinator will not be able to re-read them and will not find a new segment. The historical node will not download it, and the realtime node will not delete its copy, but will continue to download fresh data. As a result, data will begin to accumulate in realtime nodes. Infinitely it can not continue. Nevertheless, it is known what resources are available on realtime nodes, and what is the flow of data. Therefore, we have a predictable amount of time for which we can repair the failed database (and / or storage and / or coordinator).
Since the supported mysql / pgsql does not guarantee high availability out of the box, we decided to play it safe and used our own (ready-made) solution based on Cassandra, since it provides high availability from the box (you can read more about it here ).
In addition, we modified the realtime node in such a way that, with excessive accumulation, the oldest data is deleted, making room for new ones. This is very important for us, because the situation when we have not been able to lift the failed base for a long time (and / or storage and / or coordinator), and a lot of data is accumulated, most likely, is the result of a big accident. And at this moment the most recent data is most important.
Druid and ZooKeeper
With ZooKeeper, everything is better and worse. Better because ZooKeeper is fault tolerant by itself, it has replication out of the box. It would seem that could happen?
Generally speaking, this chapter is no longer relevant. And this is not a success-story, it is a pain that (and we, and in a fresh druid) decided cardinally, removing almost all the data from ZooKeeper, and now the druid nodes are requesting them from each other directly via HTTP.
In ZooKeeper there are two types of timeouts. Connection timeout is a simple network timeout, after which the client reconnects to ZooKeeper and tries to restore its session. And the session timeout, after which the session is deleted, and all ephemeral data created during this session is also deleted (by ZooKeeper itself), which all other ZooKeeper clients are notified about.
Based on this, discovery in the druid works: each node creates a new session in ZooKeeper when it starts up and writes ephemeral data about itself: host: port, node type (broker / realtime / historical / ...), connection timestamp, etc. ... Other druid nodes receive notifications from ZooKeeper and read this data, so they will know that a new druid node has risen and what kind of node it is. If a druid node has fallen, after the timeout of its session, the data about it will be deleted by ZooKeeper, and the other druid nodes will know about it. So that they learn about it faster, we prefer to put down a small timeout session.
When a realtime or historical node rises, it also records in ZooKeeper, apart from information about itself, a list of the segments it has (this is also ephemeral data). Further on in the course of work, segments on realtime and historical nodes are created new and old ones are deleted, and each node reflects this in its list in ZooKeeper. This list may be large, so it is divided into parts in order to overwrite not the entire list, but only the modified part.
Broker, in turn, when he sees a new realtime or historical node, also reads a list of segments from ZooKeeper to distribute requests to this node. Realtime nodes read this list to remove their copy of the segment that appeared on the historical node. Since the list is divided into parts, and overwritten in parts, ZooKeeper will tell you which part was changed, only it will be re-read.
As I said, this list can be large. When there is a lot of data in ZooKeeper, then it turns out that it is no longer so stable. In our case, the obvious problems started when the number of segments reached approximately 7 million, then the ZooKeeper snapshot then occupied 6GB.
What happens if the druid node loses touch with ZooKeeper?
Druid works with ZooKeeper in such a way that in the case of a session timeout, each node creates a new session and writes all its data there and re-reads the data of other nodes. As there is a lot of data, traffic on ZooKeeper takes off. This can lead to a timeout on other druid nodes, then they, too, start overwriting and re-reading. Thus, the traffic grows like an avalanche, to the extent that ZooKeeper loses synchronization between its instances and starts to send snapshots back and forth.
What does the user see at this moment?
When a broker loses touch with ZooKeeper (and the session timeout occurs), he no longer knows which segments lie on which historical nodes. And gives empty answers. That is, if ZooKeeper is down, then Druid does not work either. "Cure" is completely impossible, but in some places you can lay straws.
First, you can delete data from ZooKeeper. It's okay if they get lost: Druid simply overwrites them. If the problem with ZooKeeper has already begun, then for its speedy solution it is recommended to disable ZooKeeper, delete the data and pick it up empty, and not wait for it to resolve itself.
Now we increase the session timeout. What happens in this case?
Suppose that the historical node restarted incorrectly and did not delete the old session from ZooKeeper, while creating a new one and writing a bunch of data there. While the old session is still alive and not timed out, two copies of the data are stored in ZooKeeper. If such nodes restart a lot at once, then a lot of data will be duplicated. Therefore, you need to keep a memory reserve for ZooKeeper so that it does not run out and ZooKeeper does not stop working. Why it was impossible to delete the data of the old session?
For the same reason, it is necessary to shut down the work of the historical node correctly, since at this moment they delete their data from ZooKeeper, and they can do it for a long time. Our completion of historical nodes takes about half an hour.
Historic nodes have another feature. When they are launched, they look at which segments are stored on them, and then the information about this is recorded in ZooKeeper. And since the data is spread over the historical nodes more or less evenly, then if you run them simultaneously, they will start writing about ZooKeeper simultaneously. This again increases the likelihood of a wave-like increase in traffic and timeouts. Therefore, it is necessary to run historical nodes sequentially in order to spread the recording sessions to ZooKeeper in time.
We also did two more optimizations:
- We reprogrammed the work with ZooKeeper a bit so that only those nodes that need it were read from Druid. And they need only realtime, broker and coordinator, but not historical nodes. They do not need to know which other historical nodes have any segments. Also, all this is not necessary for the indexing service and its workers, which can be many.
- From the data that is written in ZooKeeper, they removed all unnecessary and left only what is necessary for the execution of queries. This reduced the amount of data in ZooKeeper from 6 GB to 2 GB (this is the size of the snapshot).
As a result, the volume of sharply growing traffic decreased by about 8 times; thus, we maximally reduced the likelihood of fan timeouts.
Download to Druid
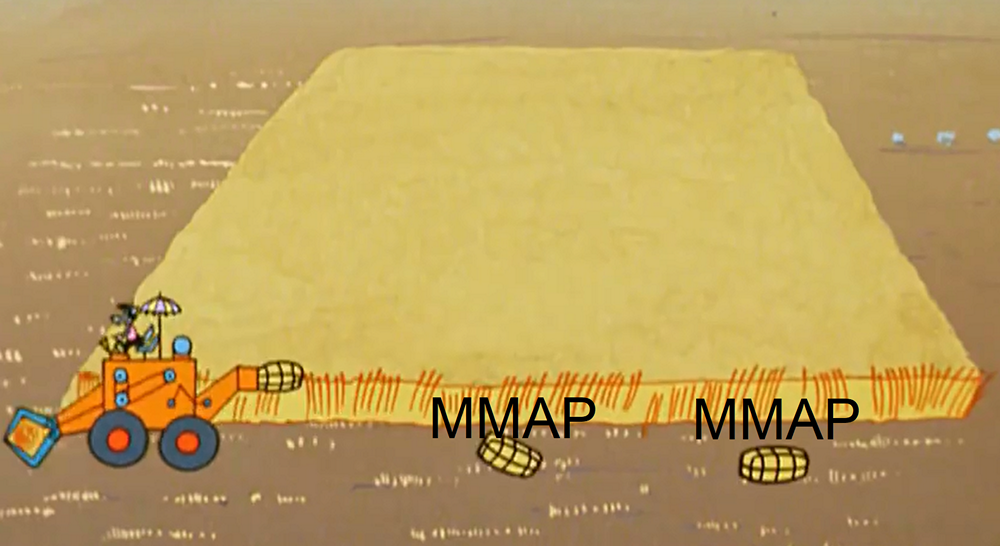
As realtime data is loaded, the node periodically frees up memory, flushing data in parts to disk. Technically, these parts are mini-segments (each has a table, directories, indices). And for processing requests for this data, they pull up using MMAP (as well as full-fledged segments). By the end of loading one segment, such parts accumulate quite a lot. Two points are connected with this.
First, a realtime node can corrupt data, not only during a JVM crash or unexpected server reboot, but even during a proper restart.

This is why this happens. The process of flushing data to disk consists of two parts: 1) directly resetting the data and 2) storing the position from which to start after restarting. These two types of data are recorded completely independently; they know nothing about each other. And, of course, not atomic. And depending on what is lost, we have either data loss or duplication. (At the moment, in the original druid it is being actively repaired, but not repaired).
This problem can be solved if you do not use realtime nodes and load data using the indexing service, or use them as a pair, since the indexing service does not save the position at all, it will either load the entire segment, or will throw away what failed to load (for any reason).
The second point is the degradation of performance on demand. The more of these parts accumulate on the disk, especially on heavy data and queries, the worse.
To understand this problem, you need to return to the device segment in Druid and our example. As I showed earlier, after loading the data from the example into the druid, the resulting segment will look like a set of columns, a dictionary and indexes to it.
Now let's figure out how the query works on this segment. Suppose you need to count the total number of calls for several classes of hosts (web%, api%).
- Druid will first take the first filter - a regular expression. It will process the entire dictionary and find the hosts that satisfy the filter.
- Take the corresponding bitmaps, merge and save in the intermediate bitmap.
- Then Druid will take the second regular schedule, the second filter will do the same: go through the dictionary, take the bitmaps, merge, get the intermediate second bitmap.
- At the end of Druid, the resulting pack of intermediate bitmaps is combined into a final bitmap, which will show which lines we need to sum up the calls.
Using the profiler, I found out that when processing a request, 5% of the time is spent on calculating the amount, and 95% on filtering.
Now let's see what happens when a realtime node drops data in parts to disk at boot time.
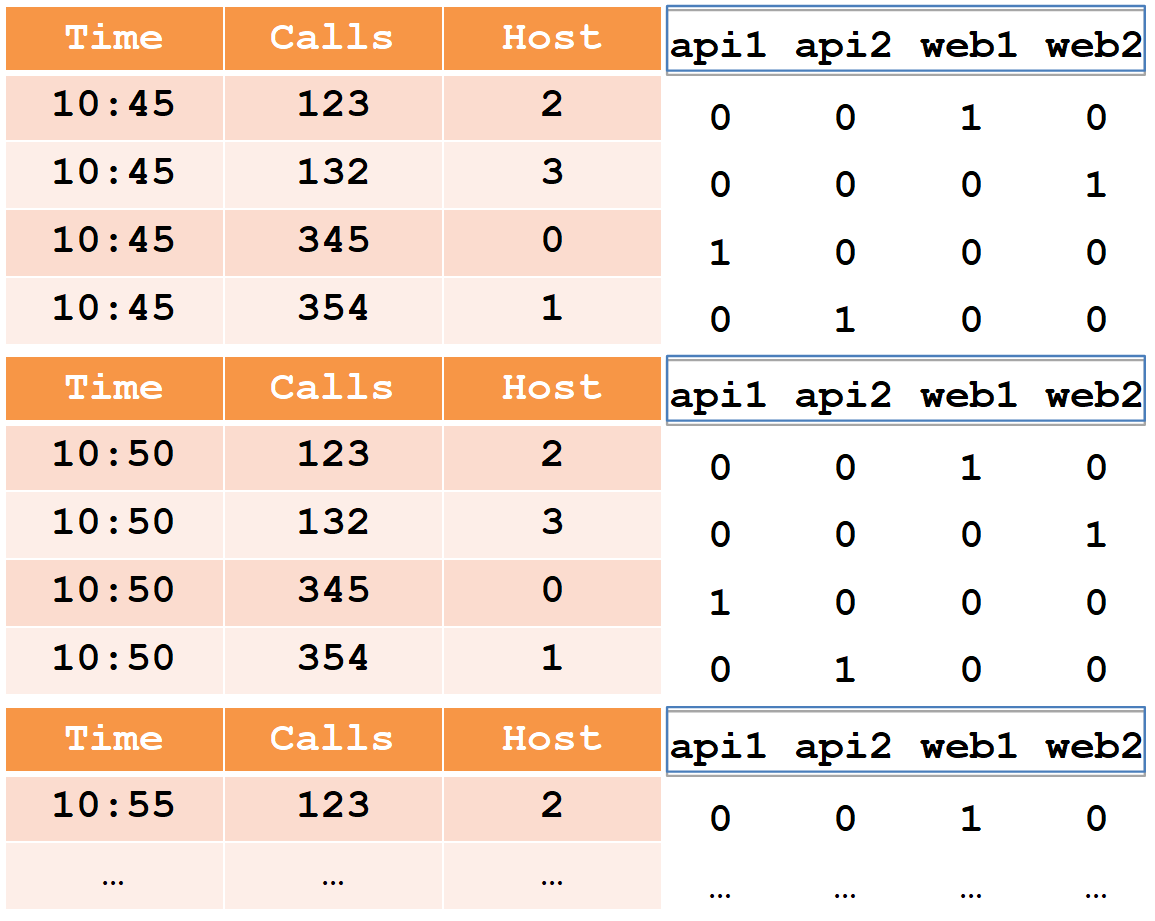
Started downloading data, dropped part (for 10:45) to disk. It turned out a mini-segment with three columns, a dictionary and bitmap indexes. We swing further, we dump the second part (for 10:50) on a disk, the mini-segment has again turned out. And so on. If we analyze in parts, we will note that the columns “calls”, “time” and “host” in these parts were cut proportionally.
But with the dictionary and indices comes out differently. Each host resets its data every five minutes, so all hosts are “marked” in each part of the disc to disk. The dictionary turns out to be equally large, it is not cut in any way, and there are as many indices to it. When processing a request, passing through a dictionary and combining bitmaps (which takes 95% of the time) must be done for each of the parts, so the dependency is almost linear: the more parts, the longer the query takes. It is almost not noticeable in the dictionary until 100 values, and it will become very noticeable to slow down when there are more than 1000.
What can you do about it? You can control the number of parts flushed to disk. For example, if you have a daily segment and requests are inhibited in realtime nodes, then reduce it to the hourly one. Then the number of parts will be reduced proportionally (since the data will move faster in the historical nodes and be deleted from the realtime node), and the braking will be proportionally less.
There are also two parameters that allow you to control the frequency of resetting these parts to disk: the maximum number of lines in the memory and the reset interval to disk. For example, you can reset more than once every five minutes, and once every half hour. And not every 100 thousand lines, but every million. Then the parts will be smaller and everything will work many times faster.
There is still an important point. Sometimes 80% of the time spent on filtering takes a passage through the dictionary with regular expressions, rather than combining bitmaps. We did not know about this and during the migration all the filters were made regular expressions. So do not. When we filter by the exact value, you should use a selector type filter, as it finds the desired value using a binary search and immediately gets a bitmap. It works a thousand times faster than a regular expression.
Ribbon optimization
As you know, in any social network there is a tape of events that collects content created by all development teams. Of course, all these teams want to watch and write statistics. We have the statistics of the tape written in one tablet, 8 billion lines per day. She braked even in Druid. And the worst thing is that when she braked, she overloaded the entire Druid, that is, it slowed down everything and everyone. In these statistics was a combined field, which consists of several words connected through a point. Like that:
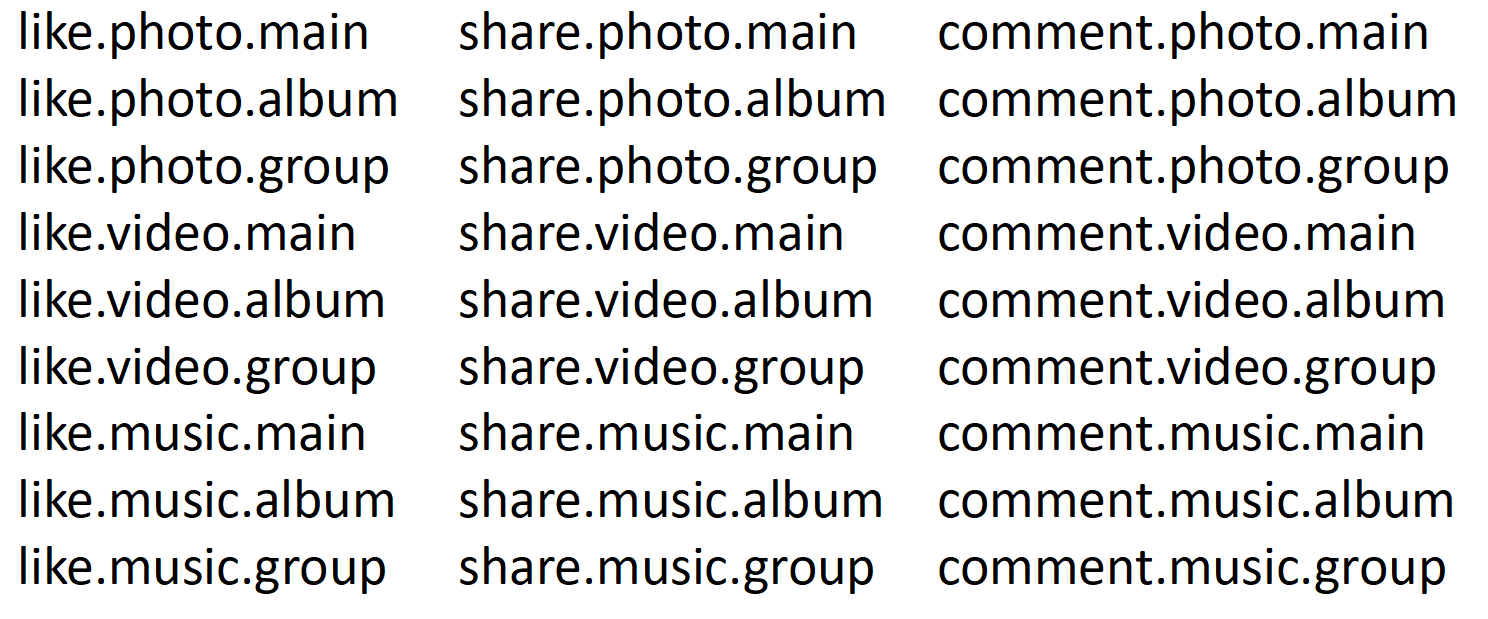
We can make a photo on the main one, in an album, in a group. Same with video and music. We can also share photos, videos and music on the main, in the album and in the group. And we can comment on everything. Total got 27 combinations of events. Accordingly, the dictionary will have 27 lines, 27 bitmaps.
We want to count how many likes. This query will pass a regular expression on 27 values in the dictionary, select 9 of them, get 9 bitmaps, merge and go to count.
Now let's cut it into three parts.
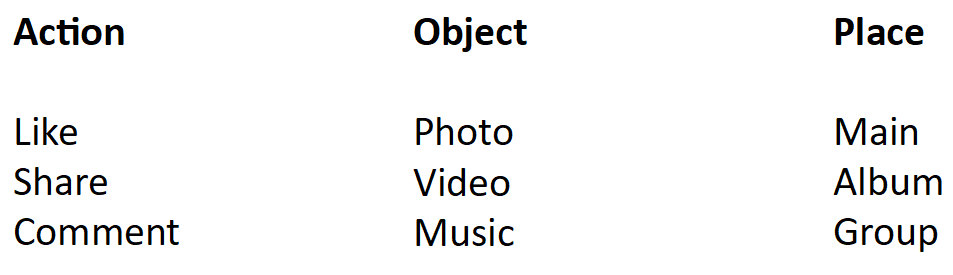
The first is the action: liked, shared, commented. The second part is the object: photo, video, music. The third part - a place: on the main, in the album, in the group. Then the query will go in just one dictionary - an action in which there are only three meanings and three bitmaps. For the purity of the experiment, let us assume that this is also a regular expression. That is, in this case there will be three regular expressions, and in the previous one there were 27. Bitmapov was 9, now there is one. As a result, we reduced the passage through the dictionary and the integration of bitmaps (which takes 95% of the time) 9 times. And we are just a dictionary of 27 lines cut into three.
In reality, we had 14 thousand combinations. , 14 . 14 . . , , 10 , . .
, 2 . 11 , 74 . , . 74 ? , .
Druid . , , , . , , . , , . , , .
, Druid . , ( ) , . 5 : , . . ( java), . Druid , .
Total
, , SQL Server, Microsoft.
, / .
, , .
20 , , 18 .
one-cloud ( https://habr.com/company/odnoklassniki/blog/346868/ ), .
Source: https://habr.com/ru/post/420469/
All Articles