How to prevent memory overruns when using Java collections
Hello!
Our experiment with steps in the Java Developer course continues and, oddly enough, even quite successfully (sort of): as it turned out, planning a couple of months with the next transition to a new level at any convenient time is much more convenient than if allocate almost six months to such a complex course. So there is a suspicion that it is precisely difficult courses that we will soon begin to gradually transfer to such a system.
But this is me about our, about Otusovskom, sorry. As always, we continue to explore interesting topics that, although not touched upon in our program, but which are discussed with us - therefore, to one of the questions that our teachers asked, we prepared a translation of the most interesting article in our opinion.
')
Go!

Collections in the JDK are standard library implementations of lists and maps. If you look at a snapshot of the memory of a typical large application written in Java, you will see thousands or even millions of copies of
First, it must be noted that the internal collections of the JDK are not some kind of magic. They are written in Java. Their source code comes with the JDK, so you can open it in your IDE. Their code can also be easily found on the Internet. And, as it turns out, most collections are not very elegant in terms of optimizing the amount of memory consumed.
Consider, for example, one of the simplest and most popular collections — the
When you create an
How much memory is wasted here? In absolute values, it is calculated as (object pointer size). If you are using a JVM HotSpot (which comes with the Oracle JDK), the pointer size will depend on the maximum heap size (for more information, see https://blog.codecentric.de/ru/2014/02/35gb-heap-less- 32gb-java-jvm-memory-oddities / ). Usually, if you specify
In fact, an empty
Consider another common collection - the

As you can see, a
If you find unused or underused collections in your application, how do you fix them? Below are some common recipes. Here it is assumed that our problem collection is the
If most instances of the list are never used, try initializing it lazily. So the code that previously looked like ...
... must be converted to something like
Keep in mind that sometimes you will need to take extra steps to resolve possible contests. For example, if you support
If most instances of your list or map contain only a few elements, try initializing them with a more suitable initial capacity, for example.
If your collections are empty or contain only one element (or a key-value pair) in most cases, you can consider one extreme form of optimization. It only works if the collection is fully managed within the current class, that is, other code cannot access it directly. The idea is that you change the type of your data field, for example, from List to a more general Object, so that it can either point to a real list or directly to a single list item. Here is a brief sketch:
Obviously, code with this optimization is less clear and harder to maintain. But this can be useful if you are sure that in this way you will save a lot of memory or get rid of the long pauses of the garbage collector.
You are probably already thinking: how do I find out which collections in my application memory overrun and how much?
In short: it's hard to find out without the right tools. Attempting to guess the amount of memory used or spent by data structures in a large complex application almost never leads to anything. And, not knowing exactly where the memory goes, you can spend a lot of time chasing the wrong goals, while your application stubbornly continues to fall with
For this, you should check out a bunch of applications with a special tool. By experience, the best way to analyze a JVM memory (measured as the amount of available information versus the impact of this tool on application performance) is to dump the heap, and then view it offline. A heap dump is essentially a complete snapshot of the heap. You can get it at any time by calling the jmap utility, or you can configure the JVM to automatically create a dump if the application crashes with an
A heap dump is a binary file the size of a JVM heap, so it can only be read and analyzed using special tools. There are several such tools, both open source and commercial. The most popular open source tool is the Eclipse MAT; There are also VisualVM and some less powerful and less well-known tools. Commercial tools include Java general purpose profilers: JProfiler and YourKit, as well as one tool designed specifically for heap dump analysis - JXRay (a disclaimer: the last one was developed by the author).
Unlike other tools, JXRay immediately analyzes the heap dump for a large number of common problems, such as duplicate lines and other objects, as well as insufficiently efficient data structures. Problems with the above collections fall into the latter category. The tool generates a report with all the information gathered in HTML format. The advantage of this approach is that you can view the analysis results anywhere at any time and easily share them with others. You can also run the tool on any machine, including large and powerful, but “headless” machines in the data center.
JXRay calculates the overhead (how much memory you save if you get rid of a specific problem) in bytes and as a percentage of the heap used. It combines collections of the same class, which have the same problem ...

... and then groups problem collections that are accessed from some root of the garbage collector through the same link chain, as in the example below.

Knowing which reference chains and / or individual data fields (for example,
Thus, inadequately configured Java collections can waste a lot of memory. In many situations, this problem is easy to solve, but sometimes you may need to change your code in non-trivial ways to achieve a significant improvement. It is very difficult to guess which collections need to be optimized in order to have the greatest impact. In order not to waste time on optimizing the wrong parts of the code, you need to get a dump of the JVM heap and analyze it using the appropriate tool.
THE END
We are, as always, interested in your opinions and questions, which you can leave here or drop by for an open lesson and ask our teachers there.
Our experiment with steps in the Java Developer course continues and, oddly enough, even quite successfully (sort of): as it turned out, planning a couple of months with the next transition to a new level at any convenient time is much more convenient than if allocate almost six months to such a complex course. So there is a suspicion that it is precisely difficult courses that we will soon begin to gradually transfer to such a system.
But this is me about our, about Otusovskom, sorry. As always, we continue to explore interesting topics that, although not touched upon in our program, but which are discussed with us - therefore, to one of the questions that our teachers asked, we prepared a translation of the most interesting article in our opinion.
')
Go!
Collections in the JDK are standard library implementations of lists and maps. If you look at a snapshot of the memory of a typical large application written in Java, you will see thousands or even millions of copies of
java.util.ArrayList , java.util.HashMap , etc. Collections are indispensable for storing and manipulating data. But have you ever thought about whether all the collections in your application make optimal use of memory? In other words, if your application crashes with the shameful OutOfMemoryError or causes a long pause for the garbage collector, have you ever checked your collections for leaks.First, it must be noted that the internal collections of the JDK are not some kind of magic. They are written in Java. Their source code comes with the JDK, so you can open it in your IDE. Their code can also be easily found on the Internet. And, as it turns out, most collections are not very elegant in terms of optimizing the amount of memory consumed.
Consider, for example, one of the simplest and most popular collections — the
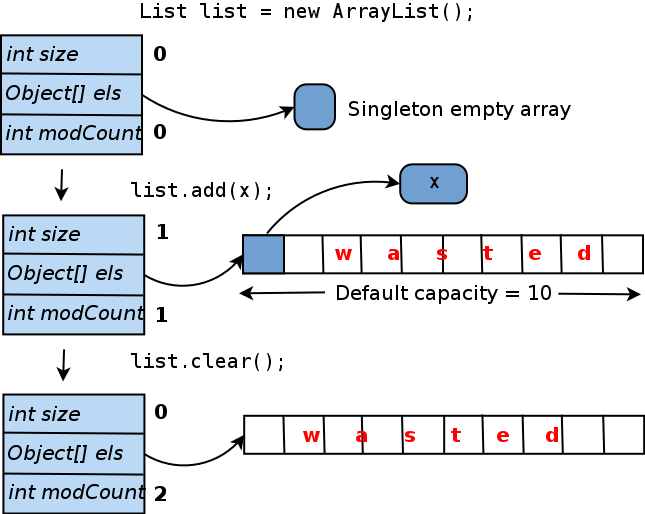
java.util.ArrayList class. Inside each ArrayList operates with an array of Object[] elementData . This is where the list items are stored. Let's see how this array is processed.When you create an
ArrayList constructor by default, that is, call new ArrayList() , elementData points to a generic array of size zero ( elementData can also be set to null , but the array provides some minor implementation benefits). When you add the first element to the list, a real unique elementData array is elementData and the provided object is inserted into it. In order to avoid resizing the array every time you add a new element, it is created with a length of 10 (“default capacity”). So it turns out: if you no longer add elements to this ArrayList , 9 out of 10 slots in the elementData array will remain empty. And even if you clear the list, the size of the internal array will not be reduced. Below is a diagram of this life cycle:How much memory is wasted here? In absolute values, it is calculated as (object pointer size). If you are using a JVM HotSpot (which comes with the Oracle JDK), the pointer size will depend on the maximum heap size (for more information, see https://blog.codecentric.de/ru/2014/02/35gb-heap-less- 32gb-java-jvm-memory-oddities / ). Usually, if you specify
-Xmx less than 32 gigabytes, the pointer will be 4 bytes in size; for large heaps - 8 bytes. Thus, an ArrayList , initialized by the default constructor, with the addition of only one element, wastes either 36 or 72 bytes.In fact, an empty
ArrayList also wastes memory, since it does not carry any workload, but the size of the ArrayList object itself is not zero and larger than you probably think. This is because, on the one hand, each object managed by the HotSpot JVM has a 12- or 16-byte header that is used by the JVM for internal purposes. Further, most collection objects contain a size field, a pointer to an internal array or another “workload carrier” object, a modCount field to track content changes, etc. Thus, even the smallest possible object representing an empty collection will probably need at least 32 bytes of memory. Some, like ConcurrentHashMap , take up much more.Consider another common collection - the
java.util.HashMap class. Its life cycle is similar to the ArrayList life cycle:As you can see, a
HashMap containing only one key-value pair spends 15 internal array cells, which corresponds to 60 or 120 bytes. These numbers are small, but the scale of memory loss for all collections in your application is important. And it turns out that some applications can spend a lot of memory in this way. For example, some of the popular open source Hadoop components that the author has analyzed lose about 20 percent of their heap in some cases! For products developed by less experienced engineers and not subjected to regular performance analysis, memory loss may be even higher. There are enough cases when, for example, 90% of the nodes in a huge tree contain only one or two descendants (or nothing at all), and other situations where the heap is filled with 0-, 1- or 2-element collections.If you find unused or underused collections in your application, how do you fix them? Below are some common recipes. Here it is assumed that our problem collection is the
ArrayList referenced by the data field Foo.list .If most instances of the list are never used, try initializing it lazily. So the code that previously looked like ...
void addToList(Object x) { list.add(x); } ... must be converted to something like
void addToList(Object x) { getOrCreateList().add(x); } private list getOrCreateList() { // , if (list == null) list = new ArrayList(); return list; } Keep in mind that sometimes you will need to take extra steps to resolve possible contests. For example, if you support
ConcurrentHashMap , which can be updated by several threads simultaneously, the code that initializes it is deferred, should not allow two threads to create two copies of this map randomly: private Map getOrCreateMap() { if (map == null) { //, synchronized (this) { if (map == null) map = new ConcurrentHashMap(); } } return map; } If most instances of your list or map contain only a few elements, try initializing them with a more suitable initial capacity, for example.
list = new ArrayList(4); // 4 If your collections are empty or contain only one element (or a key-value pair) in most cases, you can consider one extreme form of optimization. It only works if the collection is fully managed within the current class, that is, other code cannot access it directly. The idea is that you change the type of your data field, for example, from List to a more general Object, so that it can either point to a real list or directly to a single list item. Here is a brief sketch:
// *** *** private List<Foo> list = new ArrayList<>(); void addToList(Foo foo) { list.add(foo); } // *** *** // , null. , // . // ArrayList. private Object listOrSingleEl; void addToList(Foo foo) { if (listOrSingleEl == null) { // listOrSingleEl = foo; } else if (listOrSingleEl instanceof Foo) { // Foo firstEl = (Foo) listOrSingleEl; ArrayList<Foo> list = new ArrayList<>(); listOrSingleEl = list; list.add(firstEl); list.add(foo); } else { // ((ArrayList<Foo>) listOrSingleEl).add(foo); } } Obviously, code with this optimization is less clear and harder to maintain. But this can be useful if you are sure that in this way you will save a lot of memory or get rid of the long pauses of the garbage collector.
You are probably already thinking: how do I find out which collections in my application memory overrun and how much?
In short: it's hard to find out without the right tools. Attempting to guess the amount of memory used or spent by data structures in a large complex application almost never leads to anything. And, not knowing exactly where the memory goes, you can spend a lot of time chasing the wrong goals, while your application stubbornly continues to fall with
OutOfMemoryError .For this, you should check out a bunch of applications with a special tool. By experience, the best way to analyze a JVM memory (measured as the amount of available information versus the impact of this tool on application performance) is to dump the heap, and then view it offline. A heap dump is essentially a complete snapshot of the heap. You can get it at any time by calling the jmap utility, or you can configure the JVM to automatically create a dump if the application crashes with an
OutOfMemoryError . If you google the JVM heap dump, you will immediately see a large number of articles explaining in detail how to get the dump.A heap dump is a binary file the size of a JVM heap, so it can only be read and analyzed using special tools. There are several such tools, both open source and commercial. The most popular open source tool is the Eclipse MAT; There are also VisualVM and some less powerful and less well-known tools. Commercial tools include Java general purpose profilers: JProfiler and YourKit, as well as one tool designed specifically for heap dump analysis - JXRay (a disclaimer: the last one was developed by the author).
Unlike other tools, JXRay immediately analyzes the heap dump for a large number of common problems, such as duplicate lines and other objects, as well as insufficiently efficient data structures. Problems with the above collections fall into the latter category. The tool generates a report with all the information gathered in HTML format. The advantage of this approach is that you can view the analysis results anywhere at any time and easily share them with others. You can also run the tool on any machine, including large and powerful, but “headless” machines in the data center.
JXRay calculates the overhead (how much memory you save if you get rid of a specific problem) in bytes and as a percentage of the heap used. It combines collections of the same class, which have the same problem ...
... and then groups problem collections that are accessed from some root of the garbage collector through the same link chain, as in the example below.
Knowing which reference chains and / or individual data fields (for example,
INodeDirectory.children above) indicate collections that spend most of the memory allows you to quickly and accurately identify the code that is responsible for the problem, and then make the necessary changes.Thus, inadequately configured Java collections can waste a lot of memory. In many situations, this problem is easy to solve, but sometimes you may need to change your code in non-trivial ways to achieve a significant improvement. It is very difficult to guess which collections need to be optimized in order to have the greatest impact. In order not to waste time on optimizing the wrong parts of the code, you need to get a dump of the JVM heap and analyze it using the appropriate tool.
THE END
We are, as always, interested in your opinions and questions, which you can leave here or drop by for an open lesson and ask our teachers there.
Source: https://habr.com/ru/post/420245/
All Articles