JavaScript price in 2018
The process of working with users on interactive websites may include the step of sending them JavaScript code. Often - too much of such a code. If a lot of javascript is used on the site, this is especially true for mobile users. For example, did you happen to visit mobile web pages that seem to look like they are ready to work, but do not react to clicks on links or attempts to scroll the page?

JavaScript code that goes into mobile browsers is still the most expensive resource, as it can, in many ways, delay the transition of pages to a state in which you can interact with them. What is the load on the system creates javascript today? How to analyze sites? How to speed up browser loading and processing of interactive web pages? Eddie Osmani, whose translation of the material we are publishing today, decided to find answers to these and many other questions that confront those who use JavaScript to develop websites in 2018.
Take a look at this report, which shows the time it takes to process the javascript code of the CNN site with various devices. It is based on measurements made by the WebPageTest.org project ( here is a table with the source data for this report, there is more data on the Walmart site).
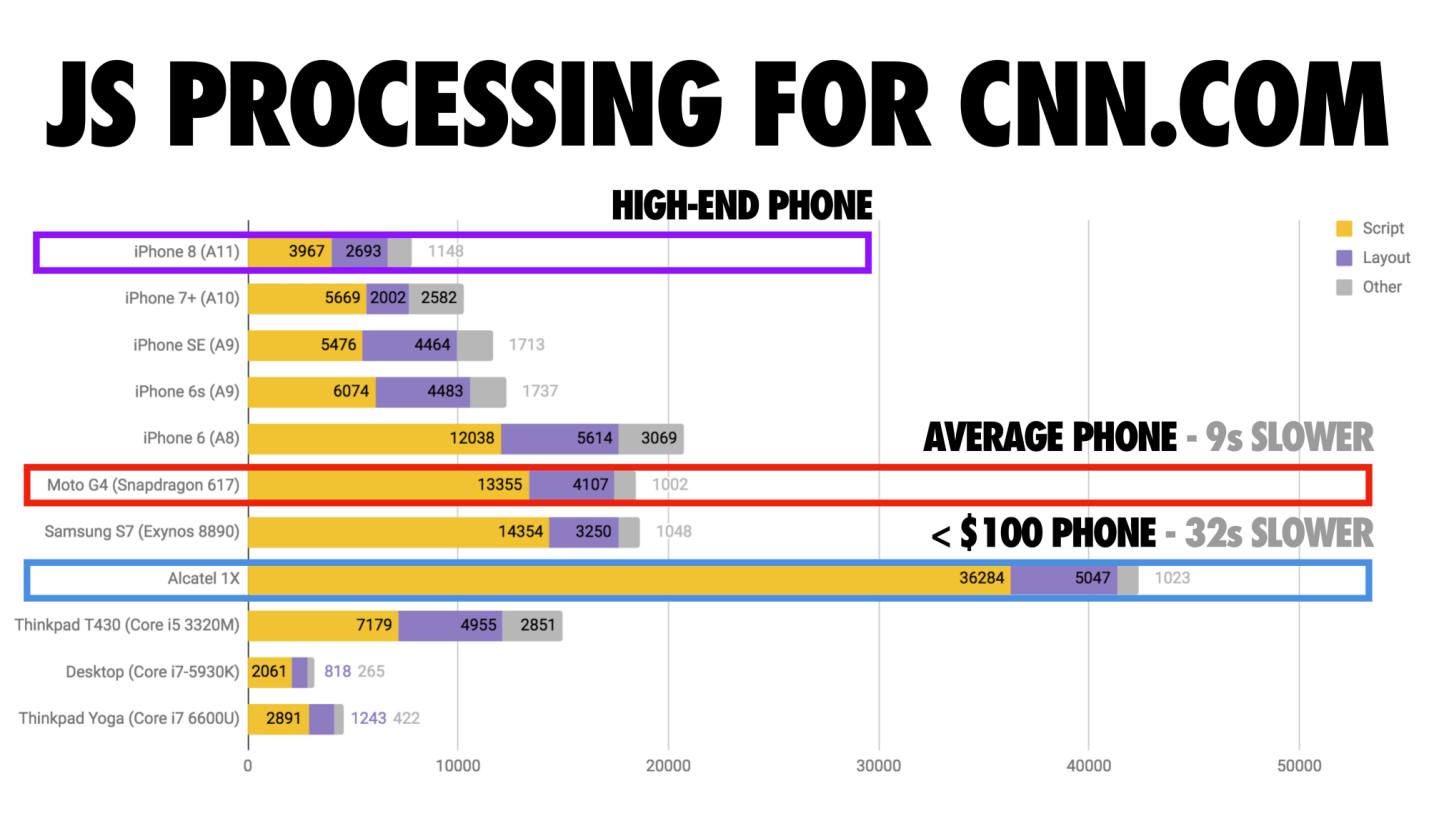
The time required to process the js code of the cnn.com site by various devices
')
As you can see, the top class phone (iPhone 8) handles the task of processing the JS code in about 4 seconds. A mid-level phone (Moto G4) needs approximately 13 seconds to solve the same problem. A budget, albeit a modern device, such as the Alcatel 1X, takes about 36 seconds.
Today we will talk about the strategies that web developers can use to create, on the one hand, convenient and modern websites, and on the other hand, to ensure efficient loading, processing and functioning of the JavaScript component of these sites. Here, in brief, are the highlights of our conversation, which, by the way, is based on my recent speech :
When a user accesses your site, you probably send him a whole bunch of files, many of which are scripts. From the point of view of a web browser, it looks like this.

This is how the browser feels, which is flooded with files.
No matter how much I love JavaScript, I cannot but recognize the fact that it always represents the most expensive, most difficult part of the site to handle by browsers. Actually, I would like to talk about why JavaScript can be the main problem of the site.

JavaScript is the hardest part of the site
According to the July HTTP Archive report on the use of JavaScript, the average web page today uses about 350 KB of minified and compressed JavaScript code. This code is unpacked into something like a 1 MB script that needs to be processed by the browser. In order for a mobile user to interact with such a page, he will have to wait more than 14 seconds .

The average page containing 350 KB of compressed JS code becomes interactive on the mobile device in about 15 seconds.
If you don’t know exactly how your JavaScript bundles influence how long users have to wait until they can interact with your site, take a look at the Lighthouse tool.
Download time data on mobile networks and their processing on the processor is not the fastest make a significant contribution while waiting for the preparation of the page to work on mobile devices.
Let us analyze the state of affairs in the field of mobile networks, looking at the data of OpenSignal . The following figure, on the left, shows the availability of 4G networks in the world (the darker the color of the country is painted over - the higher the availability), the data rates shown on the right (again - the darker the higher the speed). Countries whose territory is grayed out are not included in the study. It is worth noting that in rural areas, even in the USA, the speed of mobile data transfer can be 20% slower than in cities.

4G network availability and data transfer rate
Above, we said that it takes some time to load and parse 350 KB of minified and compressed JS code. However, if you look at popular sites, it turns out that they send users a lot more code. The data shown in the figure below are taken from here . They represent the size of the unpacked JavaScript bundles of various well-known web resources, such as Google Sheets, which unpacked JS-code on desktop platforms is 5.8 MB.
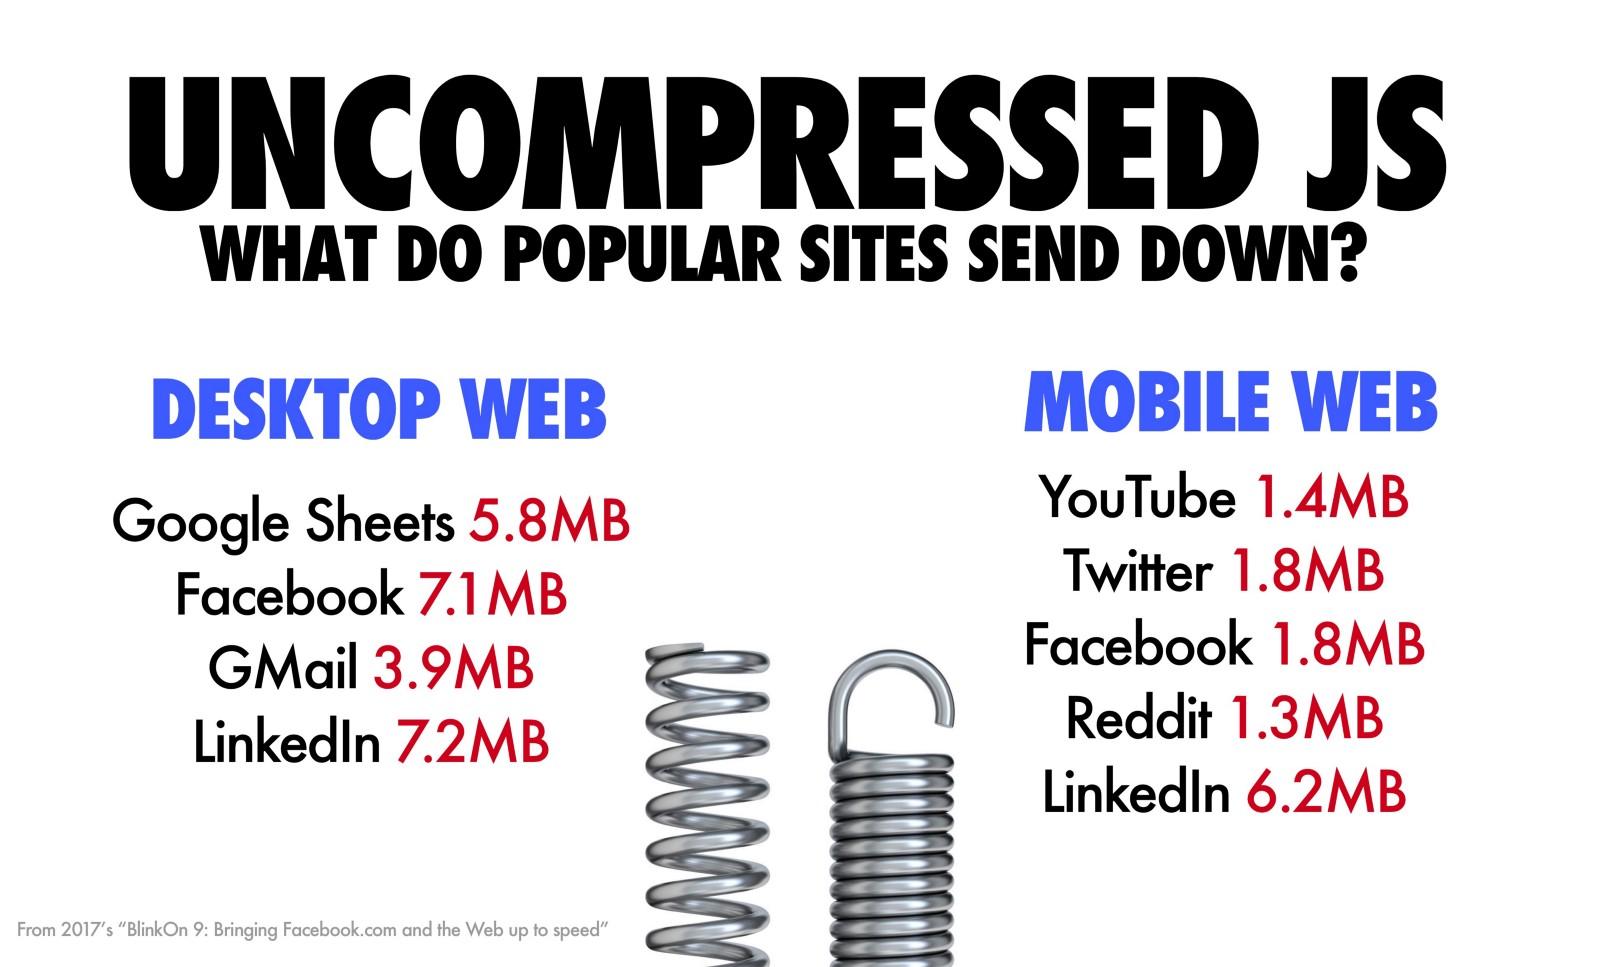
Unpacked JavaScript builds for various resources
As you can see, on both desktop and mobile platforms, browsers, to work with different sites, sometimes you have to handle several megabytes of JS code. The main question here is - can you afford to use such large amounts of javascript?
According to Alex Russell, sites that require very large amounts of JavaScript to work are simply inaccessible to large groups of users. According to statistics, users do not wait (and will not wait) to download such resources.

Can you afford it?
If you have to send too large amounts of JS code to users, consider using the code separation technology to split bundles into small parts, or to reduce the amount of code using the tree-shaking algorithm .
The composition of JS-bandl modern sites often include the following:
Everything listed above contributes to the total size of the code that needs to be received and processed by the user's browser. Naturally, the more code - the more time it takes for the browser to bring the page to working condition.
The process of loading a web page is similar to a film in a projector, which shows three key steps that answer the following questions:
Here's how to imagine these steps, which, in turn, can be broken down into smaller “frames”, if we continue the analogy with film.
Loading a page is a process. Recently, the focus of the web industry has shifted to indicators that reflect the user experience of working with web pages. Instead of giving all the attention to the

Webpage loading process
Above, we mentioned such an indicator as the time to interactivity (Time to interactive, TTI). Let's talk about it in more detail. Below, in the animated picture that Kevin Schaaf prepared, you can see how a page, not all materials of which are loaded and processed, makes the user think that he can perform some action, but, in fact, due to the fact that the corresponding JS the code is not yet fully processed, this action cannot be performed.
Users are frustrated by pages that take too long to get ready for work.
In order for the page to be interactive, it must be able to respond quickly to user input. The small amounts of JS code that power the pages help to reduce the time needed to prepare the pages for use.
If a user clicks a link or scrolls a page, he needs to see that, in response to his actions, something happens. If the page does not respond to user exposure, they do not like it.
Here is a report generated in the test environment by means of the Lighthouse, containing a set of indicators (here there is also Time to interactive), focused on how the page is perceived by users.
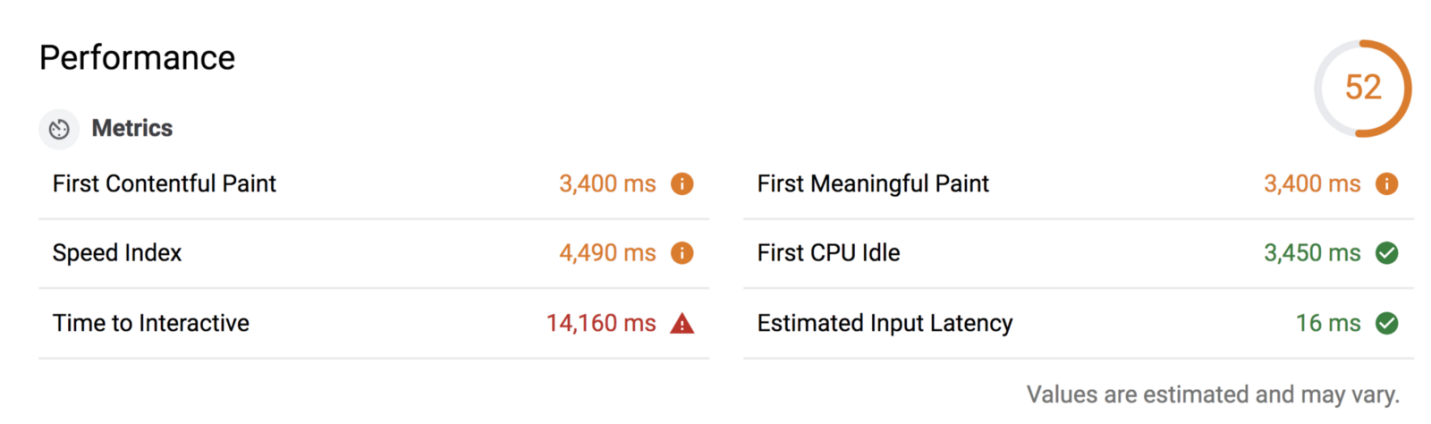
Lighthouse report, which includes indicators reflecting the perception of the page by the user
Something similar to what is shown in the previous figure occurs when a server rendering is used in a certain project, and the results of what is generated on the server and the JS code used for animating the user interface are transmitted to the client (for example, , can connect event handlers and some additional mechanisms responsible for page behavior).
When the browser handles such code, the connecting events that the user probably needs, most likely, all this will be executed in the same thread that handles user input. This is the so-called mainstream.
Loading too much JavaScript code with the main thread (for example, this happens when using the
Here is a video showing an example of how a user works with a failed site. Usually, the user can safely check the boxes or click on the links. However, if you simulate the blocking of the main thread, the user will not be able to do anything - neither select the check box nor click on the link.
Try to minimize situations in which the main thread can be blocked. Here is the material in which you can find details about it.
We see how the teams we work with suffer from the fact that JavaScript affects TTI on many types of sites.

JavaScript is able to delay the appearance of visible elements in the interactive mode.
This situation can be a serious problem for many companies. The above is a few examples from a Google search engine. Elements appear on the screen, they look as if you can already work with them, but if too large amounts of JS code are responsible for their operation, they come out with a certain delay in the working mode. Users may not like this. Ideally, it is necessary that everything that a user can interact with comes to a working state as quickly as possible.
Here are the TTI indicators for news.google.com when using a slow 3G internet connection. Here you can see the data on which this chart is based. Measurements are made by means of WebPageTest and Lighthouse.

TTI for news.google.com
After analyzing this data, you can see that there is a serious gap between the devices of the lowest and highest categories. So, the most powerful device in the TTI test is about 7 seconds. At the simplest - it is already 55 seconds.
Here we have a question about what should be the TTI indicator. We believe that it is worth striving to ensure that the pages become interactive on middle-class devices connected to slow 3G networks in less than 5 seconds.

It is worth striving for TTI in 5 seconds
Perhaps, here you will say that all your users have top phones and are connected to fast networks. However, is this really the case? Perhaps someone is connected to the “fast” Wi-Fi-network in some cafe, but, in fact, only the speed typical for 2G or 3G connections is available to him. Assessing the capabilities of users can not be discounted the variety of devices and methods of access to the network used by them.
Here are some examples of how reducing the size of page JS-code has affected TTI.
These results suggest that sites should be designed for a flexible mobile environment, while at the same time trying to ensure that they are not tied to large amounts of JavaScript code.

Designing websites is based on a flexible mobile environment.
TTI is affected by a lot of things. For example, this indicator may be affected by the use of a mobile device to view the site, whose network capabilities are limited by a certain tariff plan, TTI may be affected by the fact that the user is working through a public, not particularly fast, Wi-Fi access point, or that the mobile user is in constant motion, occasionally losing the network.
When someone who is in a situation similar to the ones we just described is working with your site, and at the same time, a large amount of JS code is required to load and process a resource, the site interaction session may end in an empty user. screen. Or, if the site does display at least something, you may have to wait a very long time before you can work with it. Such problems, ideally, can be mitigated by simply reducing the size of the JS-code required for the operation of sites.
In order to understand why preparing JavaScript code for pages to work can create a huge load on the system, let's talk about what happens when the server sends data to the browser.
So, it all starts with the fact that the user enters into the address bar of the browser URL of the site on which he wants to go.

It all starts with entering the URL into the address bar of the browser
The request is then sent to the server, which returns HTML markup to the browser. The browser parses this markup and finds the resources needed to form the page: CSS, JavaScript, images. Then the browser needs to request all this from the server and process it.
According to this scenario, everything happens, for example, when working with Google Chrome.
The difficulty in all this process is that JavaScript, as a result, turns out to be a bottleneck of the whole system. Ideally, we would like the browser to quickly display a graphical representation of the page, after which it would be possible to interact with it. But, if JavaScript is a bottleneck, then, after displaying something on the screen, the user is forced to helplessly look at something with which he cannot work.
Our task is to make JavaScript cease to be a bottleneck in modern scenarios of user interaction with web resources.
The task of accelerating JavaScript can be divided into several subtasks. The time spent on everything related to JS is made up of load time, parsing, compilation, and code execution.

JavaScript speed is made up of download speed, parsing, compilation and code execution.
All this means that we need speed both when transmitting the code and when processing it.
If too much time is spent on parsing and compiling the script in the JS engine, this affects how soon the user can interact with the page.
Consider some of the data on the above processes. Here’s some details on what V8 , the JavaScript engine used in Chrome, is wasting time processing pages containing scripts.

The steps of parsing and compiling code take 10-30% of time in V8 when the page loads
Orange highlighted fragments that represent the time required for parsing the code of popular sites. Yellow is the compile time. Together, these two stages take about 30% of the total time required to process the JS code of the page. 30% is a serious figure.
In Chrome 66, the V8 compiles code in a background thread, which can save up to 20% of compile time. However, parsing and compiling are still extremely expensive operations, so rarely can you see a large script that starts in less than 50 ms. after loading, even if it is compiled in a background thread.
It should be borne in mind that the time required, for example, to process a script of 200 Kb in size, and to process an image that has the same size, is seriously different. In this example, the amount of data transmitted over the network may be the same, the time to transfer them too. This cannot be said about the cost of resources necessary to transform the data into something with which to work.

200 KB of JavaScript code and a JPEG file of the same size are different things.
The JPEG image needs to be decoded, rasterized and displayed on the screen. A JS-bandl is necessary, if we consider it simplistic, download, parse, compile, run. JS-. , , JavaScript-, , , , .
, JavaScript- , .
. , , , , 30$, , 200$, , 1000$.

, . .
, . , , , , . , , , .
. , , , . , , , , JavaScript, , . , , .
Android-, newzoo . , Android 75,9% , , 2018 300 . .

Android- 2018
, JavaScript . .

, ( ) 1 JS- (, , 200 , gzip). , .
, iPhone 8, . , , Moto G4, Alcatel 1X. .
, Android, , . L2/L3 . , , , .
, . WebPageTest, .

, JS- cnn.com
iPhone 8 ( A11 ) 9 , . , iPhone 8 9 .
, , WebPageTest Alcatel 1X ( 100$, ), « » cnn.com . Alcatel 1X 3G- 65 . «». .

cnn.com Alcatel 1X, Moto G gen 1, Moto G4
, , , , . . , — .

,
, — , . . . , .
, - , «», «» . , , , , , .

,
— WebPageTest Moto G4 . .
, , . , , : . , — .

, , 2G-. , — .
, , Google Analytics → Audience → Mobile → Devices. .

Google Analytics
, . — , , , , .
JavaScript — . : , , ( gzip , Brotli , Zopfli ).

,
.
JavaScript — .

—
-, , , , .
, , JavaScript, , , , .
, JS-, , , . , — ( code splitting ).
, JS- , , , . , .

—
, , , JS-, . , .
webpack Parcel . React , Vue.js Angular .
React- React loadable — , API, React, .
.
.
.

Twitter 45% , Tinder — 50%
Twitter Tinder , , , . , , , TTI 50%.
Gatsby.js (React), Preact CLI PWA Starter Kit , .
, , . JavaScript-. ,

JS-
, JS- , Webpack Bundle Analyzer , Source Map Explorer Bundle Buddy . .
, JS-: , , , , , .
( ).

( Moment.js ) (, date-fns ).
Webpack, , , , , .
, JavaScript, Lighthouse .

Lighthouse
Lighthouse , , , , .
Lighthouse — , Google. Chrome. , . , Lighthouse.

Lighthouse
Lighthouse JavaScript boot-up time . , , , , . , , , .
, , , .

CSS JS- Coverage Chrome
Coverage CSS JavaScript-. , . , .
, Coverage. , .
Coverage , , , , .
- , JS- , PRPL (Push, Render, Precache, Lazy-load).
. - JS- , , , , .
PRPL . (Push), (Render), , (Pre-cache), , , (Lazy-load) , .

PRPL
PRPL, , , , , . , , .
, - - , , , , , , , - - , .

, , -
, , . .

—
, , . , , .
, , , . , . , , .
, :
, . , :
, , , .

— ,
, .
. , , , «», , -. , , , - , . , , . , .
, - , -. , .

, -
.
Web Performance Warrior Designing for Web Performance — , , .
. Lighthouse CI .
, , - , , , . , , Lighthouse Thresholds .

. Calibre , Treo , Webdash SpeedCurve .
teejungle.net SpeedCurve, .

SpeedCurve
, , , , .
, US Digital Service , LightHouse TTI.
, , , , .
, JavaScript RUM- (Real User Monitoring, ), , -, . , RUM-, , , . , JavaScript-, , API Long Tasks First Input Delay.

RUM-
, JavaScript, .
, USA Today . 42 .

USA Today
, JS- . , , , , . , , .
. ,
, , .
— , . .

- —
- , .
- , JS-. , , , , , , .
Dear readers! , -?

JavaScript code that goes into mobile browsers is still the most expensive resource, as it can, in many ways, delay the transition of pages to a state in which you can interact with them. What is the load on the system creates javascript today? How to analyze sites? How to speed up browser loading and processing of interactive web pages? Eddie Osmani, whose translation of the material we are publishing today, decided to find answers to these and many other questions that confront those who use JavaScript to develop websites in 2018.
General provisions
Take a look at this report, which shows the time it takes to process the javascript code of the CNN site with various devices. It is based on measurements made by the WebPageTest.org project ( here is a table with the source data for this report, there is more data on the Walmart site).
The time required to process the js code of the cnn.com site by various devices
')
As you can see, the top class phone (iPhone 8) handles the task of processing the JS code in about 4 seconds. A mid-level phone (Moto G4) needs approximately 13 seconds to solve the same problem. A budget, albeit a modern device, such as the Alcatel 1X, takes about 36 seconds.
Today we will talk about the strategies that web developers can use to create, on the one hand, convenient and modern websites, and on the other hand, to ensure efficient loading, processing and functioning of the JavaScript component of these sites. Here, in brief, are the highlights of our conversation, which, by the way, is based on my recent speech :
- In order for web projects to work quickly, you only need to download the JavaScript code required for the current page. The use of code splitting technology allows you to organize as quickly as possible the load of what the user needs, and apply the lazy load technique for other code fragments. With this approach, the page gets a chance faster than in other cases, to load, and quickly reach a state where it will be possible to interact with it. If you use systems in which, by default, code separation based on routes is applied, this changes the situation for the better.
- Adhere to the limitations established in relation to the parameters of the project, the so-called "performance budget» (performance budget), and learn to comply with them. For example, count on the fact that the size of the minified and compressed JS code required for pages intended for mobile devices should not exceed 170 KB . When converting such materials to the usual form is obtained about 700 KB of code. Such restrictions are of great importance for the success of the project, however, they alone cannot miraculously make a slow site fast. Here they play the role of command culture , structure and means of control over the execution of rules. Development of a project without a budget contributes to a gradual decrease in productivity and can lead to unpleasant consequences.
- Learn how to audit JavaScript bundles (assemblies) and reduce their size. It is very likely that customers have to download full versions of libraries , while only parts of the project are needed for the project to work. Perhaps the project includes polyfills for browsers that they do not need; code duplication is also possible.
- Each user interaction with the site is the beginning of a new waiting period, after which it will be possible to work with the site (this is what is called “time to interactivity”, TTI, Time to Interactive). Optimization is worth considering in this context. The size of the transmitted code is very important for slow mobile networks, and the time required to parse the JavaScript code is for devices with modest computing capabilities.
- If using client-side JavaScript does not lead to an improvement in user experience, consider whether JS should be used in this situation. Perhaps in such a case it would be faster to render the HTML code on the server. Think about limiting the use of client web frameworks, about using them only to create pages that absolutely can not do without. Both rendering on the server and rendering on the client, if these technologies are used incorrectly, turn into a source of serious problems.
Modern web projects and the problem of excessive use of JavaScript
When a user accesses your site, you probably send him a whole bunch of files, many of which are scripts. From the point of view of a web browser, it looks like this.
This is how the browser feels, which is flooded with files.
No matter how much I love JavaScript, I cannot but recognize the fact that it always represents the most expensive, most difficult part of the site to handle by browsers. Actually, I would like to talk about why JavaScript can be the main problem of the site.
JavaScript is the hardest part of the site
According to the July HTTP Archive report on the use of JavaScript, the average web page today uses about 350 KB of minified and compressed JavaScript code. This code is unpacked into something like a 1 MB script that needs to be processed by the browser. In order for a mobile user to interact with such a page, he will have to wait more than 14 seconds .
The average page containing 350 KB of compressed JS code becomes interactive on the mobile device in about 15 seconds.
If you don’t know exactly how your JavaScript bundles influence how long users have to wait until they can interact with your site, take a look at the Lighthouse tool.
Download time data on mobile networks and their processing on the processor is not the fastest make a significant contribution while waiting for the preparation of the page to work on mobile devices.
Let us analyze the state of affairs in the field of mobile networks, looking at the data of OpenSignal . The following figure, on the left, shows the availability of 4G networks in the world (the darker the color of the country is painted over - the higher the availability), the data rates shown on the right (again - the darker the higher the speed). Countries whose territory is grayed out are not included in the study. It is worth noting that in rural areas, even in the USA, the speed of mobile data transfer can be 20% slower than in cities.
4G network availability and data transfer rate
Above, we said that it takes some time to load and parse 350 KB of minified and compressed JS code. However, if you look at popular sites, it turns out that they send users a lot more code. The data shown in the figure below are taken from here . They represent the size of the unpacked JavaScript bundles of various well-known web resources, such as Google Sheets, which unpacked JS-code on desktop platforms is 5.8 MB.
Unpacked JavaScript builds for various resources
As you can see, on both desktop and mobile platforms, browsers, to work with different sites, sometimes you have to handle several megabytes of JS code. The main question here is - can you afford to use such large amounts of javascript?
Javascript is not free
According to Alex Russell, sites that require very large amounts of JavaScript to work are simply inaccessible to large groups of users. According to statistics, users do not wait (and will not wait) to download such resources.
Can you afford it?
If you have to send too large amounts of JS code to users, consider using the code separation technology to split bundles into small parts, or to reduce the amount of code using the tree-shaking algorithm .
The composition of JS-bandl modern sites often include the following:
- Client web framework or user interface library.
- A tool for managing application state (for example, Redux).
- Polyfills (often for modern browsers that don't need them).
- Full versions of libraries, and not only those parts that are actually used (for example, the entire Lodash library, the Moment.js library in the version with support for all regional standards).
- A set of user interface components (buttons, headers, sidebars, and so on).
Everything listed above contributes to the total size of the code that needs to be received and processed by the user's browser. Naturally, the more code - the more time it takes for the browser to bring the page to working condition.
The process of loading a web page is similar to a film in a projector, which shows three key steps that answer the following questions:
- It happens? (Is it happening?).
- What is the use of it? (Is it useful?).
- Can I use it? (Is it usable?).
Here's how to imagine these steps, which, in turn, can be broken down into smaller “frames”, if we continue the analogy with film.
Loading a page is a process. Recently, the focus of the web industry has shifted to indicators that reflect the user experience of working with web pages. Instead of giving all the attention to the
onload or domContentLoaded , we now wonder if the user can really work with the page. If he clicks anything on the page, will the immediate reaction follow?Webpage loading process
- In the “Is this happening?” Step, the site may proceed to transmit some data to the browser. Here you can ask questions about whether the user's browser has recorded a call to the server (for example, by clicking on a certain link), and whether the server has started forming a response.
- At the “What is the use of this?” Step, the site displays some text or other content that allows the user, firstly, to learn something useful, and secondly, is able to interest him.
- In the step “Is it possible to use this?” The user can begin full interaction with the site, which can lead to certain events.
Interactive pages and their problems
Above, we mentioned such an indicator as the time to interactivity (Time to interactive, TTI). Let's talk about it in more detail. Below, in the animated picture that Kevin Schaaf prepared, you can see how a page, not all materials of which are loaded and processed, makes the user think that he can perform some action, but, in fact, due to the fact that the corresponding JS the code is not yet fully processed, this action cannot be performed.
Users are frustrated by pages that take too long to get ready for work.
In order for the page to be interactive, it must be able to respond quickly to user input. The small amounts of JS code that power the pages help to reduce the time needed to prepare the pages for use.
If a user clicks a link or scrolls a page, he needs to see that, in response to his actions, something happens. If the page does not respond to user exposure, they do not like it.
Here is a report generated in the test environment by means of the Lighthouse, containing a set of indicators (here there is also Time to interactive), focused on how the page is perceived by users.
Lighthouse report, which includes indicators reflecting the perception of the page by the user
Something similar to what is shown in the previous figure occurs when a server rendering is used in a certain project, and the results of what is generated on the server and the JS code used for animating the user interface are transmitted to the client (for example, , can connect event handlers and some additional mechanisms responsible for page behavior).
When the browser handles such code, the connecting events that the user probably needs, most likely, all this will be executed in the same thread that handles user input. This is the so-called mainstream.
Loading too much JavaScript code with the main thread (for example, this happens when using the
<script> ) has a bad effect on the time before interactivity. Downloading the JS code that you plan to perform in web workers or caching using service workers does not have such a strong negative effect on TTI.Here is a video showing an example of how a user works with a failed site. Usually, the user can safely check the boxes or click on the links. However, if you simulate the blocking of the main thread, the user will not be able to do anything - neither select the check box nor click on the link.
Try to minimize situations in which the main thread can be blocked. Here is the material in which you can find details about it.
We see how the teams we work with suffer from the fact that JavaScript affects TTI on many types of sites.
JavaScript is able to delay the appearance of visible elements in the interactive mode.
This situation can be a serious problem for many companies. The above is a few examples from a Google search engine. Elements appear on the screen, they look as if you can already work with them, but if too large amounts of JS code are responsible for their operation, they come out with a certain delay in the working mode. Users may not like this. Ideally, it is necessary that everything that a user can interact with comes to a working state as quickly as possible.
TTI and mobile devices
Here are the TTI indicators for news.google.com when using a slow 3G internet connection. Here you can see the data on which this chart is based. Measurements are made by means of WebPageTest and Lighthouse.
TTI for news.google.com
After analyzing this data, you can see that there is a serious gap between the devices of the lowest and highest categories. So, the most powerful device in the TTI test is about 7 seconds. At the simplest - it is already 55 seconds.
Here we have a question about what should be the TTI indicator. We believe that it is worth striving to ensure that the pages become interactive on middle-class devices connected to slow 3G networks in less than 5 seconds.
It is worth striving for TTI in 5 seconds
Perhaps, here you will say that all your users have top phones and are connected to fast networks. However, is this really the case? Perhaps someone is connected to the “fast” Wi-Fi-network in some cafe, but, in fact, only the speed typical for 2G or 3G connections is available to him. Assessing the capabilities of users can not be discounted the variety of devices and methods of access to the network used by them.
The effect of reducing the size of the JS-code on TTI
Here are some examples of how reducing the size of page JS-code has affected TTI.
- The project Pinterest has reduced the JS-bundles from 2.5 MB to less than 200 KB. The time to interactivity decreased from 23 seconds to 5.6 seconds. The company's revenue grew by 44%, the number of subscriptions grew by 753%, the number of active weekly users of the mobile version of the site grew by 103%.
- The AutoTrader site reduced the JS-bundle by 56%, which resulted in a decrease in TTI by about 50%.
- Resource Nikkei.com cut the size of the JS-bundle by 43%, which made it possible to improve TTI by 14 seconds.
These results suggest that sites should be designed for a flexible mobile environment, while at the same time trying to ensure that they are not tied to large amounts of JavaScript code.
Designing websites is based on a flexible mobile environment.
TTI is affected by a lot of things. For example, this indicator may be affected by the use of a mobile device to view the site, whose network capabilities are limited by a certain tariff plan, TTI may be affected by the fact that the user is working through a public, not particularly fast, Wi-Fi access point, or that the mobile user is in constant motion, occasionally losing the network.
When someone who is in a situation similar to the ones we just described is working with your site, and at the same time, a large amount of JS code is required to load and process a resource, the site interaction session may end in an empty user. screen. Or, if the site does display at least something, you may have to wait a very long time before you can work with it. Such problems, ideally, can be mitigated by simply reducing the size of the JS-code required for the operation of sites.
Why is javascript so expensive?
In order to understand why preparing JavaScript code for pages to work can create a huge load on the system, let's talk about what happens when the server sends data to the browser.
So, it all starts with the fact that the user enters into the address bar of the browser URL of the site on which he wants to go.
It all starts with entering the URL into the address bar of the browser
The request is then sent to the server, which returns HTML markup to the browser. The browser parses this markup and finds the resources needed to form the page: CSS, JavaScript, images. Then the browser needs to request all this from the server and process it.
According to this scenario, everything happens, for example, when working with Google Chrome.
The difficulty in all this process is that JavaScript, as a result, turns out to be a bottleneck of the whole system. Ideally, we would like the browser to quickly display a graphical representation of the page, after which it would be possible to interact with it. But, if JavaScript is a bottleneck, then, after displaying something on the screen, the user is forced to helplessly look at something with which he cannot work.
Our task is to make JavaScript cease to be a bottleneck in modern scenarios of user interaction with web resources.
How to speed up work with JavaScript?
The task of accelerating JavaScript can be divided into several subtasks. The time spent on everything related to JS is made up of load time, parsing, compilation, and code execution.
JavaScript speed is made up of download speed, parsing, compilation and code execution.
All this means that we need speed both when transmitting the code and when processing it.
If too much time is spent on parsing and compiling the script in the JS engine, this affects how soon the user can interact with the page.
Consider some of the data on the above processes. Here’s some details on what V8 , the JavaScript engine used in Chrome, is wasting time processing pages containing scripts.
The steps of parsing and compiling code take 10-30% of time in V8 when the page loads
Orange highlighted fragments that represent the time required for parsing the code of popular sites. Yellow is the compile time. Together, these two stages take about 30% of the total time required to process the JS code of the page. 30% is a serious figure.
In Chrome 66, the V8 compiles code in a background thread, which can save up to 20% of compile time. However, parsing and compiling are still extremely expensive operations, so rarely can you see a large script that starts in less than 50 ms. after loading, even if it is compiled in a background thread.
How does JavaScript code differ from other resources?
It should be borne in mind that the time required, for example, to process a script of 200 Kb in size, and to process an image that has the same size, is seriously different. In this example, the amount of data transmitted over the network may be the same, the time to transfer them too. This cannot be said about the cost of resources necessary to transform the data into something with which to work.
200 KB of JavaScript code and a JPEG file of the same size are different things.
The JPEG image needs to be decoded, rasterized and displayed on the screen. A JS-bandl is necessary, if we consider it simplistic, download, parse, compile, run. JS-. , , JavaScript-, , , , .
, JavaScript- , .
. , , , , 30$, , 200$, , 1000$.
, . .
, . , , , , . , , , .
. , , , . , , , , JavaScript, , . , , .
Android-, newzoo . , Android 75,9% , , 2018 300 . .
Android- 2018
, JavaScript . .
, ( ) 1 JS- (, , 200 , gzip). , .
, iPhone 8, . , , Moto G4, Alcatel 1X. .
, Android, , . L2/L3 . , , , .
, . WebPageTest, .
, JS- cnn.com
iPhone 8 ( A11 ) 9 , . , iPhone 8 9 .
, , WebPageTest Alcatel 1X ( 100$, ), « » cnn.com . Alcatel 1X 3G- 65 . «». .
cnn.com Alcatel 1X, Moto G gen 1, Moto G4
, , , , . . , — .
,
, — , . . . , .
, - , «», «» . , , , , , .
,
— WebPageTest Moto G4 . .
, , . , , : . , — .
, , 2G-. , — .
, , Google Analytics → Audience → Mobile → Devices. .
Google Analytics
, . — , , , , .
JavaScript — . : , , ( gzip , Brotli , Zopfli ).
,
.
JavaScript — .
—
-, , , , .
, , JavaScript, , , , .
JavaScript-,
, JS-, , , . , — ( code splitting ).
, JS- , , , . , .
—
, , , JS-, . , .
webpack Parcel . React , Vue.js Angular .
React
React- React loadable — , API, React, .
.
import OtherComponent from './OtherComponent'; const MyComponent = () => ( <OtherComponent/> ); .
import Loadable from 'react-loadable'; const LoadableOtherComponent = Loadable({ loader: () => import('./OtherComponent'), loading: () => <div>Loading...</div>, }); const MyComponent = () => ( <LoadableOtherComponent/> ); .
Twitter 45% , Tinder — 50%
Twitter Tinder , , , . , , , TTI 50%.
Gatsby.js (React), Preact CLI PWA Starter Kit , .
, , . JavaScript-. ,
webpack-bundle-analyzer . «» ( , , npm install ), , Visual Code, import-cost .JS-
, JS- , Webpack Bundle Analyzer , Source Map Explorer Bundle Buddy . .
, JS-: , , , , , .
( ).
( Moment.js ) (, date-fns ).
Webpack, , , , , .
,
, JavaScript, Lighthouse .
Lighthouse
Lighthouse , , , , .
Lighthouse — , Google. Chrome. , . , Lighthouse.
Lighthouse
Lighthouse JavaScript boot-up time . , , , , . , , , .
, , , .
CSS JS- Coverage Chrome
Coverage CSS JavaScript-. , . , .
, Coverage. , .
Coverage , , , , .
PRPL
- , JS- , PRPL (Push, Render, Precache, Lazy-load).
. - JS- , , , , .
PRPL . (Push), (Render), , (Pre-cache), , , (Lazy-load) , .
PRPL
PRPL, , , , , . , , .
, - - , , , , , , , - - , .
, , -
, , . .
—
, , . , , .
, , , . , . , , .
, :
- . , , TTI, , . , .
- , -. ( — JavaScript-, HTTP-). .
- , . — , Lighthouse WebPageTest. , .
, . , :
, , , .
— ,
, .
. , , , «», , -. , , , - , . , , . , .
, - , -. , .
, -
.
- , «» . « » , .
- . , , « » , (KPI, Key Performance Indicators) , , . — « 5 ». : « JS- 170 ».
- KPI. , , , .
Web Performance Warrior Designing for Web Performance — , , .
. Lighthouse CI .
, , - , , , . , , Lighthouse Thresholds .
. Calibre , Treo , Webdash SpeedCurve .
teejungle.net SpeedCurve, .
SpeedCurve
, , , , .
, US Digital Service , LightHouse TTI.
, , , , .
, JavaScript RUM- (Real User Monitoring, ), , -, . , RUM-, , , . , JavaScript-, , API Long Tasks First Input Delay.
RUM-
- API Long Tasks ( ), 50 ., . API .
- First Input Delay (FID, ) , (, , ), , . FID — , .
, JavaScript, .
, USA Today . 42 .
USA Today
, JS- . , , , , . , , .
. ,
<head> , A/B-, , , . , , ., , .
Results
— , . .
- —
- , .
- , JS-. , , , , , , .
Dear readers! , -?
Source: https://habr.com/ru/post/419369/
All Articles