Organization of safe testing in production. Part 2
In this part of the article we will continue to consider various types of testing in production. Those who missed the first part can read it here . The rest - welcome under cat.
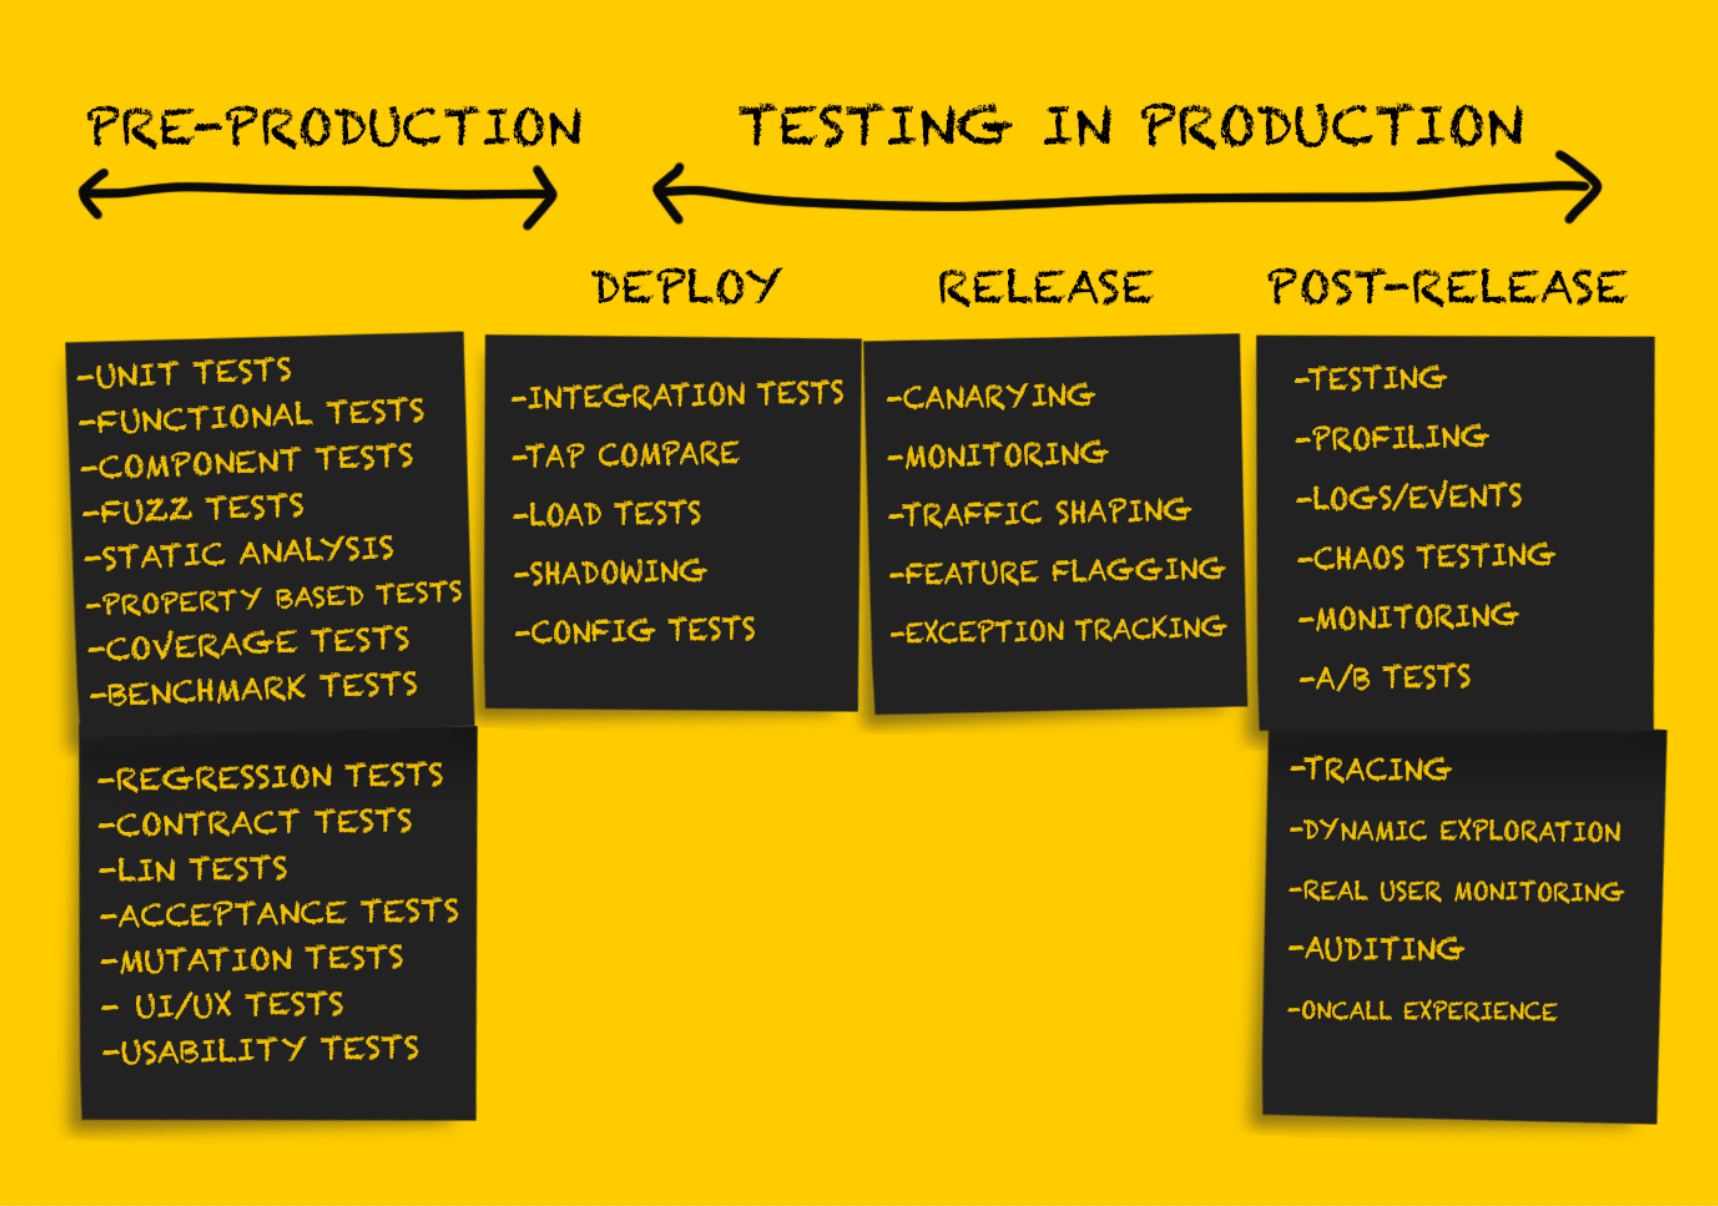
Production Testing: Release
Having tested the service after deployment , it must be prepared for release .
It is important to note that at this stage the rollback of changes is possible only in situations of sustained failure, for example:
- cycling service failure;
- a time-out for a significant number of upstream connections, causing a strong increase in error rates;
- unacceptable configuration changes, for example, the absence of a secret key in an environment variable that causes a failure in the service (environment variables are generally best avoided, but this is a topic for a separate discussion).
Careful testing at the deployment stage ideally allows minimizing or completely avoiding unpleasant surprises at the release stage. However, there are a number of recommendations for the safe release of new code.
')
Canary Deployment
Canary Deployment is a partial release of production service. As the basic health check progresses, small amounts of current production-production traffic are sent to the released parts. The results of the service parts are monitored as the traffic is processed, the indicators are compared with the reference ones (not related to canary ones), and if they fall outside the acceptable threshold values, the previous state is rolled back. Although this approach is usually applied when server software is released, canary client software testing is also becoming more common.
Various factors influence how much traffic will be used for canary deployment. In a number of companies, the released parts of the service first receive only internal user traffic (so-called dogfooding). If no errors are observed, then a small part of the production-environment traffic is added, after which a full-scale deployment is performed. Rollback to a previous state in case of unacceptable results of canary deployment is recommended to be performed automatically , and tools such as Spinnaker provide built-in support for automated analysis and rollback functions.
There are some problems with canary testing, and this article presents a fairly comprehensive overview of them.
Monitoring
Monitoring is an absolutely necessary procedure at every stage of product deployment in production, but this function will be especially important at the release stage. Monitoring is well suited for obtaining information about the overall level of system performance. But monitoring everything in the world may not be the best solution. Effective monitoring is performed pointwise, which reveals a small set of modes of sustained system failure or a basic set of indicators. Examples of such failure modes are:
- an increase in the frequency of errors;
- reducing the overall speed of processing requests in the entire service, at a specific endpoint, or, even worse, complete cessation of work;
- increase delay.
Observation of any of these sustained failure modes is the basis for an immediate rollback to a previous state or roll forward of new released software versions. It is important to remember that monitoring at this stage is unlikely to be complete and revealing. Many believe that the ideal number of monitored signals during monitoring is from 3 to 5, but definitely not more than 7–10. The Facebook technical document on Kraken offers the following solution:
"The problem is solved with the help of a freely configurable component for monitoring, which is reported with two basic indicators (the 99th percentile of the response time of the web server and the frequency of fatal HTTP errors) that objectively describe the quality of interaction with users."
The set of system indicators and applications that are monitored during the release phase is best defined during system design.
Exception tracking
We are talking about tracking exceptions at the release stage, although it would seem that at the deployment stages and after the release it would be equally useful. Exception tracking tools often do not guarantee the same thoroughness, accuracy, and mass coverage as some other system control tools, but they can still be very useful.
Open source tools (for example, Sentry ) display extensive information about incoming requests and create stacks of trace data and local variables, which greatly simplifies the debugging process, usually consisting of viewing event logs. Exception tracking is also useful when sorting and prioritizing problems that do not require a full rollback to a previous state (for example, a borderline case that causes an exception).
Traffic shaping
Traffic shaping (traffic redistribution) is not so much an independent form of testing, but a tool to support the canary approach and the phased release of a new code. In essence, traffic shaping is provided by updating the load balancer configuration, which allows you to gradually redirect more and more traffic to the new released version.
This method is also useful in the phased deployment of new software (separately from the usual deployment). Consider an example. In June 2016, imgix needed to deploy a fundamentally new infrastructure architecture. After the first testing of the new infrastructure with the help of some amount of dark traffic, they started to deploy in production, initially redirecting about 1% of the production media to the new stack. Then, over a period of several weeks, they increased the volume of data entering the new stack (solving incidentally arising problems) until it began to process 100% of the traffic.
The popularity of the service mesh architecture has led to a new surge of interest in proxy servers. As a result, both old (nginx, HAProxy) and new (Envoy, Conduit) proxy servers added support for new features in an attempt to outperform the competition. It seems to me that the future, in which the redistribution of traffic from 0 to 100% at the stage of product release is carried out automatically, is not far off.
Production Testing: After Release
Testing after release is carried out in the form of a check performed after a successful release of the code. At this stage, you can be sure that the code as a whole is correct, it is successfully released in production and processes the traffic properly. Deployed code is directly or indirectly used in the real world, serving real customers or performing tasks that have a significant impact on the business.
The goal of any testing at this stage is basically to check the performance of the system, taking into account possible various loads and traffic patterns. The best way to do this is to collect documentary evidence about everything that happens in production, and use them both for debugging and for getting a complete picture of the system.
Feature Flagging, or Dark Start
The oldest publication about the successful use of feature flags (function flags) that I managed to find was published almost ten years ago. The featureflags.io website provides the most comprehensive guide on this issue.
“Feature flagging is a method used by developers for marking a new function with the help of if-then statements, which allows for more careful control of its release. By marking a function with a flag and isolating it in this way, the developer is able to turn this function on and off regardless of the deployment status. This makes it possible to effectively separate the release of a function from the deployment of a code. ”
By marking a new code with a flag, you can test its performance and performance in production as needed. Feature flagging is one of the generally accepted types of testing in production, it is well known and often described in various sources . Much less well known is the fact that this method can also be used in the process of testing the transfer of databases or software for personal systems.
What the authors of the articles rarely write about is the best methods for developing and applying flags of functions. Uncontrolled use of flags can be a serious problem. Lack of discipline in terms of removing unused flags after a specified period sometimes leads to the fact that it is necessary to conduct a full audit and remove obsolete flags accumulated over the months (if not years) of work.
A / B testing
A / B testing is often performed as part of experimental analysis and is not considered testing in production. For this reason, A / B tests are not only widely (sometimes even in dubious ways) used, but also actively studied and described (including articles that define an effective scorecard for online experiments). More rarely, A / B tests are used to test various hardware configurations or virtual machines. They are often called “tuning” (for example, tuning a JVM), but they are not classified as typical A / B tests (although tuning can be considered as a type of A / B test performed with the same level of rigor when it comes to measurements) .
Logs, events, indicators and tracing
About the so-called “three whales of observability” - logs, indicators and distributed tracing can be read here .
Profiling
In some cases, in order to diagnose performance problems, it is necessary to use application profiling in production. Depending on supported languages and runtime environments, profiling can be a fairly simple procedure, which involves adding just one line of code to the application (
import _ "net/http/pprof" for the Go case). On the other hand, it may require the use of a variety of tools or the testing of the process performed by the black box method and checking the results using tools such as flamegraphs .Tee test
Many people consider such testing to be something like shadow data duplication, since in both cases the production-environment traffic is sent to non-production clusters or processes. In my opinion, the difference is that the use of traffic for testing purposes is somewhat different from its use for debugging purposes.
Etsy wrote in its blog about using tee tests as a verification tool (this example really resembles shadow data duplication).
“Here, tee can be taken as a command tee on the command line. We wrote an iRule rule based on the existing F5 load balancer to clone HTTP traffic sent to one of the pools and redirect it to another pool. Thus, we were able to use the production traffic sent to our API cluster and send a copy of it to the HHVM experimental cluster, as well as to an isolated PHP cluster for comparison.
This technique has been very effective. It allowed us to compare the performance of two configurations using identical traffic profiles. ”
However, sometimes performing a tee-test based on production-environment traffic in a stand-alone system is required for debugging . In such cases, the autonomous system can be modified to customize the display of additional diagnostic information or another compilation procedure (for example, using the stream cleaning tool), which greatly simplifies the troubleshooting process. In such cases, tee-tests should be considered rather as debugging tools , rather than verification .
In the past, in imgix, these types of debugging were relatively rare, but still used, especially if we were talking about problems with debugging sensitive applications.
For example, below is an analytical description of one of these incidents that occurred in 2015. Error 400 occurred so rarely that it was hardly seen when they tried to reproduce the problem. She appeared literally in several cases out of a billion. During the day they were quite a bit. As a result, it turned out that it is simply impossible to reliably reproduce the problem, so it was necessary to perform debugging using work traffic in order to have a chance to track the occurrence of this error. This is what my former colleague wrote about this:
“I chose a library that was supposed to be internal, but eventually I had to create my own based on the library provided by the system. In the version provided by the system, an error periodically occurred, which did not manifest itself in any way while the traffic volume was small. However, the true problem was the truncated name in the title.
Over the next two days, I studied in detail the problem associated with the increased frequency of false errors 400. The error manifested itself in a very small number of requests, and problems of this type are rather difficult to diagnose. All this was similar to the notorious needle in a haystack: the problem occurred in one case per billion.
The first step in locating the source of errors was to receive all the raw HTTP request source data that resulted in an incorrect response. To perform a tee test of incoming traffic when connecting to a socket, I added the end point of the Unix domain socket to the render server. The idea was to allow us to quickly and without special expenses turn on and off the flow of dark traffic and conduct testing directly on the developer's computer. To avoid problems in production, it was necessary to break the connection if there was a problem with back-pressure. Those. if the duplicate did not cope with the task, it was turned off. This socket was quite useful in a number of cases during development. This time, however, we used it to collect incoming traffic on selected servers, hoping to receive a sufficient number of requests in order to identify a pattern that led to false errors 400. Using dsh and netcat, I was able to bring incoming traffic to a local file relatively easily .
Most of the medium was spent on collecting this data. As soon as we had enough data, I was able to use netcat to reproduce it on a local system, the configuration of which was changed to display a large amount of debugging information. And everything went fine. The next step is to play data at the highest possible speed. In this case, the loop with the condition check sent the raw requests alternately. After about two hours I managed to achieve the desired result. The data in the logs showed no header!
I use a red-black tree to transfer the headers. Such structures consider comparability as identity, which in itself is very useful if there are special requirements for keys: in our case, the HTTP headers are not case sensitive. At first we thought that the problem was in the leaf node of the library used. The order of addition really influences the order of building the base tree, and balancing the red-black tree is a rather complicated process. And although this situation was unlikely, it was not impossible. I switched to another red-black wood implementation. It was fixed a few years ago, so I decided to embed it directly in the source code in order to get exactly the version that was needed. However, the assembly chose a different version, and since I was counting on a newer version, I ended up with incorrect behavior.
Because of this, the visualization system gave 500 errors, which led to the interruption of the cycle. That is why the error occurred only over time. After cyclic processing of several assemblies, the traffic from them was redirected along a different route, which increased the scale of the problem on this server. My assumption that the problem was in the library turned out to be wrong, and the reverse switching eliminated 500 errors.
I returned to error 400: there was still a problem with the error, which took about two hours to find. The change of the library obviously did not solve the problem, but I was sure that the chosen library was sufficiently reliable. Not realizing the fallacy of choice, I did not change anything. Having studied the situation in more detail, I realized that the correct value was stored in a one-character header (for example, “h: 12345”). It finally came to me that h is the end character of the Content-Length header. After reviewing the data, I realized that the Content-Length header was empty.
As a result, the whole thing was in the offset error by one when reading the headers. The nginx / joyent HTTP analyzer creates partial data, and each time the partial header field was one character shorter than necessary, I sent a header without a value and subsequently received a single-character header field containing the correct value. This is a rather rare combination, so its activation takes such a long time. So I increased the volume of data collection with each appearance of a one-character header, applied the proposed correction, and successfully executed the script for several hours.
Of course, there could have been any other pitfalls with the library malfunction mentioned, but both errors were eliminated. ”
Engineers involved in the development of delay-sensitive applications need debugging using captured dynamic traffic, since errors often occur that cannot be reproduced during unit testing or detected using the monitoring tool (especially if there is a serious delay in logging).
Chaos Engineering Approach
Chaos Engineering is an approach based on conducting experiments on a distributed system in order to confirm its ability to withstand the chaotic production environment.
The Chaos Engineering method, first made known by the Chaos Monkey tool from Netflix, has now become an independent discipline. The term Chaos Engineering appeared quite recently, but testing by the method of introducing faults is a long-standing practice.
The term "chaotic testing" refers to the following techniques:
- shutdown of arbitrary nodes to determine how resistant the system is to their failure;
- introducing errors (for example, increasing the delay) in order to confirm that the system is processing them correctly;
- forced disruption of the network in order to determine the reaction of the service.
Most companies use an insufficiently complex and multi-layered operating environment to effectively conduct random testing. It is important to emphasize that the introduction of faults in the system is best done after setting up basic fault tolerance functions. This technical document from Gremlin contains a fairly complete description of the principles of chaotic testing, as well as instructions for preparing for this procedure.
“Especially important is the fact that Chaos Engineering is considered a scientific discipline. Within this discipline, highly accurate engineering processes are applied.
Chaos Engineering's task is to inform users of something new about system vulnerabilities by experimenting with it. It is necessary to identify all the hidden problems that could arise in the production, even before they cause a major failure. Only after that you will be able to effectively eliminate all weaknesses in the system and make it truly fault tolerant. ”
Conclusion
The goal of production testing is not to completely eliminate all possible system failures. John Allspaw says:
“ We see that systems are becoming increasingly resilient - and that's fine. But it must be admitted: “more and more” is not equal to “absolutely.” In any complex system, failure can occur (and will occur) in the most unpredictable way. ”
Testing in production at first glance can seem like quite a challenge, going far beyond the competence of most engineering companies. And although such testing is not an easy task, associated with some risks, if you perform it according to all the rules, it will help to ensure the reliability of complex distributed systems that are found everywhere today.
Source: https://habr.com/ru/post/418329/
All Articles