How to debug WebRTC
In Voximplant, we have been using WebRTC since its inception: first, as an alternative to Flash for voice and video calls, and then as a complete replacement. The technology has gone a long and painful path of development, only recently all major browsers began to support it, there are difficulties with transferring the screen, several video streams, and sometimes the browser crashes simply if you turn off and turn on the video stream. The accumulated experience allows us to translate interesting articles for Habr, and today we pass the word to Li Sylvester from Xirsys, who will talk about debugging (video) calls to Chrome, Firefox, Safari and Edge. Debugging WebRTC is not easy, we even have special instructions for logging in popular browsers. And what Lee has - you will find out under the cut (spoiler: a lot of things, including WireShark).

Working in Xirsys, I saw some really cool apps that used WebRTC. But while a small group of developers are creating high-tech stuff, most programmers can't even start using WebRTC. Why? And everything is simple. It is complicated.
Many of us are familiar with a typical web application. Such an application has a client that sends requests and a server that responds to these requests. Simple, linear and easily predictable process. If something goes wrong, we usually know where to look at the logs and what could have happened. But with WebRTC, things are not so simple.
')
If you have ever written a multithreaded application, you probably know about the headache that this development delivers. Flights, broken memory - but most often just bugs that are hard to find.
WebRTC is asynchronous in nature. And this is not a simple asynchronous AJAX. To make an analogy, there are several simultaneous AJAX requests that try to reconcile the data on two computers. This is still entertainment.
Creating web applications comes down to developing something that runs on a server and responds to requests. The worst thing that can happen is the port that is not open in IPTables. It is treated in 2 minutes. What can not be said about WebRTC.
Web servers, not even their software, but hardware are devices with public IP addresses. They are made to be accessible from anywhere. And WebRTC is made to send and receive data from users' computers. Which usually have IP addresses 192.168. Something and are not eager to respond to network requests.
The authors of WebRTC know about this, so the engine will go through different methods of connection, in an attempt to establish a connection between two computers that are not very suitable for such.
In this article I tell about the main toolkit for solving the most popular problems. But before that, let's see how WebRTC normally establishes a connection.
All WebRTC connections require “little help” from the signaling protocol. “Little Help” is your own server and protocol through which the caller will be able to communicate with the caller before establishing a Peer-to-peer connection.
WebRTC will use the signaling protocol to transmit information about IP addresses, capabilities for capturing and reproducing voice and video, network topology, transmitted data.
Commonly used protocol is COMET (or SIP - translator's note) and web sockets. WebRTC does not limit the developers in any way, so you can use what you like, although you can transfer data through Notepad and copy-paste (they did it at one of the workshops, it works - again the translator). The signaling connected to both computers allows you to start connecting via WebRTC.
WebRTC connections use “offer” and “answer”:
This is in theory. In practice, sharing courtesies does not look so easy.
And only after all the actions, both connecting parties know each other's capabilities in receiving and sending voice / video.
But there are few opportunities to work with media data. After all, the contracting parties have not yet said anything about the status of the network.
You can find out which video codecs the browser supports and whether there is a camera on the laptop almost instantly. It takes time to learn your external IP address and the logic of how NAT works, and information about the state of the network is exchanged as this information is received.
Thanks to Trickle ICE technology (not supported by all browsers - translator's note), the connection between two WebRTC devices can be established at any time - as soon as a suitable “candidate” is found.
The developer must subscribe to the onicecandidate event (all lower case!) And transfer the received SDP packets to the other side, where they need to be transmitted to WebRTC using the addIceCandidate method (here, surprise, capital letter). Works both ways.
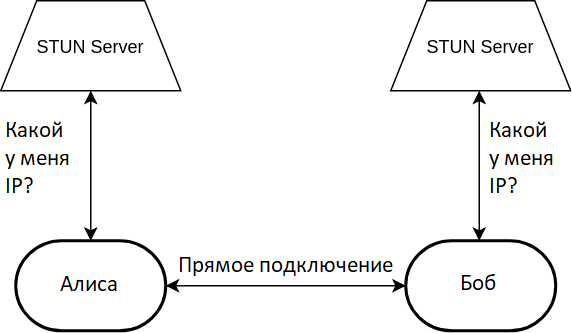
WebRTC uses things like STUN (Session Traversal Utilities for NAT) and TURN (Traversal Using Relay around NAT) to establish a connection. It sounds scary, but in fact only two network protocols.
The first of the two protocols is a bit more complicated than the echo server. When members of the connection want to describe how to connect to them, they need their public IP address. And most likely it will not be the IP address of the computer, user devices are rarely allocated public addresses. The whole NAT technology was invented so as not to highlight. In order to find out your public address, the browser makes a request to the STUN server. Passing through NAT, the network packet changes its return address to public. Upon receiving the packet with the request, the STUN server copies the return address of the packet to its payload and sends the packet back. Passing through NAT in the opposite direction, the packet loses its public IP address, but a copy of this address remains in payload, where WebRTC can read it.
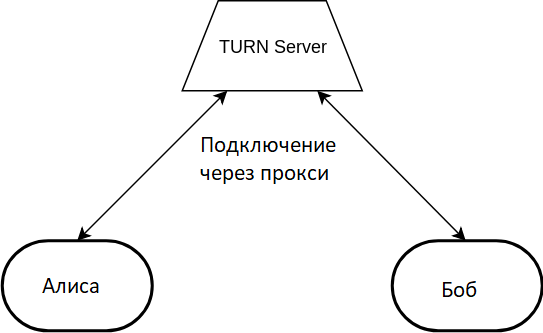
The TURN server uses the STUN protocol extension. The same packages, headers, plus a new thing: command . The server is a proxy: both clients connect to it through the UDP port allocation and transmit their data through the server.
TURN servers are designed in such a way that the initiator of the connection has more features than the other side. This leads to an interesting effect when a call through the TURN server is successful or unsuccessful depending on who is calling (everyone remembers Skype - the translator's note).
So, you've read this paragraph before. We are glad with the translator and remember that the article is about debugging WebRTC. But everything written above is a necessary minimum, without which you can not even begin. But if you start, and you do not have inhuman luck, then it will break.
It will break in many different ways. The first one: the lack of connection. You passed both WebRTC STUN and TURN server settings, helped them exchange the offer, answer and ICE candidates, but there was no video or voice. Where to begin? With local playback problems.
As I wrote above, the main work of WebRTC takes place on the browser side. STUN and TURN servers are incredibly simple, so most problems occur in your JavaScript code that runs in two browsers. Sad but true. On the other hand, if the most interesting thing happens locally in browsers, then you have extensive debugging capabilities!
The first thing to check is your signaling. It is your code that passes between the browsers audio configuration with video (offer, answer) and information about network settings (ice candidates). You need to check which packets were sent, which packets were received and transmitted to WebRTC:
If the exchange of packages does not cause suspicion, then you can delve into the guts of the session.
Offer, Answer and ICE candidate packages are created by WebRTC in SDP text format. At first glance, the contents of the packages look scary, but with a little preparation you can get a lot of benefit from them during debugging. Wikipedia describes SDP well, but for you I found a better description .
The most important field in the SDP ICE candidate packages is typ . For WebRTC, the field can have one of three values:
The host type specifies an ICE candidate for a local area connection (WebRTC enumerates several candidates hoping to establish a connection, it is not known in advance what will happen - the translator's note). Such a connection does not require either STUN or a TURN server, since devices on the local network can often establish network connections directly. When debugging from a local network, you just have to check and debug the transfer of host packets and make sure that the devices can send UDP packets to each other. Although there are exceptions, in practice I have seen network configurations in which the browser required a TURN server to connect ... to itself.
The combination of the letters "srflx" is decoded as "Server Reflexive" and marks candidates for connection using an external IP address, where a STUN server is enough for connection (using NAT penetration technology, which is successful in about 80% of cases - translator's note).
“Relay” marks the connection through the TURN server, which is almost always successful. It is important to remember that WebRTC is not required to create exactly three different packages with a “typ” field; how exactly candidates are selected depends on the implementation of WebRTC in a specific browser version.
Google offers a special web application for testing WebRTC connections on your device. Open the page, click the “start” button and the JavaScript code will try to connect to the Google server using signaling, STUN and Google TURN servers.
You inspected all the packages, checked the code, everything looks right, but does not work? For such cases, Google has provided its Chrome browser with a special section that shows the insides of WebRTC during connection setup and some beautiful graphs in case of successful connection. To use, open a special technical link in your browser:
If you already have an application using WebRTC, then you will immediately see a bunch of technical data. Otherwise, just open another tab and in it something that uses WebRTC. The tab displays all calls to the RTCPeerConnection object and allows you to see in real time how the connection is established.
At the top of the page is the ICE string that was used during connection initialization. If an error was made during its formation, it will immediately be seen (by “ICE-string” the author has in mind the configuration of the RTCPeerConnection object with the list of STUN and TURN-servers (the 'iceServers' object) - the translator's note). Perhaps there is no server list? You must configure an RTCPeerConnection object before you make the first call to createOffer or createAnswer .
The following internals section shows the calls to the RTCPeerConnection method and the events received from the object in chronological order. Errors are carefully highlighted in red. Please note that the red-highlighted addIceCandidateFailed is often not a sign of an error and the connection can normally establish. If the connection is successful, the last in the list will be the iceconnectionstatechange event with the complete value.
The following section is relevant when the connection is successfully established. It contains statistics of transmitted data and network delays. The two most interesting parameters are ssrc and bweforvideo .
Often you will not be able to access the internals page. For example, when a problem happens to your user. In this case, you can get the same data as the internals page shows by calling the getStats method on the RTCPeerConnection object. This method sets up a callback function that will be called by WebRTC every time something interesting happens. The called function receives an object with the fields that the internals page displays:
Another useful tool is the oniceconnectionstatechange event of an RTCPeerConnection object. The event handler will receive information about the connection progress. Possible options:
If the connection ended in the failed state, then we can examine the candidates received on both sides and understand why the connection failed. For example, if one side provided the candidates host and srflx , the other side was host and relay , but the devices were on different networks.
Often a situation happens when the connection is established, the sound is transmitted, but instead of a video, one or both participants have a black rectangle. This most often happens if you assign the received object with the video to the HTML element before the connection goes to the completed state.
In addition to the RTCPeerConnection object itself and the internals displayed by the browser, you can use network packet analysis tools such as Wireshark. These tools are able to display packets used WebRTC-protocols. For example, Wireshark will show you the contents of the STUN packets in the main window, and you can filter them by typing the keyword “stun” in the filter field:
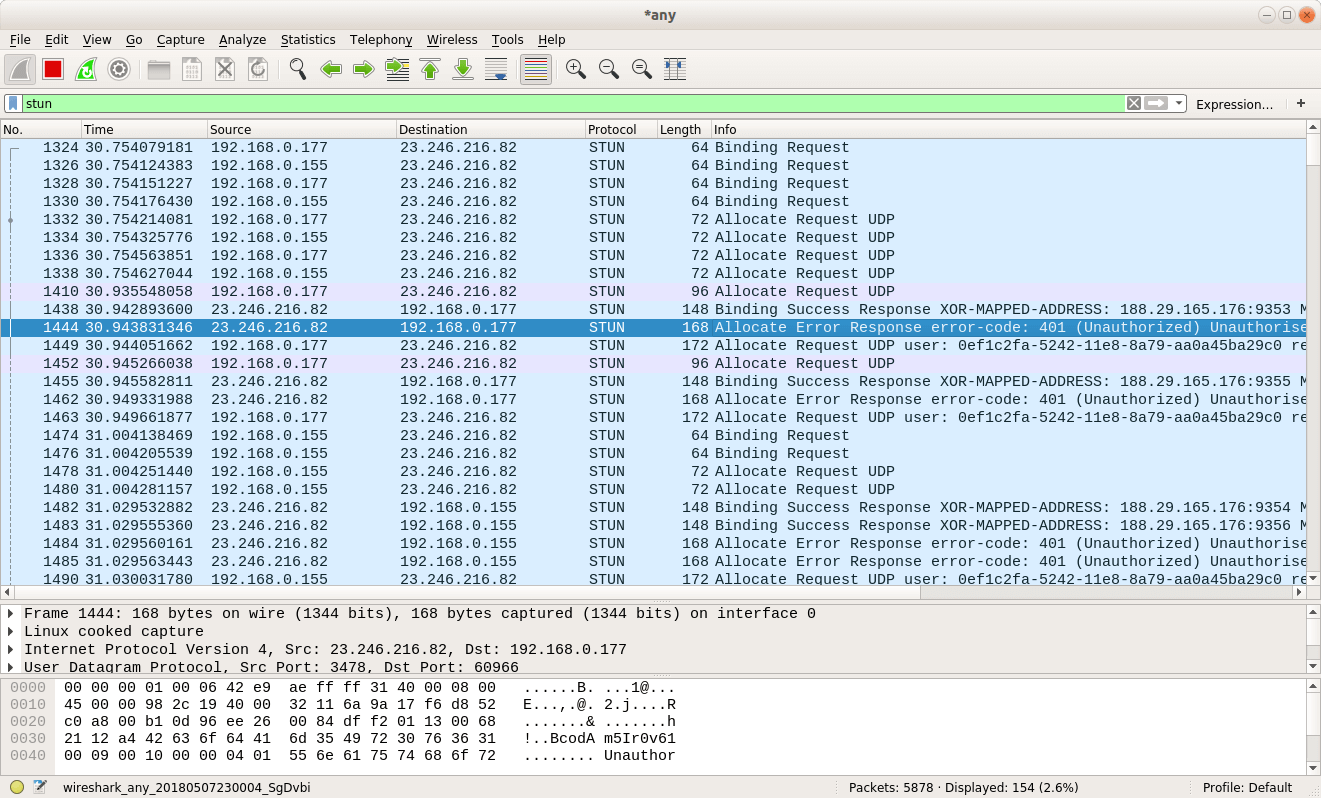
What to look for in server responses? If you see only replies with the Binding type, this means support only for STUN (a story about an external IP), and WebRTC can only offer srflx candidates. If the responses have TURN-specific Allocation and CreatePermission packages , then WebRTC will have the opportunity to try to connect through a proxy server. The packet sniffer marks successful and unsuccessful Allocation . If there is no one successful, then the wrong parameters of access to the TURN servers (which are almost always protected with a login and password - the translator's note) are most likely transmitted.
If the log has the CreatePermission Success Response package, then it can be assumed that everything is fine with the STUN and TURN configuration. And if the ChannelBind package is also present, then it was possible to establish a connection to the TURN server at high speed.
In my practice, many WebRTC solutions that connect over WiFi cannot connect over 3G / 4G. Running an application on a mobile device is harder to debug: we do not have such a simple packet analyzer as Wireshark, and Safari does not know how to show WebRTC internals. Logic dictates that if the application works normally over WiFi, then the problem is not in the application itself, but in the cellular connection. How to debug? Get a laptop and connect a 3G dongle to it. So you have a packet analyzer and convenient logs, with which you can find the root of all troubles in a reasonable time.
Debugging WebRTC is not easy, but if you search well on the Internet, you can find a lot of articles and examples. If you are working in realtime communications, I recommend that you read the RFC specifications for STUN , TURN protocols and WebRTC technology. The documents are large, but the information contained in them helps to make reliable decisions and answer the question “why it doesn’t call”.
The dark side of WebRTC
Working in Xirsys, I saw some really cool apps that used WebRTC. But while a small group of developers are creating high-tech stuff, most programmers can't even start using WebRTC. Why? And everything is simple. It is complicated.
Many of us are familiar with a typical web application. Such an application has a client that sends requests and a server that responds to these requests. Simple, linear and easily predictable process. If something goes wrong, we usually know where to look at the logs and what could have happened. But with WebRTC, things are not so simple.
')
Asynchrony
If you have ever written a multithreaded application, you probably know about the headache that this development delivers. Flights, broken memory - but most often just bugs that are hard to find.
WebRTC is asynchronous in nature. And this is not a simple asynchronous AJAX. To make an analogy, there are several simultaneous AJAX requests that try to reconcile the data on two computers. This is still entertainment.
Mine Bypass NAT Field
Creating web applications comes down to developing something that runs on a server and responds to requests. The worst thing that can happen is the port that is not open in IPTables. It is treated in 2 minutes. What can not be said about WebRTC.
Web servers, not even their software, but hardware are devices with public IP addresses. They are made to be accessible from anywhere. And WebRTC is made to send and receive data from users' computers. Which usually have IP addresses 192.168. Something and are not eager to respond to network requests.
The authors of WebRTC know about this, so the engine will go through different methods of connection, in an attempt to establish a connection between two computers that are not very suitable for such.
Where to start debugging
In this article I tell about the main toolkit for solving the most popular problems. But before that, let's see how WebRTC normally establishes a connection.
How WebRTC connects
All WebRTC connections require “little help” from the signaling protocol. “Little Help” is your own server and protocol through which the caller will be able to communicate with the caller before establishing a Peer-to-peer connection.
WebRTC will use the signaling protocol to transmit information about IP addresses, capabilities for capturing and reproducing voice and video, network topology, transmitted data.
Commonly used protocol is COMET (or SIP - translator's note) and web sockets. WebRTC does not limit the developers in any way, so you can use what you like, although you can transfer data through Notepad and copy-paste (they did it at one of the workshops, it works - again the translator). The signaling connected to both computers allows you to start connecting via WebRTC.
Offer and answer
WebRTC connections use “offer” and “answer”:
- The initiator of the connection creates and sends to the other side the “offer”.
- The other party receives the “offer”, creates the “answer” and sends it back.
- The initiator of the connection receives a “answer”.
This is in theory. In practice, sharing courtesies does not look so easy.
- Before sending the “offer”, the initiator of the connection creates an instance of the RTCPeerConnection and receives from it the “SDP” (Session Description Protocol) text packet using rtcPeerConnection.createOffer () ; This package describes the capabilities for receiving / transmitting voice and video for the browser.
- The contents of an SDP packet are set as “description of the local side of the connection” using rtcPeerConnection.setLocalDescription () .
- The packet is transmitted to the other side, where its contents are set as “description of the other side of the connection” using rtcPeerConnection.setRemoteDescription () .
- On the other side of the connection, you create your own SDP packet using rtcPeerConnection.createAnswer () , its content is set as the “description of the local connection side”.
- The packet is transmitted to the initiator of the connection, which sets its contents as “description of the other side of the connection”.
And only after all the actions, both connecting parties know each other's capabilities in receiving and sending voice / video.
ICE candidates
But there are few opportunities to work with media data. After all, the contracting parties have not yet said anything about the status of the network.
You can find out which video codecs the browser supports and whether there is a camera on the laptop almost instantly. It takes time to learn your external IP address and the logic of how NAT works, and information about the state of the network is exchanged as this information is received.
Thanks to Trickle ICE technology (not supported by all browsers - translator's note), the connection between two WebRTC devices can be established at any time - as soon as a suitable “candidate” is found.
The developer must subscribe to the onicecandidate event (all lower case!) And transfer the received SDP packets to the other side, where they need to be transmitted to WebRTC using the addIceCandidate method (here, surprise, capital letter). Works both ways.
Connection
WebRTC uses things like STUN (Session Traversal Utilities for NAT) and TURN (Traversal Using Relay around NAT) to establish a connection. It sounds scary, but in fact only two network protocols.
STUN server
The first of the two protocols is a bit more complicated than the echo server. When members of the connection want to describe how to connect to them, they need their public IP address. And most likely it will not be the IP address of the computer, user devices are rarely allocated public addresses. The whole NAT technology was invented so as not to highlight. In order to find out your public address, the browser makes a request to the STUN server. Passing through NAT, the network packet changes its return address to public. Upon receiving the packet with the request, the STUN server copies the return address of the packet to its payload and sends the packet back. Passing through NAT in the opposite direction, the packet loses its public IP address, but a copy of this address remains in payload, where WebRTC can read it.
TURN server
The TURN server uses the STUN protocol extension. The same packages, headers, plus a new thing: command . The server is a proxy: both clients connect to it through the UDP port allocation and transmit their data through the server.
TURN servers are designed in such a way that the initiator of the connection has more features than the other side. This leads to an interesting effect when a call through the TURN server is successful or unsuccessful depending on who is calling (everyone remembers Skype - the translator's note).
Debugging
So, you've read this paragraph before. We are glad with the translator and remember that the article is about debugging WebRTC. But everything written above is a necessary minimum, without which you can not even begin. But if you start, and you do not have inhuman luck, then it will break.
It will break in many different ways. The first one: the lack of connection. You passed both WebRTC STUN and TURN server settings, helped them exchange the offer, answer and ICE candidates, but there was no video or voice. Where to begin? With local playback problems.
WebRTC local debugging
As I wrote above, the main work of WebRTC takes place on the browser side. STUN and TURN servers are incredibly simple, so most problems occur in your JavaScript code that runs in two browsers. Sad but true. On the other hand, if the most interesting thing happens locally in browsers, then you have extensive debugging capabilities!
The first thing to check is your signaling. It is your code that passes between the browsers audio configuration with video (offer, answer) and information about network settings (ice candidates). You need to check which packets were sent, which packets were received and transmitted to WebRTC:
- Did the other party get the offer? Connection initiator received answer? Connection will not be established without this minimum exchange of courtesies;
- WebRTC at both ends of the connection handed you packets with ICE candidates? Did you exchange these packages and pass them back to the opposite side using addIceCandidate ?
- If everything went well with the packet exchange, was the onaddstream event handler triggered and did you install the resulting object in the HTML element to play the video (or audio)?
If the exchange of packages does not cause suspicion, then you can delve into the guts of the session.
Session Description Protocol
Offer, Answer and ICE candidate packages are created by WebRTC in SDP text format. At first glance, the contents of the packages look scary, but with a little preparation you can get a lot of benefit from them during debugging. Wikipedia describes SDP well, but for you I found a better description .
The most important field in the SDP ICE candidate packages is typ . For WebRTC, the field can have one of three values:
- typ host;
- typ srflx;
- typ relay.
typ host
The host type specifies an ICE candidate for a local area connection (WebRTC enumerates several candidates hoping to establish a connection, it is not known in advance what will happen - the translator's note). Such a connection does not require either STUN or a TURN server, since devices on the local network can often establish network connections directly. When debugging from a local network, you just have to check and debug the transfer of host packets and make sure that the devices can send UDP packets to each other. Although there are exceptions, in practice I have seen network configurations in which the browser required a TURN server to connect ... to itself.
typ srflx
The combination of the letters "srflx" is decoded as "Server Reflexive" and marks candidates for connection using an external IP address, where a STUN server is enough for connection (using NAT penetration technology, which is successful in about 80% of cases - translator's note).
typ relay
“Relay” marks the connection through the TURN server, which is almost always successful. It is important to remember that WebRTC is not required to create exactly three different packages with a “typ” field; how exactly candidates are selected depends on the implementation of WebRTC in a specific browser version.
Testing Device Connection
Google offers a special web application for testing WebRTC connections on your device. Open the page, click the “start” button and the JavaScript code will try to connect to the Google server using signaling, STUN and Google TURN servers.
WebRTC Internals
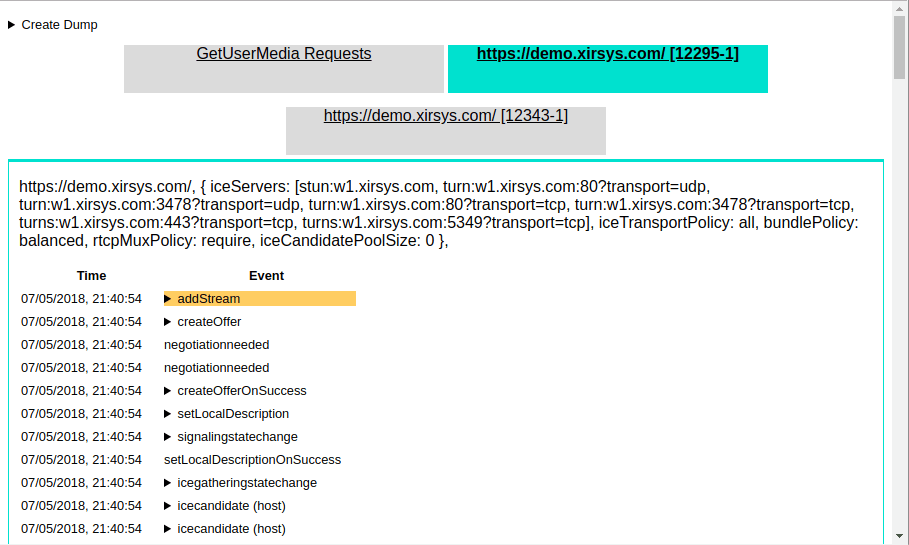
You inspected all the packages, checked the code, everything looks right, but does not work? For such cases, Google has provided its Chrome browser with a special section that shows the insides of WebRTC during connection setup and some beautiful graphs in case of successful connection. To use, open a special technical link in your browser:
chrome://webrtc-internalsIf you already have an application using WebRTC, then you will immediately see a bunch of technical data. Otherwise, just open another tab and in it something that uses WebRTC. The tab displays all calls to the RTCPeerConnection object and allows you to see in real time how the connection is established.
ICE setup
At the top of the page is the ICE string that was used during connection initialization. If an error was made during its formation, it will immediately be seen (by “ICE-string” the author has in mind the configuration of the RTCPeerConnection object with the list of STUN and TURN-servers (the 'iceServers' object) - the translator's note). Perhaps there is no server list? You must configure an RTCPeerConnection object before you make the first call to createOffer or createAnswer .
RTCPeerConnection events
The following internals section shows the calls to the RTCPeerConnection method and the events received from the object in chronological order. Errors are carefully highlighted in red. Please note that the red-highlighted addIceCandidateFailed is often not a sign of an error and the connection can normally establish. If the connection is successful, the last in the list will be the iceconnectionstatechange event with the complete value.
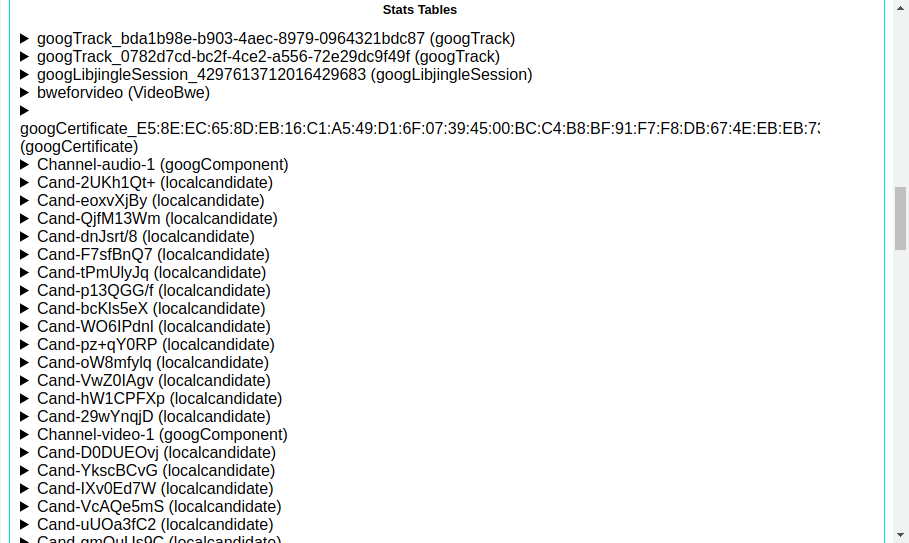
'Stats' section
The following section is relevant when the connection is successfully established. It contains statistics of transmitted data and network delays. The two most interesting parameters are ssrc and bweforvideo .
- ssrc , “Stream Source”, marks each of your audio and video tracks. Displays data transfer statistics and parameters such as round trip time ;
- bweforvideo , BandWidth Estimate, displays the width of the network channel used.
GetStats function
Often you will not be able to access the internals page. For example, when a problem happens to your user. In this case, you can get the same data as the internals page shows by calling the getStats method on the RTCPeerConnection object. This method sets up a callback function that will be called by WebRTC every time something interesting happens. The called function receives an object with the fields that the internals page displays:
rtcPeerConnection.getStats(function(stats) { document.getElementById("lostpackets").innerText = stats.packetsLost; }); Another useful tool is the oniceconnectionstatechange event of an RTCPeerConnection object. The event handler will receive information about the connection progress. Possible options:
- new : WebRTC expects candidates from the second side of the connection, which must be added using the addIceCandidate method;
- checking : WebRTC received candidates from the second side of the connection, compares them with the local ones and iterates over the options;
- connected : An appropriate pair of candidates is selected and the connection is established. It is noteworthy that after this, candidates can continue to come, in accordance with the protocol "Trickle ICE";
- completed : all candidates received and connection established.
- disconnected : connection disconnected . On unstable channels, WebRTC is able to reestablish the connection itself, following the flag of connected ;
- closed : connection is disconnected and WebRTC no longer works with it.
If the connection ended in the failed state, then we can examine the candidates received on both sides and understand why the connection failed. For example, if one side provided the candidates host and srflx , the other side was host and relay , but the devices were on different networks.
Black rectangle instead of video
Often a situation happens when the connection is established, the sound is transmitted, but instead of a video, one or both participants have a black rectangle. This most often happens if you assign the received object with the video to the HTML element before the connection goes to the completed state.
How to poke a wand outside
In addition to the RTCPeerConnection object itself and the internals displayed by the browser, you can use network packet analysis tools such as Wireshark. These tools are able to display packets used WebRTC-protocols. For example, Wireshark will show you the contents of the STUN packets in the main window, and you can filter them by typing the keyword “stun” in the filter field:
What to look for in server responses? If you see only replies with the Binding type, this means support only for STUN (a story about an external IP), and WebRTC can only offer srflx candidates. If the responses have TURN-specific Allocation and CreatePermission packages , then WebRTC will have the opportunity to try to connect through a proxy server. The packet sniffer marks successful and unsuccessful Allocation . If there is no one successful, then the wrong parameters of access to the TURN servers (which are almost always protected with a login and password - the translator's note) are most likely transmitted.
If the log has the CreatePermission Success Response package, then it can be assumed that everything is fine with the STUN and TURN configuration. And if the ChannelBind package is also present, then it was possible to establish a connection to the TURN server at high speed.
Cellular Problems
In my practice, many WebRTC solutions that connect over WiFi cannot connect over 3G / 4G. Running an application on a mobile device is harder to debug: we do not have such a simple packet analyzer as Wireshark, and Safari does not know how to show WebRTC internals. Logic dictates that if the application works normally over WiFi, then the problem is not in the application itself, but in the cellular connection. How to debug? Get a laptop and connect a 3G dongle to it. So you have a packet analyzer and convenient logs, with which you can find the root of all troubles in a reasonable time.
findings
Debugging WebRTC is not easy, but if you search well on the Internet, you can find a lot of articles and examples. If you are working in realtime communications, I recommend that you read the RFC specifications for STUN , TURN protocols and WebRTC technology. The documents are large, but the information contained in them helps to make reliable decisions and answer the question “why it doesn’t call”.
Source: https://habr.com/ru/post/417869/
All Articles