Zabbix - monitoring OSPF neighbors using SNMPv3 TRAPs, pain and despair
Technical task
There is a network of geographically dispersed data centers with a VRF car and a constantly changing list of OSPF neighbors. You need to track them:
- State, make alarm if neighbor state is not FULL
- The number, that is, if the neighbor is gone, you must also make an alarm
Monitoring system is already there - Zabbix 3.4, it is desirable to use it, Linux OS Debian 9.x
We try with a swoop
The protocol is widespread, the monitoring system is well-known, for sure I am not the first who wants to solve this problem and most likely it has already been solved.
We hammer in search of "zabbix ospf" and the first link leads to a template . Happiness is what - now I import it, brush it to fit my needs and everything will be okay.
We check how it works - everything seems to be good, the states are monitored, but when the neighbor goes to the DOWN state, we receive a very informative message from Zabbix
')
No Such Instance currently exists at this OID and info
The item is not discovered anymore and will be deleted in 29d 23h 57m (on 2018-08-19 at 08:52) What happened - the problem is old and well-known on the forums - when the OSPF neighbor disappears, then all OIDs associated with it are simply deleted on the network hardware.
Yes, there is a solution - create a nodata trigger, ok, create:
{Template - SNMPv3 - OSPF Discovery:ospfNbrState[{#SNMPVALUE}].nodata(120)}=0 We see in the dashboard:
OSPF neighbor 192.168.192.168 missing data Basically ... usable
But out of the box, LLD only detects neighbors from the default VRF. Of course, this can be solved with the help of the SNMP context , but somehow I didn’t want to go this way - it is necessary to go through all the glands, each OSPF process or the VRF will stick the context, then in the template make Discovery copies for each context, in general, a bit too much messing around and adding new OSPF processes need to change something in several places. Of course, you can overlap with scripts and change everything through Zabbix API, but you didn’t want a special custom, but I wanted to use only the functionality built into Zabbix to the maximum. There is a mention of a certain CISCO-CONTEXT-MAPPING-MIB, from which you can pull out all the correspondences of contexts and OSPF / VRF, but I didn’t figure out how to attach this design to the LLD and my case. If someone knows how to cook Zabbix so cool, then welcome to the comments, but rather to a full-fledged separate article.
We try from the second swoop
After a couple of hours of searching on the Internet by hints in the forums and from the memory bins, the topic about SNMP TRAP has surfaced - this is when we do not interrogate the piece of iron, but the piece of iron itself sends information about changing something. Yes, and hike the support of this good is in our monitoring system out of the box , the equipment is also able to immediately and just for my case.
From the first lines the monitoring documentation confused me with a long list:
The workflow of receiving a trap: 1. snmptrapd receives a trap 2. snmptrapd passes the trap to SNMPTT or calls Perl trap receiver 3. SNMPTT or Perl trap receiver parses, formats and writes the trap to a file 4. Zabbix SNMP trapper reads and parses the trap file 5. For each trap Zabbix finds all “SNMP trapper” items with host interfaces matching the received trap address. Note that only the selected “IP” or “DNS” in host interface is used during the matching. 6. For each found item, the trap is compared to regexp in “snmptrap[regexp]”. The trap is set as the value of all matched items. If no matching item is found and there is an “snmptrap.fallback” item, the trap is set as the value of that. 7. If the trap was not set as the value of any item, Zabbix by default logs the unmatched trap. (This is configured by “Log unmatched SNMP traps” in Administration → General → Other.) That is, one daemon takes TRAP, sends it to another daemon, it parses it, puts it into the log with the required format and zabiks reads the log and decides what to do next. Somehow it already looks never easier than even to walk and draw an SNMP context everywhere, but oh well, let's try. We read attentively to the monitoring dock and understand that only with its help nothing can be set up, Zabbix generally has such a joke - the documentation describes the system’s features and nuances so minimally that it is rather more confusing than it is taught. Although they can be understood - the software is free, but somehow you have to earn money, but they also earn money on support. There are articles on the Internet describing how to set it up once or twice , but I haven’t been able to set up one-on-one for one article, I had to collect information from various sources bit by bit. It's all the lyrics, drove to do hardcore.
We configure network piece of iron
Before you twist something on the host with monitoring, I strongly recommend that you first set up a network piece of hardware and make sure that TRAP really flies from the piece of iron to the server - at first I did not check that I drank a lot of nerves, blood and time. I have a Cisco Nexus car at hand, so I’ll give examples for this series. Who has Catalyst, ASR, ASA and so on - excuse me, I’m not sunshine, I’ll not warm everyone, read the docks how to set it up themselves, the syntax will be similar, but with its own nuances.
snmp-server contact noc@example.com snmp-server location Room1 snmp-server source-interface traps loopback1 It is important later when configuring TRAP in Zabbix, so that the address from which the TRAP is sent is equal to the SNMP interface address in the settings of the host in Zabbix.
snmp-server user Zabbix network-operator auth sha string priv aes-128 string Use protocol version 3 wherever possible, in authPriv mode (encryption and authentication), it is not as difficult to configure as it seems. Forget about the 1 and 2 versions of the protocol - when an unexpected incident arrives due to the lack of encryption and essentially authentication in these versions of the protocol - just a matter of time (the community line is transmitted in clear text, moreover, I regularly see that it is public / private). The network-operator parameter allows you to grant read-only rights to the user.
snmp-server host 192.168.192.168 traps version 3 priv Zabbix snmp-server host 192.168.192.168 use-vrf default snmp-server host 192.168.192.168 source-interface loopback1 no snmp-server enable traps ospf lsa snmp-server enable traps ospf no snmp-server enable traps entity entity_mib_change no snmp-server enable traps entity entity_module_status_change no snmp-server enable traps entity entity_power_status_change no snmp-server enable traps entity entity_module_inserted no snmp-server enable traps entity entity_module_removed no snmp-server enable traps entity entity_unrecognised_module no snmp-server enable traps entity entity_fan_status_change no snmp-server enable traps entity entity_power_out_change no snmp-server enable traps link linkDown no snmp-server enable traps link linkUp no snmp-server enable traps link extended-linkDown no snmp-server enable traps link extended-linkUp no snmp-server enable traps link cieLinkDown no snmp-server enable traps link cieLinkUp no snmp-server enable traps link connUnitPortStatusChange no snmp-server enable traps bfd session-up no snmp-server enable traps link delayed-link-state-change no snmp-server enable traps bfd session-down no snmp-server enable traps rf redundancy_framework no snmp-server enable traps license notify-license-expiry no snmp-server enable traps license notify-no-license-for-feature no snmp-server enable traps license notify-licensefile-missing no snmp-server enable traps license notify-license-expiry-warning no snmp-server enable traps upgrade UpgradeOpNotifyOnCompletion no snmp-server enable traps upgrade UpgradeJobStatusNotify no snmp-server enable traps rmon risingAlarm no snmp-server enable traps rmon fallingAlarm no snmp-server enable traps rmon hcRisingAlarm no snmp-server enable traps rmon hcFallingAlarm no snmp-server enable traps entity entity_sensor no snmp-server enable traps generic coldStart no snmp-server enable traps generic warmStart I specifically turned off all TRAP except OSPF, so that when diagnosing why something is not working, I did not have to deduct a lot of unnecessary information from the debug.
How to check if TRAP is working - it's very simple - you need to break something. We start the sniffer on the host with monitoring:
root@dc-zbx:~# tcpdump -i bond0 udp port 162 tcpdump: verbose output suppressed, use -v or -vv for full protocol decode listening on bond0, link-type EN10MB (Ethernet), capture size 262144 bytes We find living neighbors on a piece of iron:
SW# show ip ospf neighbors vrf all OSPF Process ID 10 VRF default Total number of neighbors: 4 Neighbor ID Pri State Up Time Address Interface 192.168.0.242 1 FULL/ - 01:47:17 172.17.0.10 Vlan1427 192.168.0.222 1 FULL/ - 18w1d 172.17.0.6 Vlan1426 192.168.1.149 1 FULL/ - 5w0d 172.17.0.30 Vlan1473 192.168.1.146 1 FULL/ - 3d00h 172.17.0.58 Vlan1404 OSPF Process ID 100 VRF OSPF100 Total number of neighbors: 4 Neighbor ID Pri State Up Time Address Interface 192.168.1.149 1 FULL/ - 5w0d 172.17.0.34 Vlan1474 192.168.0.220 1 FULL/ - 13w3d 172.17.0.54 Vlan1479 192.168.0.240 1 FULL/ - 13w3d 172.17.0.46 Vlan1477 192.168.1.146 1 FULL/ - 3d00h 172.17.0.62 Vlan1405 OSPF Process ID 200 VRF Dia Total number of neighbors: 2 Neighbor ID Pri State Up Time Address Interface 10.65.0.252 1 FULL/ - 17w2d 172.17.0.18 Vlan1450 172.17.0.26 1 FULL/ - 17w0d 172.17.0.26 Vlan1452 OSPF Process ID 216 VRF Dev Total number of neighbors: 2 Neighbor ID Pri State Up Time Address Interface 10.255.255.94 1 FULL/ - 18:59:59 10.216.0.73 Vlan1641 10.216.0.82 1 FULL/ - 18:59:54 10.216.0.82 Vlan1643 And drop someone
interface vlan 1643 shutdown We see in the sniffer:
11:08:20.001942 IP 192.168.192.169.22095 > dc-zbx.example.com.snmp-trap: F=ap U="Zabbix" [!scoped PDU]39_d1_7c_19_b3_d9_f8_31_32_8e_c9_39_c2_3a_db_d8_28_26_c6_0b_01_55_b6_fa_5e_f5_38_66_f9_6f_3f_c0_98_cb_57_93_5a_50_8e_50_90_79_f3_9b_ec_ec_d7_9f_e8_ac_f6_fd_79_ac_95_ff_71_73_32_70_52_66_a5_7d_b3_c4_39_d0_1c_7f_a6_38_ea_d7_61_c0_2f_12_ee_db_d9_07_40_8c_a8_48_57_e9_e5_56_12_3f_ec_f9_34_65_09_96_86_f6_d2_93_06_45_fa_95_ea_36_5a_82_2f_30_8f_02_03_59_07_5f_d8_a6_1c_f2_5a_be_7d_09_15_ef_05_00_83_fd_ea_ac_2a_3b_86_0f_86_e5_3b_93_3a_68_6d_33_99_e2_46_2b_9d_6a_1e_5d_9e_d9_93_56_51_5e_ff_9e_77_4c_cb If you didn’t see anything in the sniffer, diagnose it, because otherwise there’s no point in continuing any further, you just won’t understand at which of the stages something isn’t working for you.
If you do not have a piece of iron on hand or you cannot touch production, then TRAP can be generated from any other car, for example like this:
snmptrap -v 1 -c neveruseme 127.0.0.1 '.1.3.6.1.6.3.1.1.5.3' '0.0.0.0' 6 33 '55' .1.3.6.1.6.3.1.1.5.3 s "teststring000" snmptrap -v3 -l authPriv -u Zabbix -a SHA -A abyrvalg -x AES -X pechka -e 0x8000000001020305 192.168.192.168 0 linkUp.0 Configure SNMPd, SNMPTRAPd, SNMPTT
We will need packages in the system:
apt install snmp snmp-mibs-downloader snmpd snmptrapd snmptt I did not focus on the Perl trap receiver, but chose SNMPTT for personal and subjective reasons. So, in dock it is written:
1. snmptrapd receives a trap It is necessary to begin with its settings, and not to climb right away to create an Item in the face of Zabbix. Why is it so - you need to climb the same steps that goes TRAP. In the previous section, we made sure that TRAP arrives in principle from a piece of iron, now we will ensure that it is at least accepted by the first demon, snmptrapd. I remember setting up postfix + dovecot + something else there for a long time. And I spent about two weeks - there, too, one demon accepts a connection, another parsit letter, the third puts it in the queue, the fourth in the folder to the user, and so on, and I could not do anything. And all because I set it up from the middle, then from the end, then from the beginning, but I had to start from telnet on port 25 and watch the debigging of the lichener </ lyric>
We climb in /etc/snmp/snmptrapd.conf and delete, and better comment there everything that we do not understand and do not care, leave one line
disableAuthorization yes Stop service
systemctl stop snmptrapd.service Run in manual mode
root@dc-zbx:~# snmptrapd -f -Lo NET-SNMP version 5.7.3 AgentX subagent connected NET-SNMP version 5.7.3 Again, try to break OSPF as in the example above and see:
2018-07-20 11:38:38 UNKNOWN [UDP: [192.168.192.169]:22095->[192.168.192.168]:162]: DISMAN-EVENT-MIB::sysUpTimeInstance = Timeticks: (1355817272) 156 days, 22:09:32.72 SNMPv2-MIB::snmpTrapOID.0 = OID: OSPF-TRAP-MIB::ospfNbrStateChange OSPF-MIB::ospfRouterId = IpAddress: 10.216.0.74 OSPF-MIB::ospfNbrIpAddr = IpAddress: 10.216.0.82 OSPF-MIB::ospfNbrAddressLessIndex = INTEGER: 0 OSPF-MIB::ospfNbrRtrId = IpAddress: 10.216.0.82 OSPF-MIB::ospfNbrState = INTEGER: down(1) If we do not see, then we look for the reason why. If you want to have the same beautiful entries, and not a set OID of the form 1.3.6.1.2.1.14.10.1.6, then add the following to /etc/snmp/snmp.conf:
mibs +OSPF-MIB mibs +OSPF-TRAP-MIB mibs +OSPFV3-MIB mibdirs +/usr/share/snmp/mibs/ietf/ And distort SNMPd
systemctl restart snmpd.service For more details on how to download MIB files with the least pain and feed them to your SNMPd, you can read [here] (https://wiki.debian.org/SNMP).
Now we will fasten authentication, we climb again in /etc/snmp/snmptrapd.conf
traphandle default snmptthandler #disableAuthorization yes # 192.168.192.169 createUser -e 0x80000009038d604a6a82a3 Zabbix SHA string AES authuser log,execute,net Zabbix -e 0x80000009038d604a6a82a3 is the engineID, you can look at it on the network hardware:
SW# sh snmp engineID Local SNMP engineID: [Hex] 80000009038F604D6A82A1 [Dec] 128:040:000:109:003:140:096:079:106:131:160 We repeat the experiment again, but now we are still catching the debm about USM:
root@dc-zbx:~# snmptrapd -f -Lo -Dusm registered debug token usm, 1 usmUser: created a new user Zabbix at 80 00 00 09 03 8F 60 4F 6B 82 A5 NET-SNMP version 5.7.3 AgentX subagent connected NET-SNMP version 5.7.3 usm: USM processing begun... usm: match on user Zabbix usm: no match on engineID (80 00 00 09 03 8F 60 4F 6B 82 A5 ) usm: match on user Zabbix usm: Verification succeeded. usm: USM processing completed. 2018-07-20 11:50:07 UNKNOWN [UDP: [192.168.192.169]:22095->[192.168.192.168]:162]: DISMAN-EVENT-MIB::sysUpTimeInstance = Timeticks: (1355886163) 156 days, 22:21:01.63 SNMPv2-MIB::snmpTrapOID.0 = OID: OSPF-TRAP-MIB::ospfNbrStateChange OSPF-MIB::ospfRouterId = IpAddress: 10.216.0.74 OSPF-MIB::ospfNbrIpAddr = IpAddress: 10.216.0.82 OSPF-MIB::ospfNbrAddressLessIndex = INTEGER: 0 OSPF-MIB::ospfNbrRtrId = IpAddress: 10.216.0.82 OSPF-MIB::ospfNbrState = INTEGER: down(1) If at this stage you see authorization errors in the debug, carefully check the engineID and that the users created on the piece of hardware match those we drew in the /etc/snmp/snmptrapd.conf configuration file. By the way, yes, for each piece of iron you have to create your user with your engineID, or make your hands the same on all pieces of hardware, if the pieces of iron allow you to do this.
I can see the line in debug:
usm: no match on engineID (80 00 00 09 03 8F 60 4F 6B 82 A5 ) Why I did not understand this, although with all this, TRAP is accepted and sent for further processing. If you know what I did wrong, please in the comments.
Now we take on SNMPTT - it has two ini and conf config files. In the first, we determine the operating parameters of the daemon itself, in the second, we determine the parameters for receiving and processing each specific ladder.
We climb into the /etc/snmp/snmptt.ini file and draw the following things:
mode = daemon net_snmp_perl_enable = 1 date_time_format = %Y %m %d %H:%M:%S The date and time format is a business, the main thing is to use the same everywhere.
log_file = /var/log/snmptt/snmptt.log log_system_file = /var/log/snmptt/snmpttsystem.log unknown_trap_log_enable = 1 unknown_trap_log_file = /var/log/snmptt/snmpttunknown.log Why is the log not the same as in many articles on the Internet? Because in the dock it was said “If systemd parameter PrivateTmp is used, this file is unlikely to work in / tmp.”, I don’t want to get up on the rake once again if I’m warned about this beforehand, so I’ll immediately change it to the normal path to the file.
Next, go to /etc/snmp/snmptt.conf, remove everything we don’t need and / or do not understand, leave only this:
EVENT ospfNbrStateChange .1.3.6.1.2.1.14.16.2.2 "OSPF" Normal FORMAT ZBXTRAP $aA OSPF neighbor with IP addr $2 changed state to $5 In this form, because Zabbix will expect exactly this format in the log. Where do $ 2 and $ 5 come from? If you look at the format of a TRAP message , we’ll see:
Object ospfNbrStateChange OID 1.3.6.1.2.1.14.16.2.2 MIB OSPF-TRAP-MIB ; Trap Components ospfRouterId ospfNbrIpAddr ospfNbrAddressLessIndex ospfNbrRtrId ospfNbrState These Trap Components are the parameters that can be pushed into the log format in the order of $ 1, $ 2 ...
During clashes with all this good, I noticed that after changing the SNMPTT settings, it was as if the changes were not applied. It turned out that after changing them, snmpt.serivce should not be restarted, but snmpd.service - this nuance decently drank my blood and drank nerves during debug.
Check that all the demons are running:
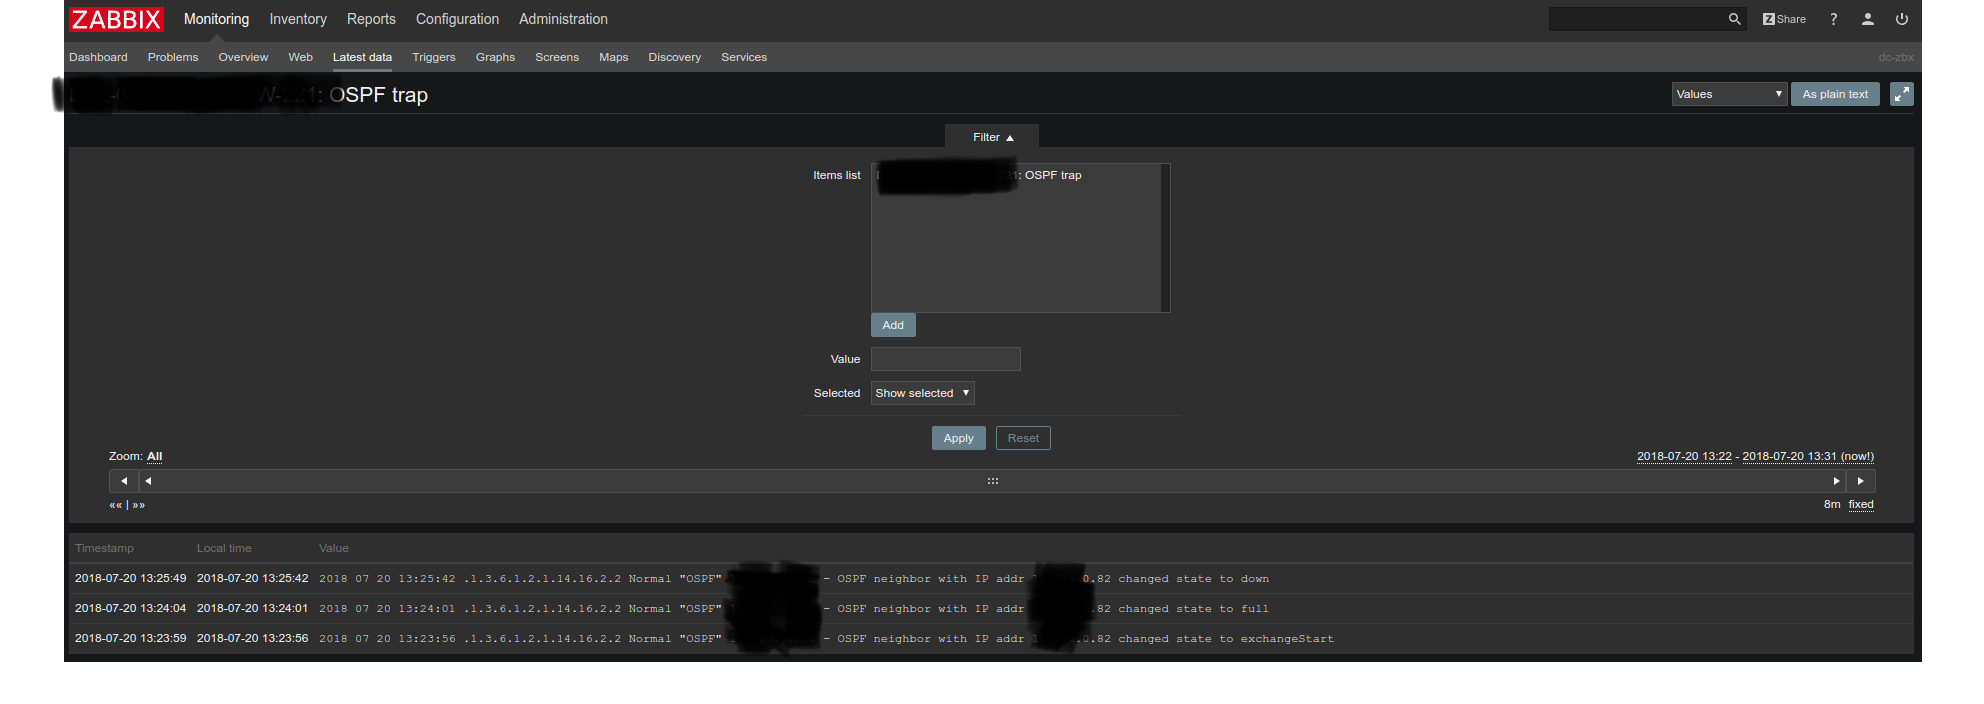
systemctl status snmpd snmptrapd snmptt If everything is ok, try again to break OSPF and go to the log /var/log/snmptt/snmptt.log, it will be like this:
2018 07 19 15:10:52 .1.3.6.1.2.1.14.16.2.2 Normal "OSPF" 192.168.192.169 - ZBXTRAP 192.168.192.169 192.168.192.169 OSPF neighbor with IP addr 10.216.0.82 changed state to down 2018 07 19 15:12:28 .1.3.6.1.2.1.14.16.2.2 Normal "OSPF" 192.168.192.169 - ZBXTRAP 192.168.192.169 192.168.192.169 OSPF neighbor with IP addr 10.216.0.82 changed state to exchangeStart 2018 07 19 15:12:34 .1.3.6.1.2.1.14.16.2.2 Normal "OSPF" 192.168.192.169 - ZBXTRAP 192.168.192.169 192.168.192.169 OSPF neighbor with IP addr 10.216.0.82 changed state to full 2018 07 19 15:22:41 .1.3.6.1.2.1.14.16.2.2 Normal "OSPF" 192.168.192.169 - ZBXTRAP 192.168.192.169 OSPF neighbor with IP addr 10.216.0.82 changed state to down 2018 07 19 15:25:38 .1.3.6.1.2.1.14.16.2.2 Normal "OSPF" 192.168.192.169 - ZBXTRAP 192.168.192.169 OSPF neighbor with IP addr 10.216.0.82 changed state to exchangeStart Those TRAPs that we have not configured in the /etc/snmp/snmptt.conf config will get into the /var/log/snmptt/snmpttunknown.log log, but only from the piece of hardware for which the correct user and engineID are configured in the same config. That is, TRAP will just silently be dropped from the left glands, if you want matane and debriefing, then here you have an unusually imputed net-snmp dock, the difference between TRAP and INFORM is well described, running ahead, it is better to use INFORM, t. to. there is some kind of delivery control there, and it also works via SNMP via UDP.
And only now we climb to customize our monitoring.
Zabbix configuration
First of all, make sure that in the /etc/zabbix/zabbix_server.conf configuration file the monitor is set to the correct SNMPTT log and Zabbix starts at least one SNMP Trapper:
SNMPTrapperFile=/var/log/snmptt/snmptt.log
StartSNMPTrapper=1
For starters, I created Item right on the host, in order to quickly and easily catch special effects, I’ll write here how to create a template right away, because you should always use templates whenever possible. I'll show you the pictures, the copy-pasteing freebie is over, but I'll paint the places that need attention.
Create a template:

Here we just give the sane name
Create Item

Important - the key should be such that what is indicated in square brackets is what Zabbix will look for in the log, we set up the log format in /etc/snmp/snmptt.conf and wrote there:
EVENT ospfNbrStateChange .1.3.6.1.2.1.14.16.2.2 "OSPF" Normal FORMAT ZBXTRAP $aA OSPF neighbor with IP addr $2 changed state to $5 Actually in the log this magic word "OSPF" and appears:
2018 07 19 15:25:38 .1.3.6.1.2.1.14.16.2.2 Normal "OSPF" 192.168.192.169 - ZBXTRAP 192.168.192.169 OSPF neighbor with IP addr 10.216.0.82 changed state to exchangeStart We defined the date format in the /etc/snmp/snmptt.ini config:
date_time_format = %Y %m %d %H:%M:%S What I wrote above - use any format that is convenient for you, the main thing is that it matches in the right places.
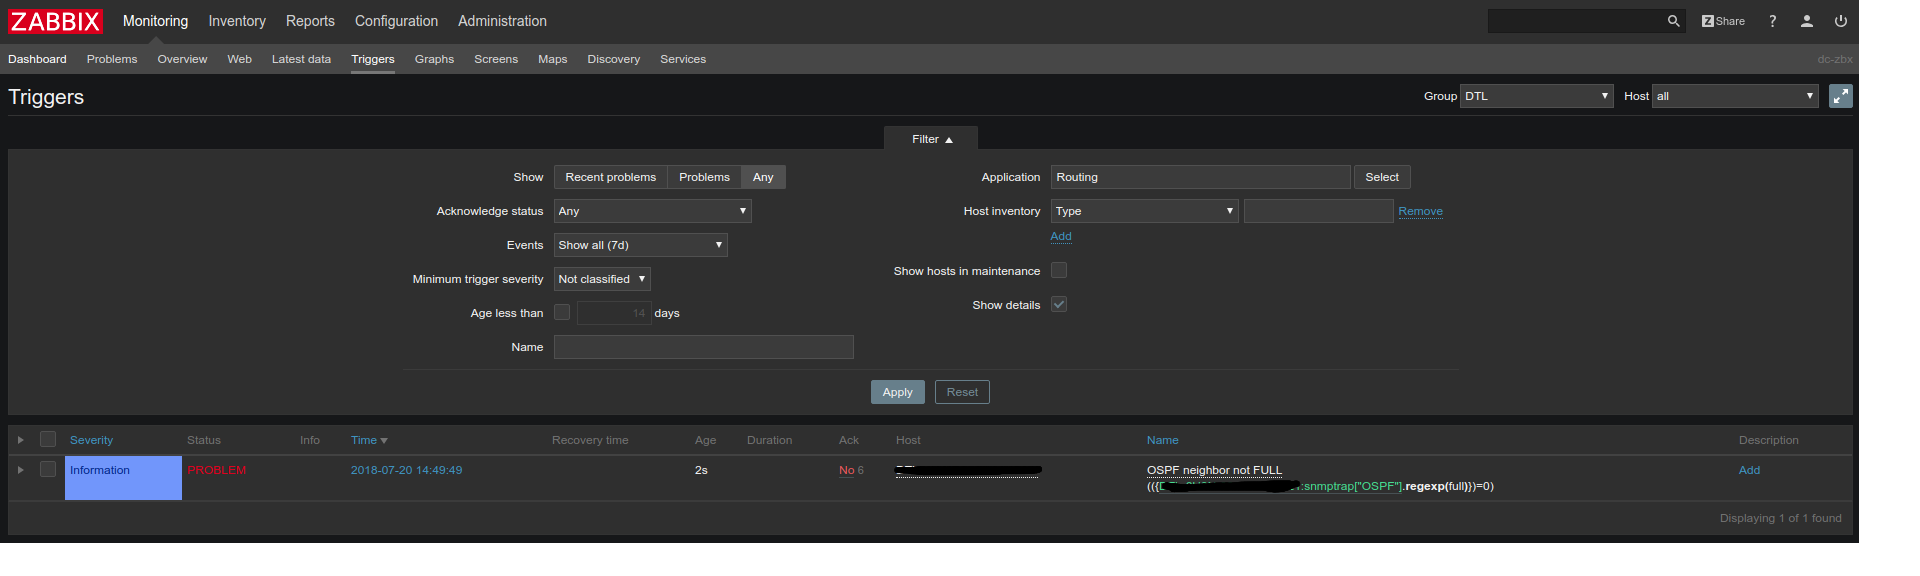
Create Trigger

The neighbor may have several states :
1 : down 2 : attempt 3 : init 4 : twoWay 5 : exchangeStart 6 : exchange 7 : loading 8 : full In general, it is not fundamentally what kind of state the neighbor is in, if this state is not FULL, since in order to diagnose this, you will still have to go to a piece of iron, read logs, enter some commands. So the trigger will be one and will only be excited when the state of the neighbor in the TRAP is not FULL.
Before hanging the template on a specific host, make sure that the host has the correct SNMP interface configured with the correct IP address, otherwise the traps will be in the /var/log/snmptt/snmptt.log log, but Zabbix will not “bind” them to the host. In this case, in the Zabbix server log /var/log/zabbix/zabbix_server.log there will be a message like:
19972:20180720:091722.896 unmatched trap received from "192.168.192.169": 2018 07 20 09:17:21 .1.3.6.1.2.1.14.16.2.2 Normal "OSPF" 192.168.192.169 - OSPF neighbor with IP addr 10.64.0.10 changed state to exchangeStart We go to the Latest data, we see
The trigger also worked
Now we put two neighbors
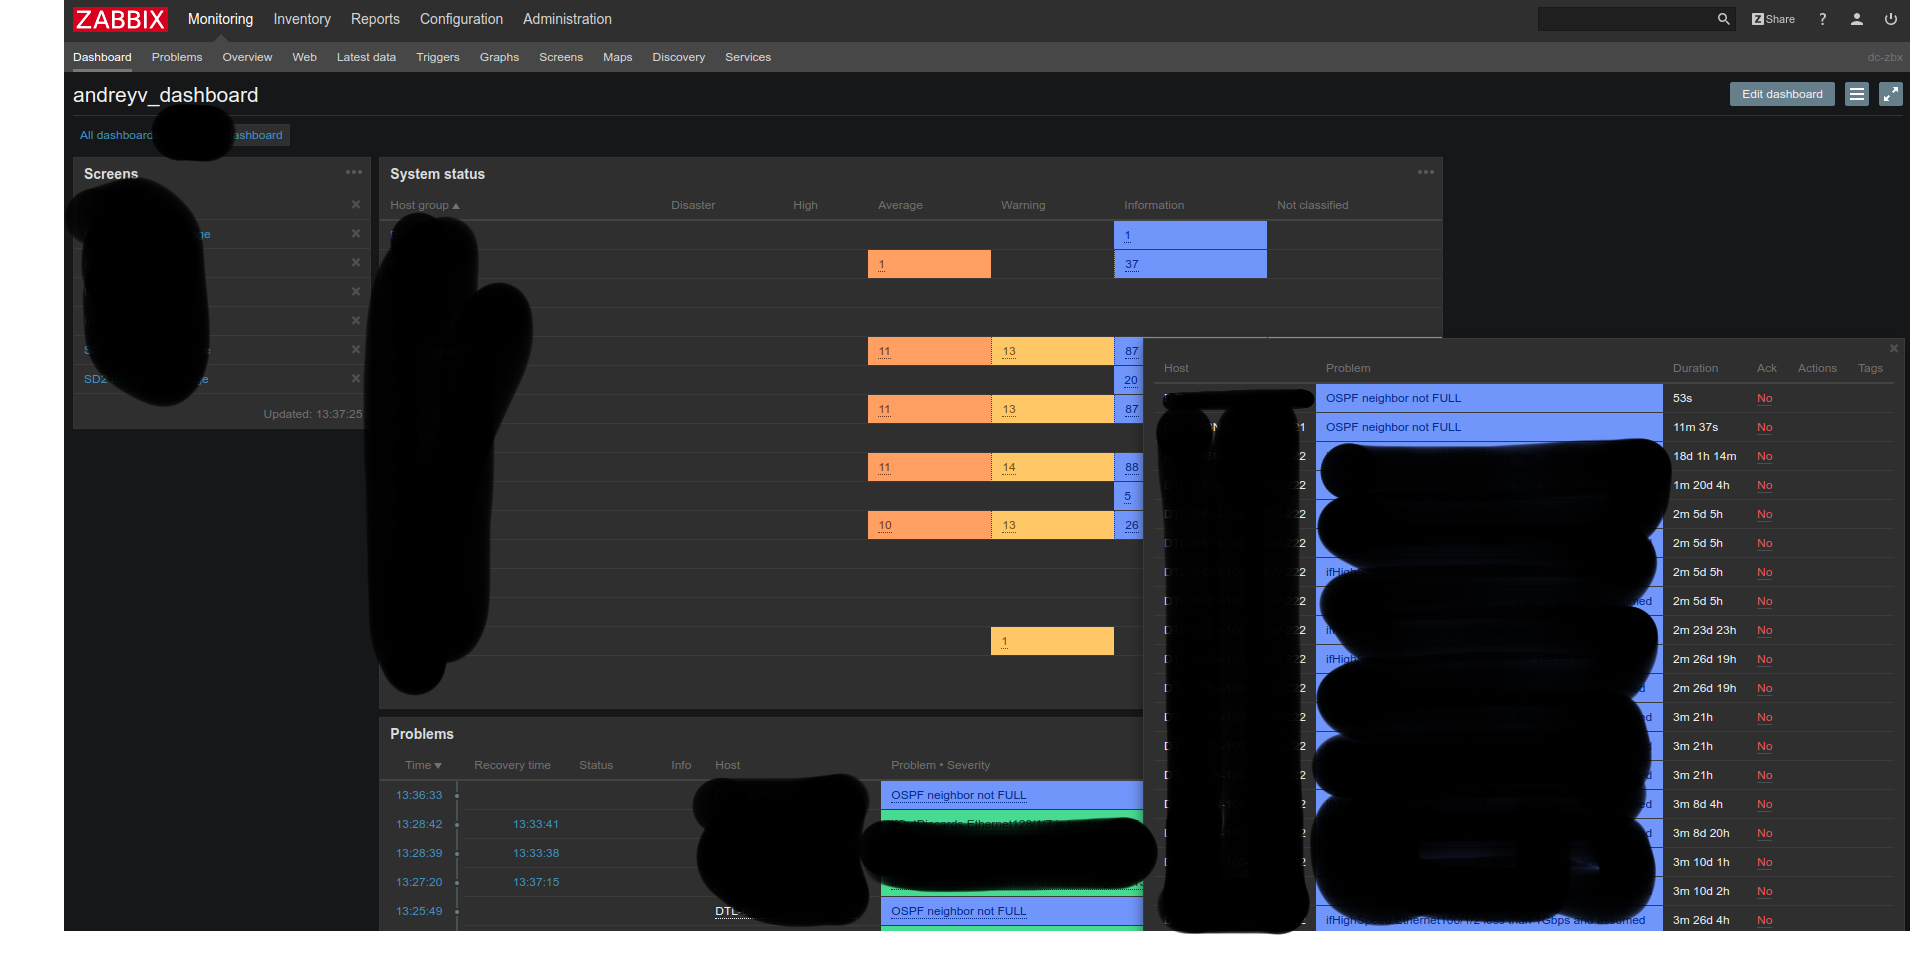
In the dashboard, we see that two problems have happened, this is good, and even two letters will arrive on this topic with a customized alert.
Everything is great, everything works, and here is the cherry on the cake at the end.
Despair
Now we take and raise one neighbor. In this case, both problems will disappear in the dashboard at once. This is not a bug, this is a feature. I casually noticed such nuance when testing a template. As a result, it turns out that if we have several neighbors fall down, and then one of them rises, or even if a neighbor rises, which previously did not exist at all, then monitoring will turn green.
Of course, you can customize Item to track a specific neighbor, you can still scripting something, you can return to SNMP contexts from the very beginning of the article. Another thought is to draw a script that will go through the SSH / API to network glands, collect info about all neighbors, make a “working” impression, analyze the diff between checks and write to the log what's wrong, then you can feed the log to monitoring ... difficult. I wanted a minimum of crutches and custom. If you know the imputed way to solve this problem or you think that I did everything wrong, again, I ask in the commentary, but rather in the response article.
Of course, you can customize Item to track a specific neighbor, you can still scripting something, you can return to SNMP contexts from the very beginning of the article. Another thought is to draw a script that will go through the SSH / API to network glands, collect info about all neighbors, make a “working” impression, analyze the diff between checks and write to the log what's wrong, then you can feed the log to monitoring ... difficult. I wanted a minimum of crutches and custom. If you know the imputed way to solve this problem or you think that I did everything wrong, again, I ask in the commentary, but rather in the response article.
UPD: colleagues advised to still understand and try to implement their plans using SNMP contexts . There is demand, there will be supply. Looking ahead, I can say - the devil is not so bad, let's go.
On a network piece of iron draw a magic command:
snmp-server context {snmp context name} instance {protocol instance} vrf {vrf name}Names of parameters require explanation
{snmp context name} - the name of the SNMP context that we will use in requests.
{protocol instance} and {vrf name} are taken from the config of the configured OSPF process:
router ospf {protocol instance}
..
vrf {vrf name}
..
There was a fear that after such settings, we already break the configured Item via SNMP with an empty context, but checked that the setting affects only the OSPF-MIB data output, for example, everything from the IF-MIB section continues to be given as before with an empty context. If you do not have a Nexus, I recommend checking this point once again - it is likely that the behavior will be different.
Now we will twist the template in Zabbix.
You must create a new Discovery rule with context:
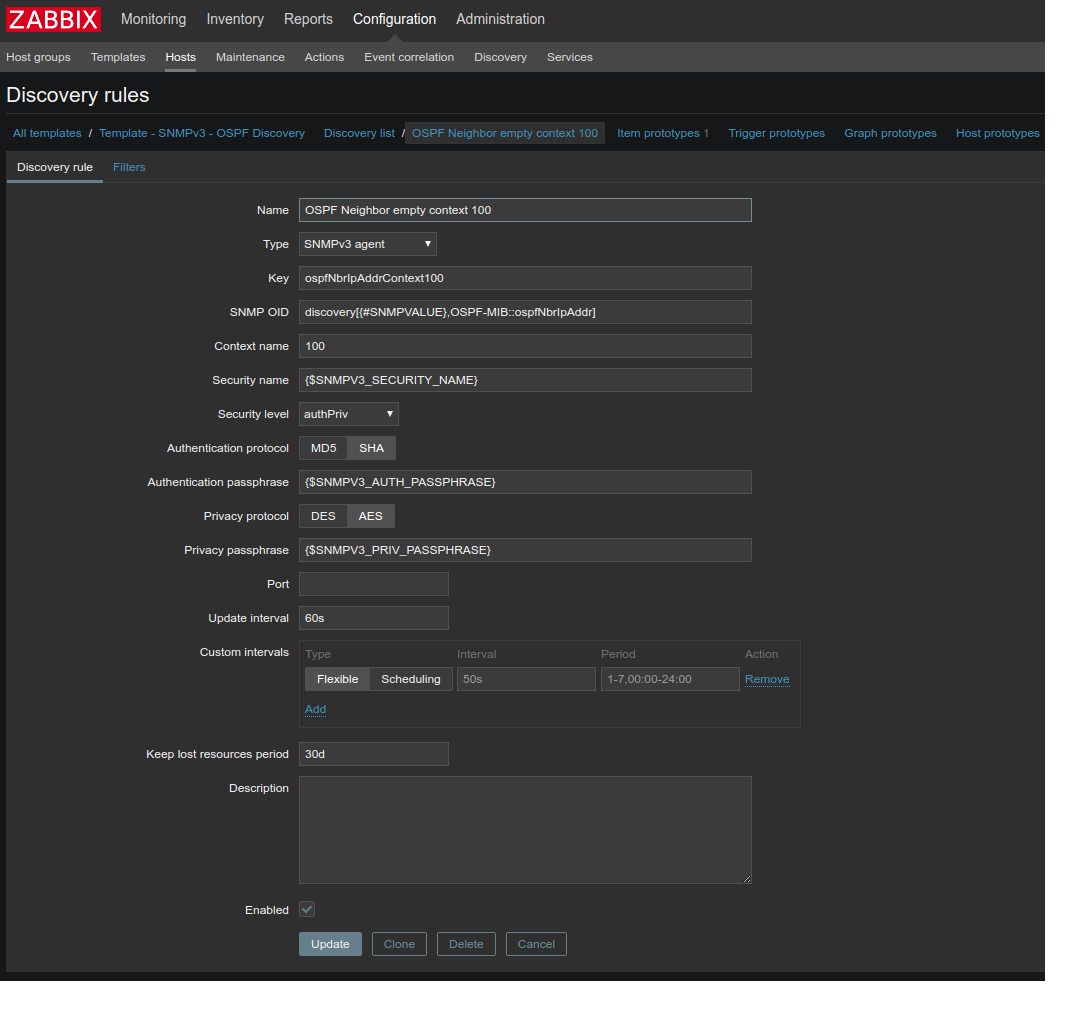
New Item prototype with context too

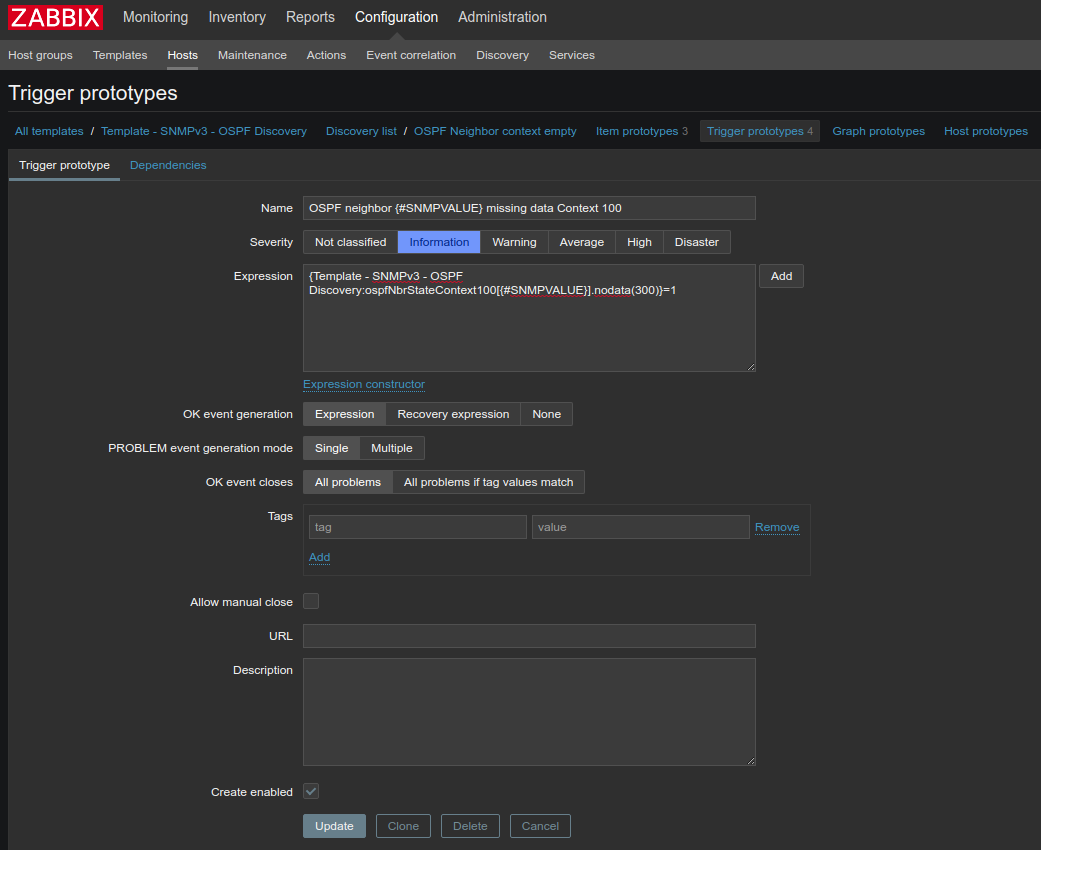
And two triggers - the first - for the alarm in case the neighbor is in any state except FULL:
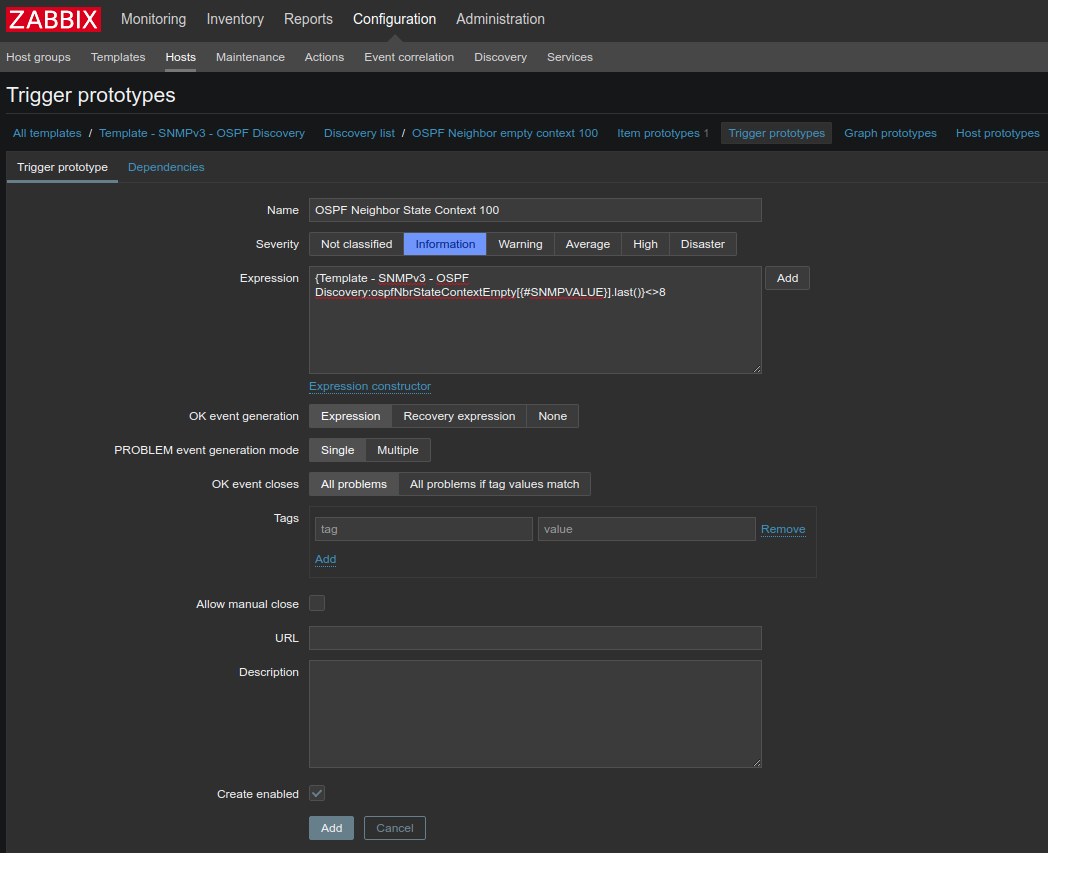
and the second - if the neighbor is gone:
Source: https://habr.com/ru/post/417813/
All Articles