The Intel Core i7-8086K (Part 2)
Part 1 >> Part 2 >> Part 3 >> Part 4
Our first test suite is general system tests. This test suite is designed to emulate for the most part what people usually do with a computer, such as opening large files or processing small stacks of data. This is somewhat different from our office testing, where industry standards testing is used. Some of the tests here are relatively new and unusual.
')
One of the most interesting loads, which is used at our booth in the last quarters, is FCAT - a tool that we use to measure delays in games due to dropped or missing frames. The FCAT process requires the inclusion of a color overlay into the game, recording the gameplay and subsequent analysis of the video file using appropriate software. Such software is usually single-threaded, since the video is in a primitive RAW format, which implies a large file size and requires moving a large amount of data. For our test, we take a 90-second record of the Rise of the Tomb Raider test running on a GTX 980 Ti at 1440p, which is about 21 GB, and measure the time required for processing using a visual analysis tool.
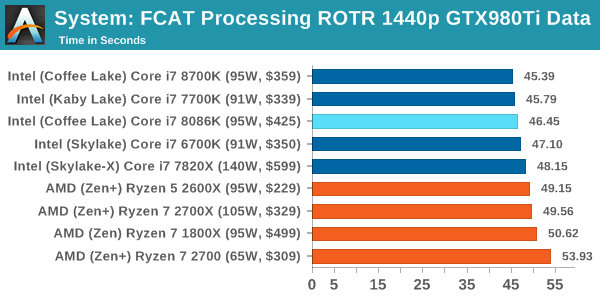
FCAT single-threaded test, but even in this test the 5.0 GHz processor is not on top.
Many emulators are connected to a single processor performance of the processor, and general reports, as a rule, suggest that Haswell will significantly improve the performance of the emulator. This benchmark launches a Wii program in which the beam tracks a complex three-dimensional scene inside the Dolphin Wii emulator. The results of this test are a completely reliable indicator of the speed of Dolphin processor emulation, which is an intense single-core task that uses most aspects of the processor. The results are shown in minutes, where the Wii itself showed a result of 17.53 minutes (1052 seconds).
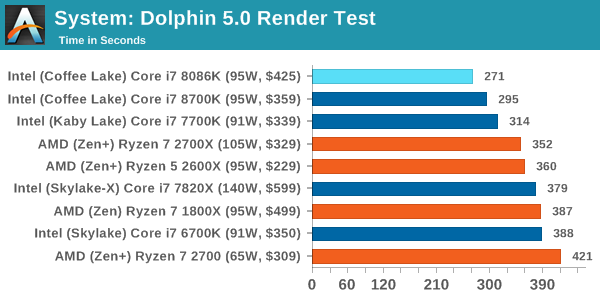
In this test, the vaunted 5.0 GHz hit, and the 8086K sets a record for Dolphin.
This is the latest version of the 3DPM benchmark we wrote. The goal of 3DPM is to simulate partially optimized scientific algorithms taken directly from my doctoral dissertation. Version 2.1 differs from 2.0 in that it transfers the basic structures of particles by reference, not by value, and reduces the number of double-> float-> double conversions performed by the compiler. This gives an acceleration of 25% compared with version 2.0, which means new data.
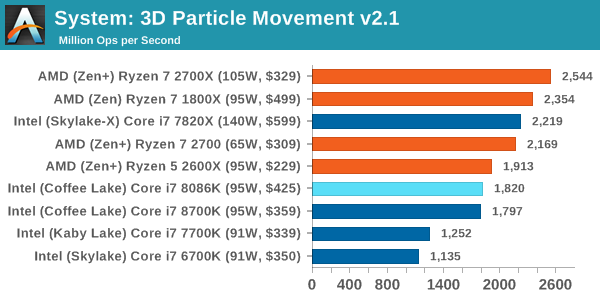
The 3DPM 8086K shows itself on par with the 8700K.
Although outdated for a couple of years, DigiCortex software is a home project for visualizing the activity of neurons and synapses in the brain. The software comes with various benchmark tests, and we take a small benchmark that runs a brain simulation for 32 thousand neurons / 1.8 billion synapses. The test results indicate the ability of the system to emulate in real time, which means that any result above one is suitable for emulation. The benchmark offers a "without emitting neurons by synapses" mode, which, in fact, shows the speed of the DRAM and the bus. We take the “firing” mode, which adds CPU load every time neurons are launched.
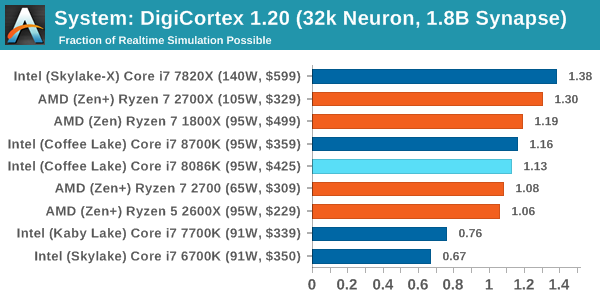
Despite the higher single-core frequency, this test, limited to DRAM, appears to load another core and does not allow 8086K to reach 5.0 GHz.
Photoscan remained in our test suite from the previous test version, but now we are working in Windows 10, so features like Speed Shift on the latest processors come into play. The concept of Photoscan is the transformation of a set of 2D images into a 3D model — therefore, the more detailed the images are, and the more they are, the better the model. The algorithm consists of four stages: several single-threaded and several multi-threaded, and also has some dependence on the cache and memory. For some more varied workflows with multi-threaded features, options such as Speed Shift and XFR can take advantage of standby or idle CPUs, giving a significant performance boost on new micro-architectures.
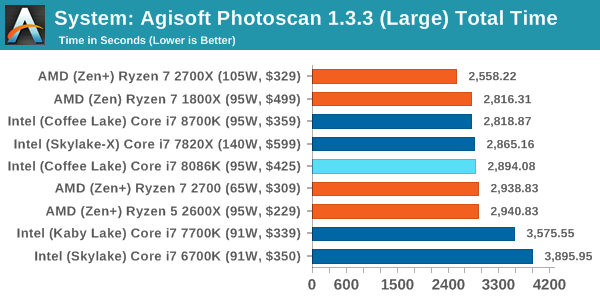
Agisoft has variable multithreading, but 8086K still lags slightly behind 8700K.
Rendering tests is a long-recognized favorite of reviews and tests, because the code used by rendering packages is usually optimized to squeeze every bit of performance. Sometimes program rendering also depends heavily on memory — when you have many threads carrying tons of data, a memory with a low latency response can be the key to everything. Here we take some of the usual rendering packages for Windows 10, as well as some new interesting tests.
Corona is a standalone package designed to support software, such as 3ds Max and Maya, by photorealism using ray tracing. It's simple - you direct the rays, you get the pixels. Ok, a bit more complicated, but this benchmark renders a fixed scene six times, and gives results in terms of time and number of rays per second. The official benchmark tables present user results in terms of time, but I believe that “rays per second” is the best indicator (and in general, the results, where “more means better”, are easier to explain). Corona likes to pile up threads, so the results are strongly dependent on the number of threads.
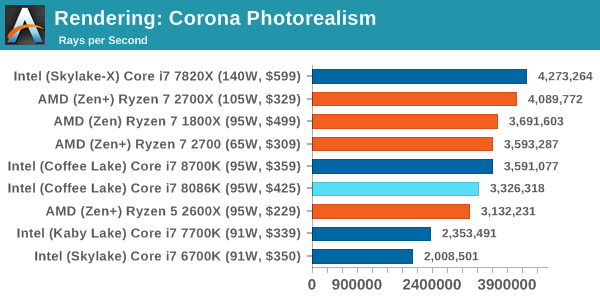
Corona is a fully multi-threaded test, and it is therefore surprising to see the 8086K lag behind the 8700K. This is probably due to the fact that the borrowed test system does not ideally meet our testing standard.
An old man in the world of rendering tests, Blender is still a very popular tool. We were able to run the standard workload on the February 5 Blender build, and measure the time needed to render the first frame of the scene. Blender is one of the largest open source tools, which means that both AMD and Intel are actively working to help improve the code base, which can be both beneficial and detrimental to their own microarchitecture.
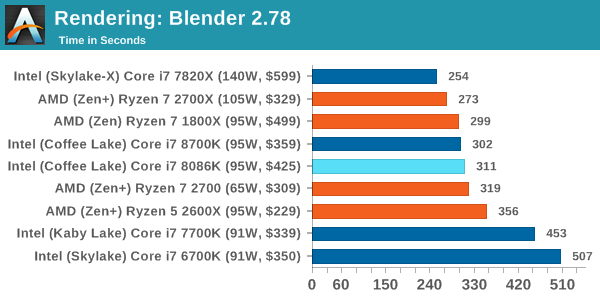
Blender also likes to create streams, and 8086K, as before, is behind the twin.
As a synthetic test, LuxMark may seem somewhat unreliable as a visualization tool, given that it is mainly used for testing graphics processors. However, it offers both OpenCL and standard C ++ mode. In this case, in addition to the comparison in each coding of the cores and IPC, we can see that the C ++ code and OpenCL show different performance on the same processors.
Another regular benchmark in most sets is POV-Ray. Another ray tracer with a long history. As it often happens, during the preparation of AMD for the launch of Ryzen, the code base began to be actively updated, the developers made changes to the code and released new updates. Our test version was taken just before the start of such events, but over time we see that the POV-Ray code is being adjusted to meet new requirements.
Almost identical results for the 8086K and 8700K in the POV-Ray test.
The latest version of CineBench was one of those programs that were used everywhere, in particular, as an indicator of the performance of a single thread. A high IPC level and high frequency give Single-Threading performance, while having good scaling and many cores is the key to Multi-Threading success.
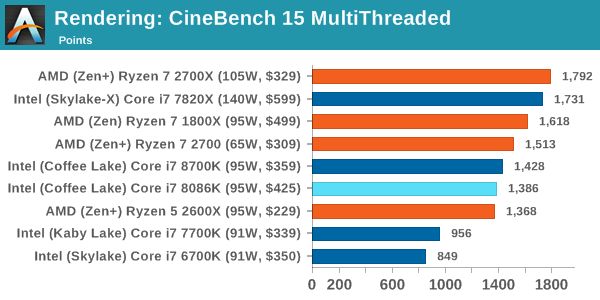
8086K gets the title of new champion in single-threaded testing in the CineBench R15 ST, but slightly lags behind the 8700K in multi-threaded testing.
One of the interesting elements of modern processors is the coding performance. This includes encryption / decryption, as well as transcoding video from one video format to another. In the case of encryption / decryption, performance is still relevant for encrypting sensitive data "on the fly" - the process by which modern devices typically provide software security. Recently, the use of video transcoding to fit the quality, file size and resolution of a video file is experiencing a real boom. This is necessary to fit the video for the consumer device, or for game streamers who wish to download the transcoded video stream from the camera in real-time mode. As we move to live 3D video, this task will be even higher priority, and it turns out that the speed of certain algorithms is determined by the content input / output function.
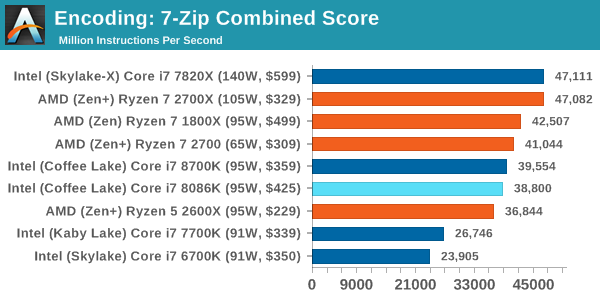
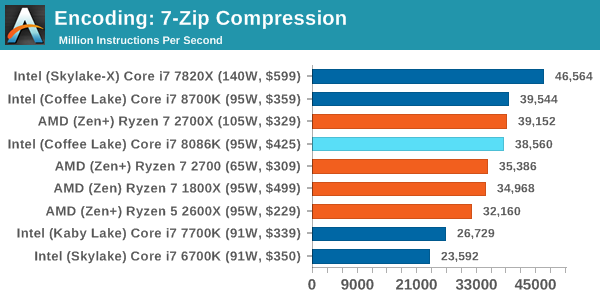
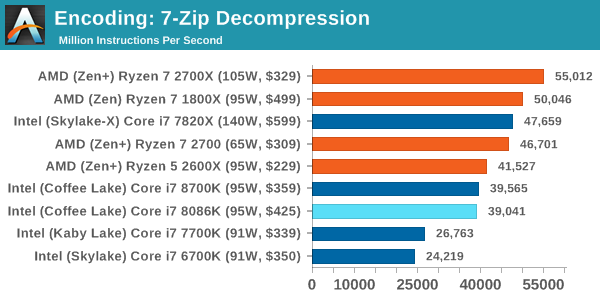
One of the frivolous archivers, allowing to evaluate the performance of processors, is 7-Zip. It is open source licensed and is a fast and easy-to-use tool for advanced users. We run the test mode via the command line, execute four cycles and get the result.
Again, there is a confrontation with the 8700K, but the new 8086 is a bit behind.
For the 2017 test package, we will use the latest version of WinRAR in our archiver test. WinRAR is more user-friendly in some aspects than 7-Zip, so we decided to include it in the package. Instead of using the benchmark mode, as is the case with 7-Zip, here we take a set of files representing a common stack (33 video files of 1.37 GB, 2834 smaller files in 370 folders of 150 MB each) in compressible and incompressible formats. The results shown are the time taken to encode the file. Due to DRAM caching, we run the test 10 times and get the average for the last five launches when the benchmark is in a steady state.
And this is another test where the 8086K is inferior to the “unlimited” 8700K.
Algorithms that use AES encoding have spread widely throughout the world as a ubiquitous encryption tool. However, this is another test-for-CPU, and modern CPUs have an extension of the AES command system to increase encryption performance. We often consider scaling both in frequency and in nuclei using this benchmark. We use the latest version of TrueCrypt and run it in benchmark mode with 1 GB of data in DRAM. The results shown are the mean GB / s for encryption and decryption.
When coding AES, we got literally identical results.
As mentioned above, video transcoding (both encoding and decoding) is a hot topic in terms of performance, as the pace of new content creation increases. The first assumption is a change in the video formatting standard, which can occur with or without loss of quality. It is also possible to reduce the quality of the video in favor of the file size. Along with Google's favorite codec, VP9, there are two other frequently used ones: H264, the old codec, is almost everywhere and optimized for 1080p video, and HEVC (or H265), which aims to provide the same quality as H264, but with lower file size (or higher quality for the same size). HEVC is important because it is capable of streaming video as 4k, which means transferring fewer bits for the same quality content.
Handbrake is the preferred transcoding tool, so our test mode covers three areas.
H264 low quality / resolution: here we will re-encode 2-hour 640x266 H264 video and change the encoding from Main profile to High profile using the very-fast preset.

H264 high quality / resolution: a similar test, but this time we take a ten-minute double 4K file (3840x4320) displayed at 60 Hz and recoded from Main to High using a very-fast preset.
HEVC test: using the same video in HQ, we change the resolution and codec of the original video from 4K60 to H264 to 4K60 HEVC.

Office programs that we use for benchmarking are not specific programs, but industry standard tests, they have weight in a professional environment. The purpose of these tests is to use a set of programs and methods that a normal office user may encounter, for example, video conferencing, document editing, architectural modeling, and so on and so forth.
Our new compilation test uses Windows 10 Pro, VS Community 2015.3 with Win10 SDK to compile Chromium’s nightly build. We prepared a test for assembly at the end of March 2017, and in our test we launch a new full compilation. Compiling is a typical example of a multi-threaded workload — some compilation and binding processes are linear, while other parts are multi-threaded.
This is another case where I think that our improvised test bench played a big role, and I would like to repeat it later on my standard stand. As compilation gives heavy loading not only on the processor.
According to numerous requests, GeekBench 4 is now included in our package. GB4 is a synthetic test using algorithms that are often found in high-performance workloads, as well as a series of memory-oriented tests. The biggest achievement of GB4 is the output of the entire test result as a single figure, which, apparently, its fans like, although this result is not always easy to use to compare performance in real conditions.

As in CineBench, the Core i7-8086K takes over the synthetic single-threaded test.
Despite the fact that PCMark was first born in 2008/2009, Futuremark supports PCMark8. On the scale of complex tasks, PCMark is more focused on the low-interest range of professional workloads, which makes it a good indicator of what people consider “office work”. We run the benchmark from the command line in the "traditional" mode, that is, C ++ without OpenCL, to remove the graphics card from the equation and focus exclusively on the processor. PCMark8 offers Home, Work, and Creative workloads, with some software tests common and others unique to each test suite.
Here, the 8,086K finally overtakes its 8700K brother, although only slightly.
Our outdated tests are benchmarks that were once ahead of their time. Some of them are synthetic standards in industry, and we have data coming in for 10 years. All the data here was re-launched in Windows 10, and we plan to return to several generations of components to see how performance has developed.
3DPM is a test written by us that applies basic 3D motion algorithms used in simulations of Brownian motion and tests them for speed. High performance floating point, MHz and IPC will show themselves in a single-stream version, while the multi-threaded version works with threads and loves many cores. This is the original version, written in the style of a typical non-computer student coding an algorithm for a theoretical problem. It comes without any unobvious optimizations that are not yet performed by the compiler, for example, false sharing.
Cinebench is a well-known performance measurement tool related to MAXON Cinema 4D animation software. Cinebench has been optimized for a decade and focuses only on processor power. This means that if there is a mismatch in bandwidth characteristics, Cinebench is likely to show this discrepancy. Perhaps other software does not use all the available tools to load the processor, so the relevance of the test for the real world may be purely academic, but given our large database for Cinebench, it’s difficult to ignore a small five-minute test. In this test, we run the current version 15, as well as the old 11.5 and 10 because of our saved data.


Similarly, the x264 HD 3.0 package that we use here is also stored for historical regression data. The latest version is 5.0.1, and it encodes a 1080p video into a high-quality x264 file. Version 3.0 performs the same test in the 720p file, and in most cases software performance reaches the limit for high-end processors, but still works well for the middle and lower level. In addition, this version is only a few minutes, while the latter can take more than 90 minutes.
Thank you for staying with us. Do you like our articles? Want to see more interesting materials? Support us by placing an order or recommending to friends, 30% discount for Habr users on a unique analogue of the entry-level servers that we invented for you: The whole truth about VPS (KVM) E5-2650 v4 (6 Cores) 10GB DDR4 240GB SSD 1Gbps from $ 20 or how to share the server? (Options are available with RAID1 and RAID10, up to 24 cores and up to 40GB DDR4).
Dell R730xd 2 times cheaper? Only we have 2 x Intel Dodeca-Core Xeon E5-2650v4 128GB DDR4 6x480GB SSD 1Gbps 100 TV from $ 249 in the Netherlands and the USA! Read about How to build an infrastructure building. class c using servers Dell R730xd E5-2650 v4 worth 9000 euros for a penny?
CPU System Tests
Our first test suite is general system tests. This test suite is designed to emulate for the most part what people usually do with a computer, such as opening large files or processing small stacks of data. This is somewhat different from our office testing, where industry standards testing is used. Some of the tests here are relatively new and unusual.
')
FCAT processing: link
One of the most interesting loads, which is used at our booth in the last quarters, is FCAT - a tool that we use to measure delays in games due to dropped or missing frames. The FCAT process requires the inclusion of a color overlay into the game, recording the gameplay and subsequent analysis of the video file using appropriate software. Such software is usually single-threaded, since the video is in a primitive RAW format, which implies a large file size and requires moving a large amount of data. For our test, we take a 90-second record of the Rise of the Tomb Raider test running on a GTX 980 Ti at 1440p, which is about 21 GB, and measure the time required for processing using a visual analysis tool.
FCAT single-threaded test, but even in this test the 5.0 GHz processor is not on top.
Dolphin Benchmark: link
Many emulators are connected to a single processor performance of the processor, and general reports, as a rule, suggest that Haswell will significantly improve the performance of the emulator. This benchmark launches a Wii program in which the beam tracks a complex three-dimensional scene inside the Dolphin Wii emulator. The results of this test are a completely reliable indicator of the speed of Dolphin processor emulation, which is an intense single-core task that uses most aspects of the processor. The results are shown in minutes, where the Wii itself showed a result of 17.53 minutes (1052 seconds).
In this test, the vaunted 5.0 GHz hit, and the 8086K sets a record for Dolphin.
3D Movement Algorithm Test v2.1: link
This is the latest version of the 3DPM benchmark we wrote. The goal of 3DPM is to simulate partially optimized scientific algorithms taken directly from my doctoral dissertation. Version 2.1 differs from 2.0 in that it transfers the basic structures of particles by reference, not by value, and reduces the number of double-> float-> double conversions performed by the compiler. This gives an acceleration of 25% compared with version 2.0, which means new data.
The 3DPM 8086K shows itself on par with the 8700K.
DigiCortex v1.20: link
Although outdated for a couple of years, DigiCortex software is a home project for visualizing the activity of neurons and synapses in the brain. The software comes with various benchmark tests, and we take a small benchmark that runs a brain simulation for 32 thousand neurons / 1.8 billion synapses. The test results indicate the ability of the system to emulate in real time, which means that any result above one is suitable for emulation. The benchmark offers a "without emitting neurons by synapses" mode, which, in fact, shows the speed of the DRAM and the bus. We take the “firing” mode, which adds CPU load every time neurons are launched.
Despite the higher single-core frequency, this test, limited to DRAM, appears to load another core and does not allow 8086K to reach 5.0 GHz.
Agisoft Photoscan 1.3.3: link
Photoscan remained in our test suite from the previous test version, but now we are working in Windows 10, so features like Speed Shift on the latest processors come into play. The concept of Photoscan is the transformation of a set of 2D images into a 3D model — therefore, the more detailed the images are, and the more they are, the better the model. The algorithm consists of four stages: several single-threaded and several multi-threaded, and also has some dependence on the cache and memory. For some more varied workflows with multi-threaded features, options such as Speed Shift and XFR can take advantage of standby or idle CPUs, giving a significant performance boost on new micro-architectures.
Agisoft has variable multithreading, but 8086K still lags slightly behind 8700K.
CPU Rendering Tests
Rendering tests is a long-recognized favorite of reviews and tests, because the code used by rendering packages is usually optimized to squeeze every bit of performance. Sometimes program rendering also depends heavily on memory — when you have many threads carrying tons of data, a memory with a low latency response can be the key to everything. Here we take some of the usual rendering packages for Windows 10, as well as some new interesting tests.
Corona 1.3: link
Corona is a standalone package designed to support software, such as 3ds Max and Maya, by photorealism using ray tracing. It's simple - you direct the rays, you get the pixels. Ok, a bit more complicated, but this benchmark renders a fixed scene six times, and gives results in terms of time and number of rays per second. The official benchmark tables present user results in terms of time, but I believe that “rays per second” is the best indicator (and in general, the results, where “more means better”, are easier to explain). Corona likes to pile up threads, so the results are strongly dependent on the number of threads.
Corona is a fully multi-threaded test, and it is therefore surprising to see the 8086K lag behind the 8700K. This is probably due to the fact that the borrowed test system does not ideally meet our testing standard.
Blender 2.78: link
An old man in the world of rendering tests, Blender is still a very popular tool. We were able to run the standard workload on the February 5 Blender build, and measure the time needed to render the first frame of the scene. Blender is one of the largest open source tools, which means that both AMD and Intel are actively working to help improve the code base, which can be both beneficial and detrimental to their own microarchitecture.
Blender also likes to create streams, and 8086K, as before, is behind the twin.
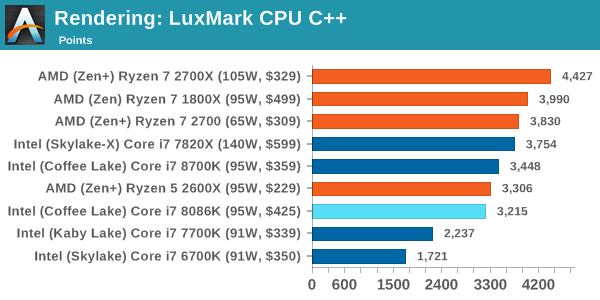
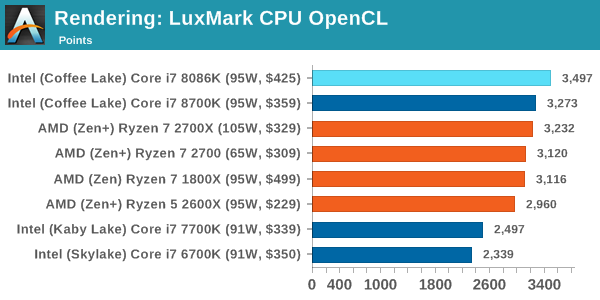
LuxMark v3.1
As a synthetic test, LuxMark may seem somewhat unreliable as a visualization tool, given that it is mainly used for testing graphics processors. However, it offers both OpenCL and standard C ++ mode. In this case, in addition to the comparison in each coding of the cores and IPC, we can see that the C ++ code and OpenCL show different performance on the same processors.
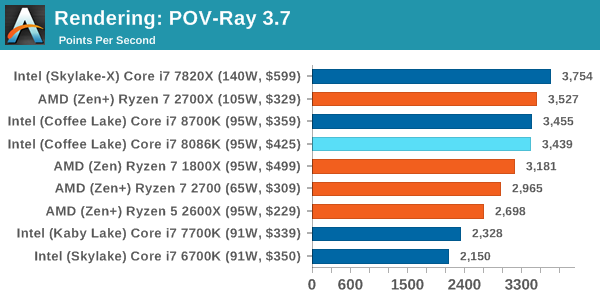
POV-Ray 3.7.1b4
Another regular benchmark in most sets is POV-Ray. Another ray tracer with a long history. As it often happens, during the preparation of AMD for the launch of Ryzen, the code base began to be actively updated, the developers made changes to the code and released new updates. Our test version was taken just before the start of such events, but over time we see that the POV-Ray code is being adjusted to meet new requirements.
Almost identical results for the 8086K and 8700K in the POV-Ray test.
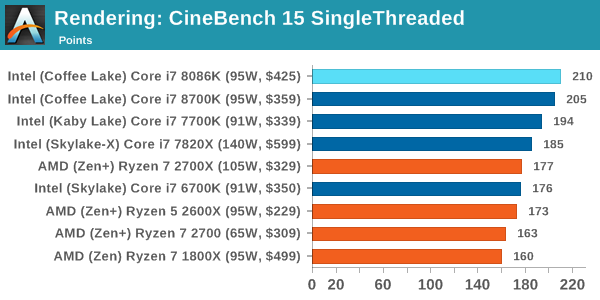
Cinebench R15: link
The latest version of CineBench was one of those programs that were used everywhere, in particular, as an indicator of the performance of a single thread. A high IPC level and high frequency give Single-Threading performance, while having good scaling and many cores is the key to Multi-Threading success.
8086K gets the title of new champion in single-threaded testing in the CineBench R15 ST, but slightly lags behind the 8700K in multi-threaded testing.
CPU Encoding Tests
One of the interesting elements of modern processors is the coding performance. This includes encryption / decryption, as well as transcoding video from one video format to another. In the case of encryption / decryption, performance is still relevant for encrypting sensitive data "on the fly" - the process by which modern devices typically provide software security. Recently, the use of video transcoding to fit the quality, file size and resolution of a video file is experiencing a real boom. This is necessary to fit the video for the consumer device, or for game streamers who wish to download the transcoded video stream from the camera in real-time mode. As we move to live 3D video, this task will be even higher priority, and it turns out that the speed of certain algorithms is determined by the content input / output function.
7-Zip 9.2
One of the frivolous archivers, allowing to evaluate the performance of processors, is 7-Zip. It is open source licensed and is a fast and easy-to-use tool for advanced users. We run the test mode via the command line, execute four cycles and get the result.
Again, there is a confrontation with the 8700K, but the new 8086 is a bit behind.
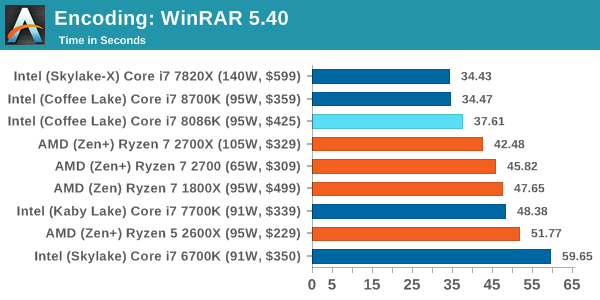
WinRAR 5.40
For the 2017 test package, we will use the latest version of WinRAR in our archiver test. WinRAR is more user-friendly in some aspects than 7-Zip, so we decided to include it in the package. Instead of using the benchmark mode, as is the case with 7-Zip, here we take a set of files representing a common stack (33 video files of 1.37 GB, 2834 smaller files in 370 folders of 150 MB each) in compressible and incompressible formats. The results shown are the time taken to encode the file. Due to DRAM caching, we run the test 10 times and get the average for the last five launches when the benchmark is in a steady state.
And this is another test where the 8086K is inferior to the “unlimited” 8700K.
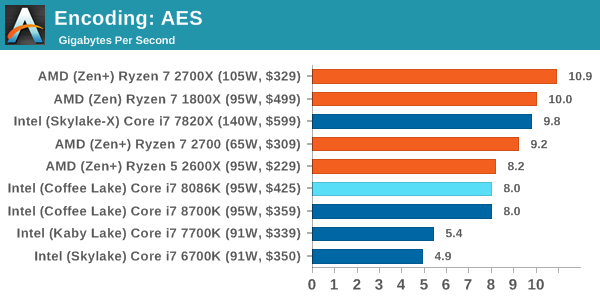
AES Encoding
Algorithms that use AES encoding have spread widely throughout the world as a ubiquitous encryption tool. However, this is another test-for-CPU, and modern CPUs have an extension of the AES command system to increase encryption performance. We often consider scaling both in frequency and in nuclei using this benchmark. We use the latest version of TrueCrypt and run it in benchmark mode with 1 GB of data in DRAM. The results shown are the mean GB / s for encryption and decryption.
When coding AES, we got literally identical results.
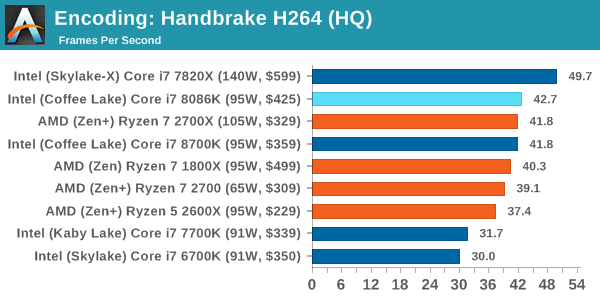
HandBrake v1.0.2 H264 and HEVC
As mentioned above, video transcoding (both encoding and decoding) is a hot topic in terms of performance, as the pace of new content creation increases. The first assumption is a change in the video formatting standard, which can occur with or without loss of quality. It is also possible to reduce the quality of the video in favor of the file size. Along with Google's favorite codec, VP9, there are two other frequently used ones: H264, the old codec, is almost everywhere and optimized for 1080p video, and HEVC (or H265), which aims to provide the same quality as H264, but with lower file size (or higher quality for the same size). HEVC is important because it is capable of streaming video as 4k, which means transferring fewer bits for the same quality content.
Handbrake is the preferred transcoding tool, so our test mode covers three areas.
H264 low quality / resolution: here we will re-encode 2-hour 640x266 H264 video and change the encoding from Main profile to High profile using the very-fast preset.
H264 high quality / resolution: a similar test, but this time we take a ten-minute double 4K file (3840x4320) displayed at 60 Hz and recoded from Main to High using a very-fast preset.
HEVC test: using the same video in HQ, we change the resolution and codec of the original video from 4K60 to H264 to 4K60 HEVC.
CPU Office Tests
Office programs that we use for benchmarking are not specific programs, but industry standard tests, they have weight in a professional environment. The purpose of these tests is to use a set of programs and methods that a normal office user may encounter, for example, video conferencing, document editing, architectural modeling, and so on and so forth.
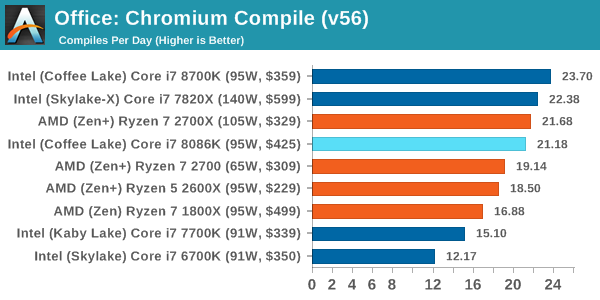
Chromium Compile (v56)
Our new compilation test uses Windows 10 Pro, VS Community 2015.3 with Win10 SDK to compile Chromium’s nightly build. We prepared a test for assembly at the end of March 2017, and in our test we launch a new full compilation. Compiling is a typical example of a multi-threaded workload — some compilation and binding processes are linear, while other parts are multi-threaded.
This is another case where I think that our improvised test bench played a big role, and I would like to repeat it later on my standard stand. As compilation gives heavy loading not only on the processor.
Geekbench4
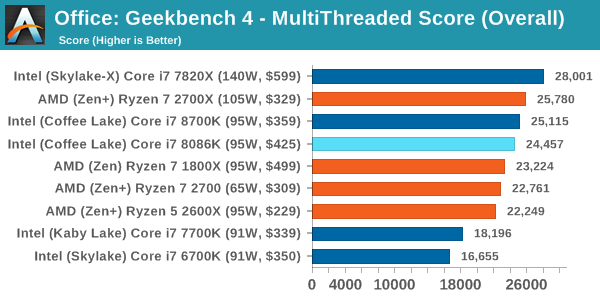
According to numerous requests, GeekBench 4 is now included in our package. GB4 is a synthetic test using algorithms that are often found in high-performance workloads, as well as a series of memory-oriented tests. The biggest achievement of GB4 is the output of the entire test result as a single figure, which, apparently, its fans like, although this result is not always easy to use to compare performance in real conditions.
As in CineBench, the Core i7-8086K takes over the synthetic single-threaded test.
PCMark8: link
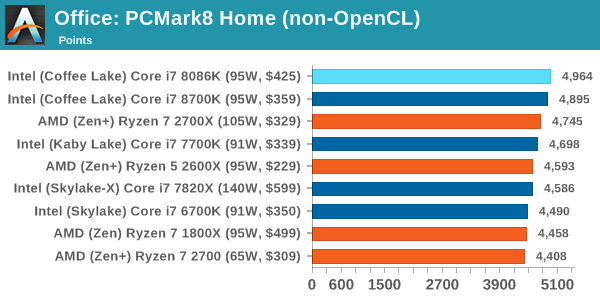
Despite the fact that PCMark was first born in 2008/2009, Futuremark supports PCMark8. On the scale of complex tasks, PCMark is more focused on the low-interest range of professional workloads, which makes it a good indicator of what people consider “office work”. We run the benchmark from the command line in the "traditional" mode, that is, C ++ without OpenCL, to remove the graphics card from the equation and focus exclusively on the processor. PCMark8 offers Home, Work, and Creative workloads, with some software tests common and others unique to each test suite.
Here, the 8,086K finally overtakes its 8700K brother, although only slightly.
CPU Legacy Tests
Our outdated tests are benchmarks that were once ahead of their time. Some of them are synthetic standards in industry, and we have data coming in for 10 years. All the data here was re-launched in Windows 10, and we plan to return to several generations of components to see how performance has developed.
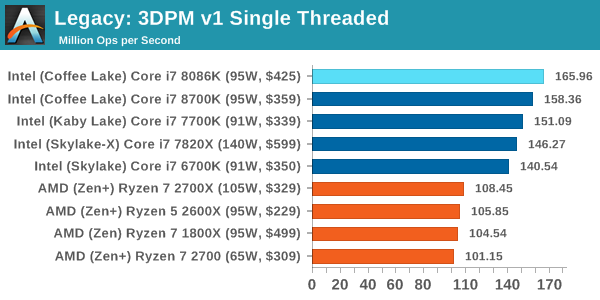
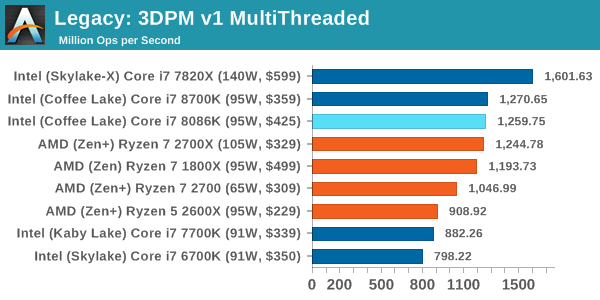
3D Particle Movement v1
3DPM is a test written by us that applies basic 3D motion algorithms used in simulations of Brownian motion and tests them for speed. High performance floating point, MHz and IPC will show themselves in a single-stream version, while the multi-threaded version works with threads and loves many cores. This is the original version, written in the style of a typical non-computer student coding an algorithm for a theoretical problem. It comes without any unobvious optimizations that are not yet performed by the compiler, for example, false sharing.
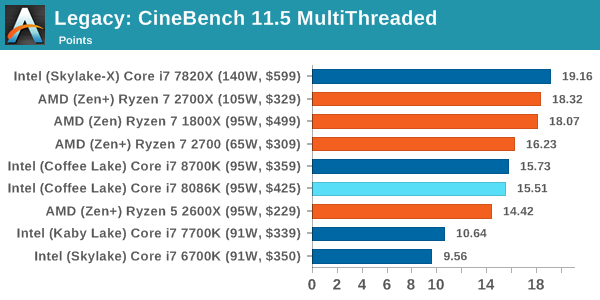
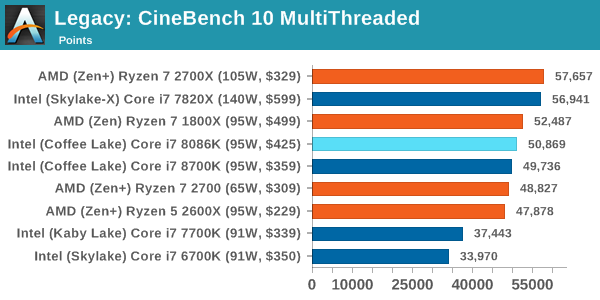
CineBench 11.5 and 10
Cinebench is a well-known performance measurement tool related to MAXON Cinema 4D animation software. Cinebench has been optimized for a decade and focuses only on processor power. This means that if there is a mismatch in bandwidth characteristics, Cinebench is likely to show this discrepancy. Perhaps other software does not use all the available tools to load the processor, so the relevance of the test for the real world may be purely academic, but given our large database for Cinebench, it’s difficult to ignore a small five-minute test. In this test, we run the current version 15, as well as the old 11.5 and 10 because of our saved data.
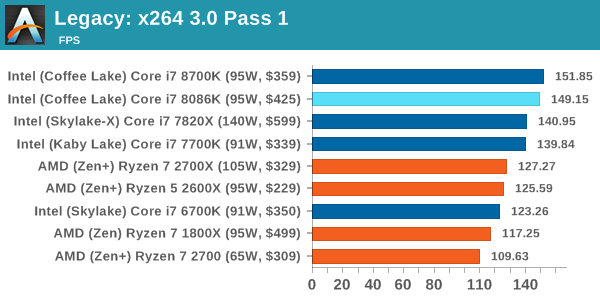
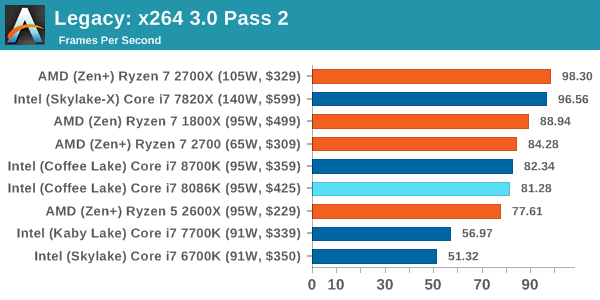
x264 HD 3.0
Similarly, the x264 HD 3.0 package that we use here is also stored for historical regression data. The latest version is 5.0.1, and it encodes a 1080p video into a high-quality x264 file. Version 3.0 performs the same test in the 720p file, and in most cases software performance reaches the limit for high-end processors, but still works well for the middle and lower level. In addition, this version is only a few minutes, while the latter can take more than 90 minutes.
Thank you for staying with us. Do you like our articles? Want to see more interesting materials? Support us by placing an order or recommending to friends, 30% discount for Habr users on a unique analogue of the entry-level servers that we invented for you: The whole truth about VPS (KVM) E5-2650 v4 (6 Cores) 10GB DDR4 240GB SSD 1Gbps from $ 20 or how to share the server? (Options are available with RAID1 and RAID10, up to 24 cores and up to 40GB DDR4).
Dell R730xd 2 times cheaper? Only we have 2 x Intel Dodeca-Core Xeon E5-2650v4 128GB DDR4 6x480GB SSD 1Gbps 100 TV from $ 249 in the Netherlands and the USA! Read about How to build an infrastructure building. class c using servers Dell R730xd E5-2650 v4 worth 9000 euros for a penny?
Source: https://habr.com/ru/post/417729/
All Articles