Threat Hunting with the new Cisco Visibility solution
Imagine that you have read an article in Kommersant that the Internet has found itself in the public domain a complete package for attacks on Pegasus banks. You will probably want to find out if you are hit and whether there is a malicious code in your network. On the one hand, you have a lot of logs and security events from various protection tools, and on the other hand, you may receive information about threats as part of a subscription to any paid or free Threat Intelligence service (for example, from BI.ZONE, GosSOPKI or FinCERT). On the one hand, you have a lot of data to analyze, but you don’t know if they contain traces of what you are looking for. On the other hand, you have information about traces (that is, indicators of compromise), but you do not know how they apply to you. You need to combine these two data sets by implementing what is commonly called Threat Hunting or the search for traces of attacks in your infrastructure. Let's take a look at how you can automate this task with the help of the recently released free Cisco Visibility solution.
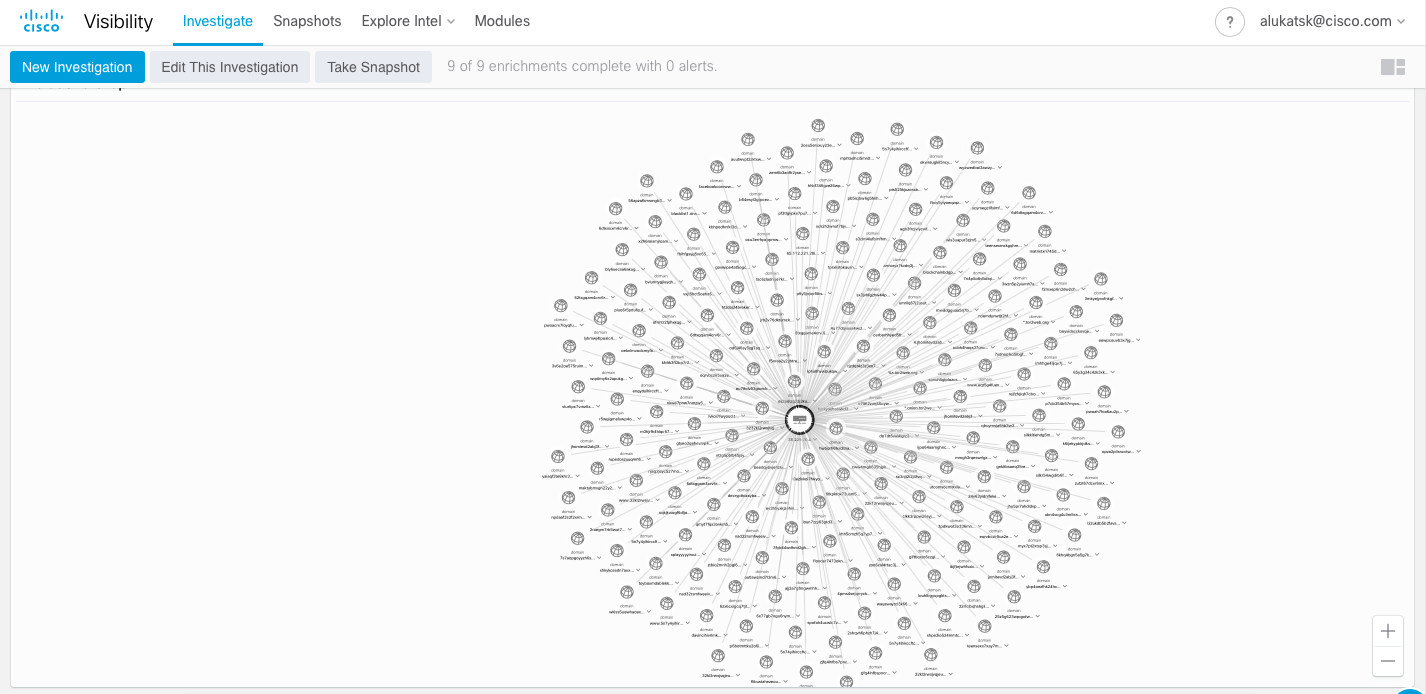
You do not know where to start? Where to look for traces of the threat that interests you? Here is a clean slate and in Cisco Visibility it looks like this:
')
In this window you load everything that you will search. Let's take TeslaCrypt as an example coder (in real life, instead of TeslaCrypt, you’ll expose any other threat whose traces you will need to find or prove its absence for the duration of Threat Hunting). First you need to put together all the indicators of compromise for what you use the existing services of Threat Intelligence. For example, you take TeslaCrypt data from the Cisco Talos blog . There are 9 indicators in front of you - IP addresses, hashes of files of malicious programs and domains with which the deployed cryptographer contacts to receive additional commands and pay for ransom in cryptocurrency. You download all these indicators to Cisco Visibility:

Here it is necessary to make a small digression. Cisco Visibility now works with data from Cisco AMP for Endpoints, that is, with an EDR (Endpoint Detection and Response) class solution, which is installed on personal and mobile computers running Windows, Linux, MacOS, Android, iOS. Therefore, Threat Hunting with the help of Cisco Visibility is carried out now on end devices, which in 70% are targeted by intruders.

What do we see after loading indicators in Cisco Visibility? The main screen area is occupied by the relationship graph, which reflects interactions between indicators of compromise, security events that are collected from the customer's infrastructure, and the external environment. You can scale the picture to get a general idea of the picture of what is happening.
Above the interaction graph is a panel that displays a summary of all points of interest to us:

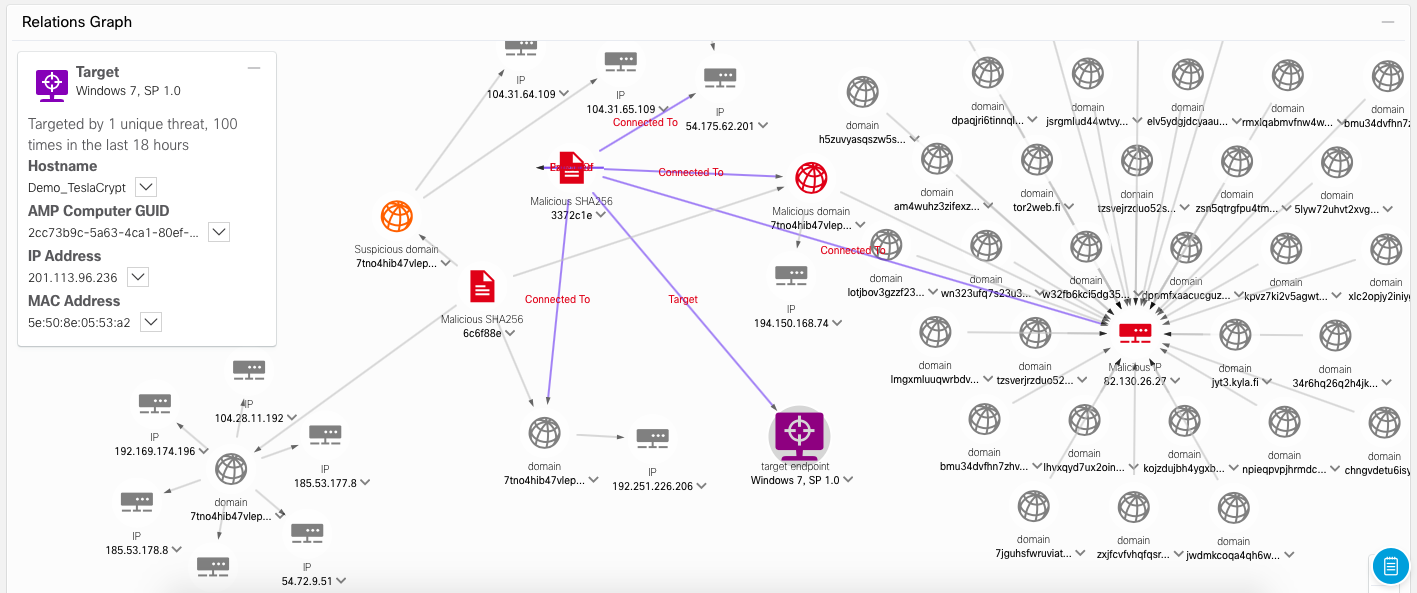
Considering that AMP4E agents can be installed on hundreds or thousands of computers, we are not interested in all of them, but only those who “got under the distribution” (if they did, of course). Clicking on the field "Target" (Target), we get a list of those nodes where traces of the threat were found. In our case, this is just one node.

By clicking on the name of this node, we immediately get the area of the interaction graph, which reflects all the connections between the traces of interest and the compromised node.
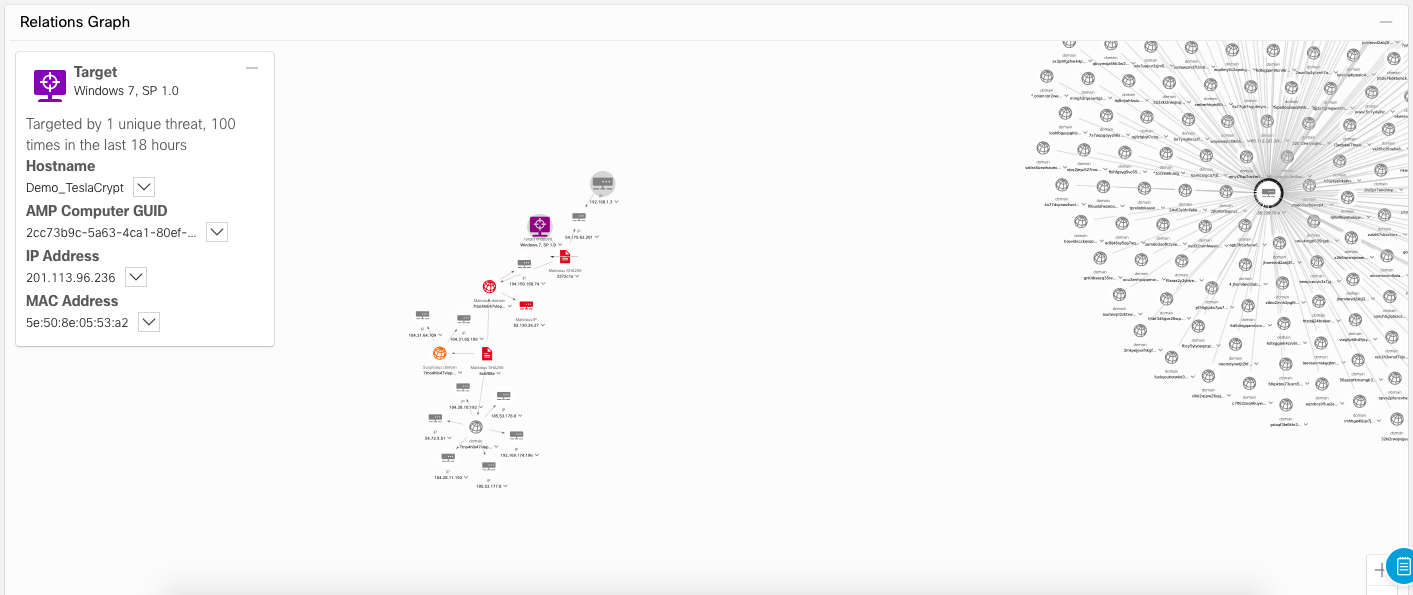
It is immediately obvious that only a small part of the infrastructure was damaged, on which one can concentrate.
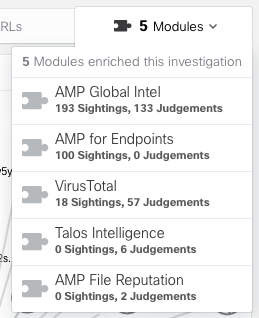
The traces found were enriched using various modules, including third-party solutions (in this case, VirusTotal). This allows us to be more confident in the results of the analysis, as confirmation of the traces found was obtained from various sources of Threat Intelligence. In this case, the investigation was enriched with TI data from 5 sources:
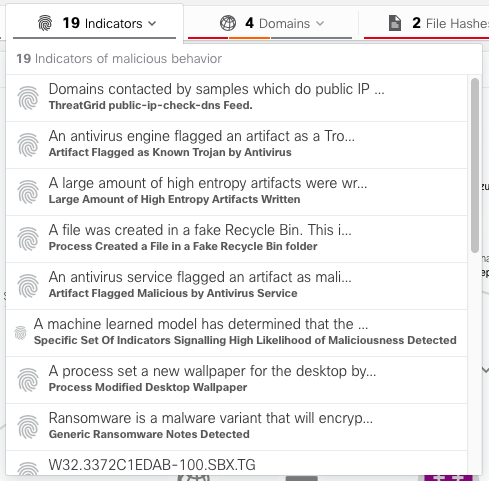
There are quite a few indicators of compromise, that is, behavioral patterns, applied to the sought tracks (19):
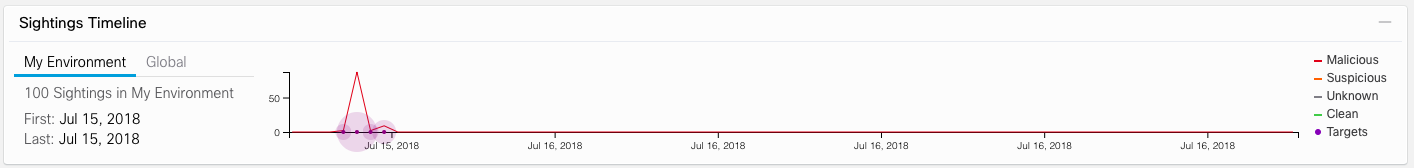
The Sightings Timeline screen area shows us a timeline reflecting two important questions — when found traces were found in our local infrastructure and when they were found outside the company, in the world (the last 30 days are displayed so as not to divert analysts too much from the current moment ). Such a comparison of the two timelines allows us to conclude whether the malicious activity is global (and we just came under the distribution, like many others) or it was a focal, designed specifically for us.
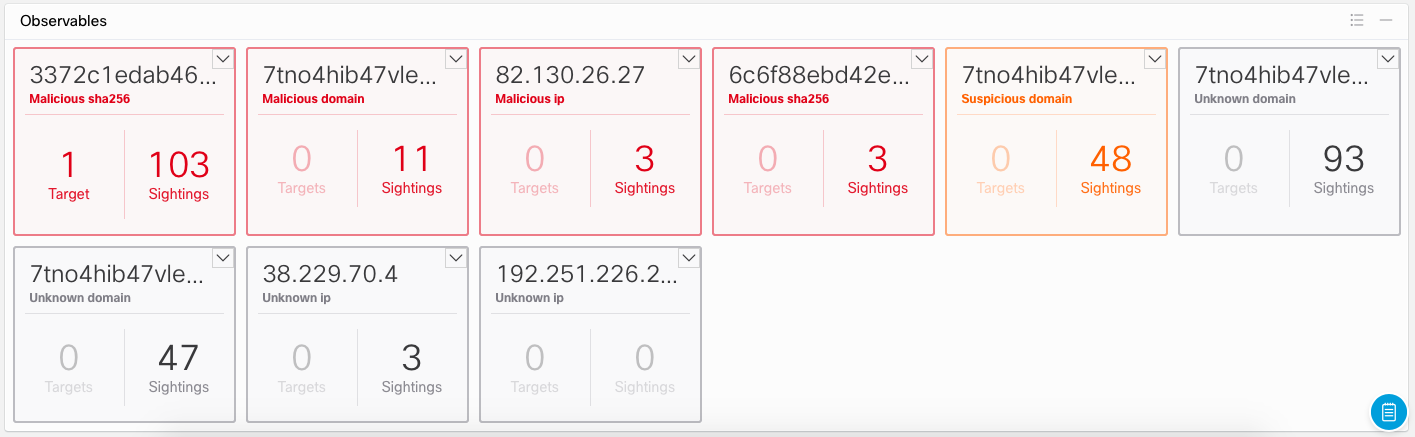
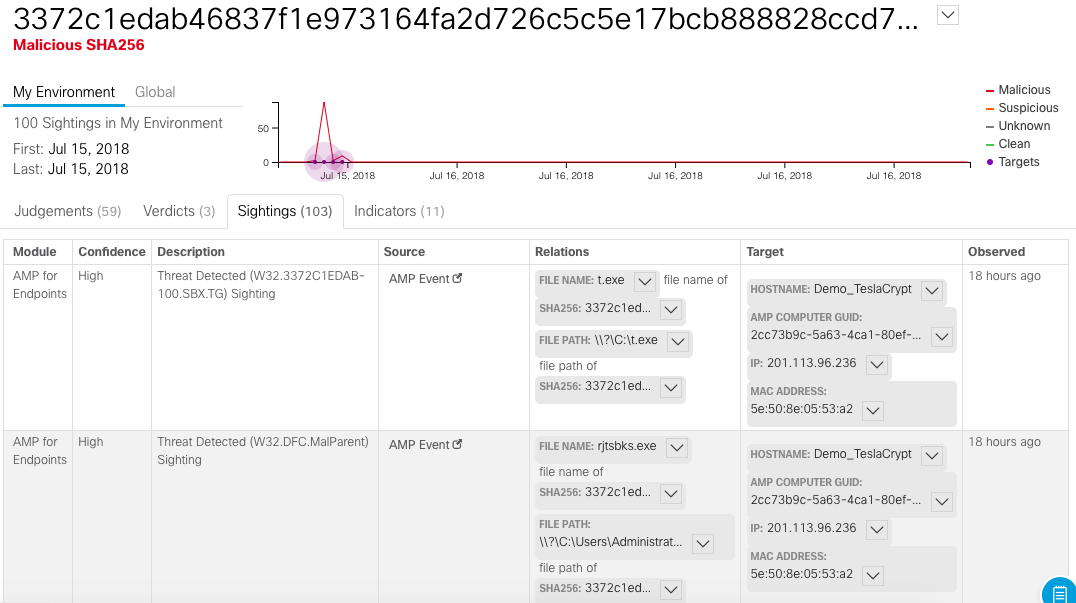
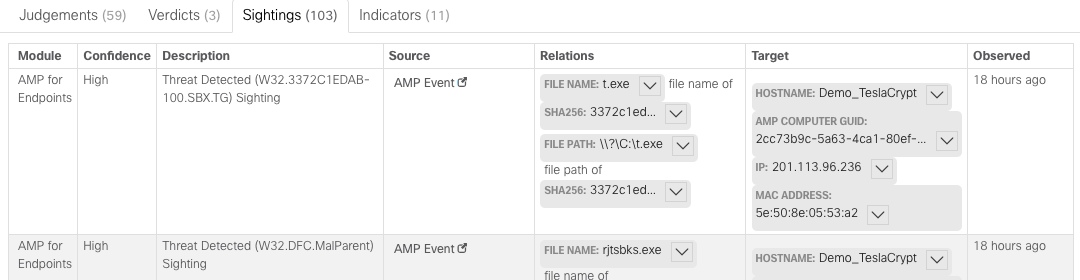
At the very bottom of the screen we will see a section where you can get the details of each trail found, the artifact, the indicator of compromise and go for a more detailed analysis. Please note that of all the traces we are looking for, we only met one on the network - the hash of the malicious file.
For example, this is how the information on malicious files found in our infrastructure with the corresponding hash looks like. However, it is worth paying attention to such an important point. For each track we see several tabs. The first of these is Judgments. In it, we see references to various modules that "saw" these traces sometime. For example, we see that in the VirusTotal database there is a corresponding hash and it is recognized by various antivirus engines. Does this mean that this threat is in our network? Not yet. Perhaps this is an old malware that no longer works. For example, in the Expiration field there may be a note that this trace was last recorded “in the wild” two months ago.

Much more important is the Verdict tab (final sentence), which allows us to make a final conclusion (due to the evaluation of various data, the weighted result of which is displayed on the Verdict tab) about the presence or absence of a threat in our infrastructure.

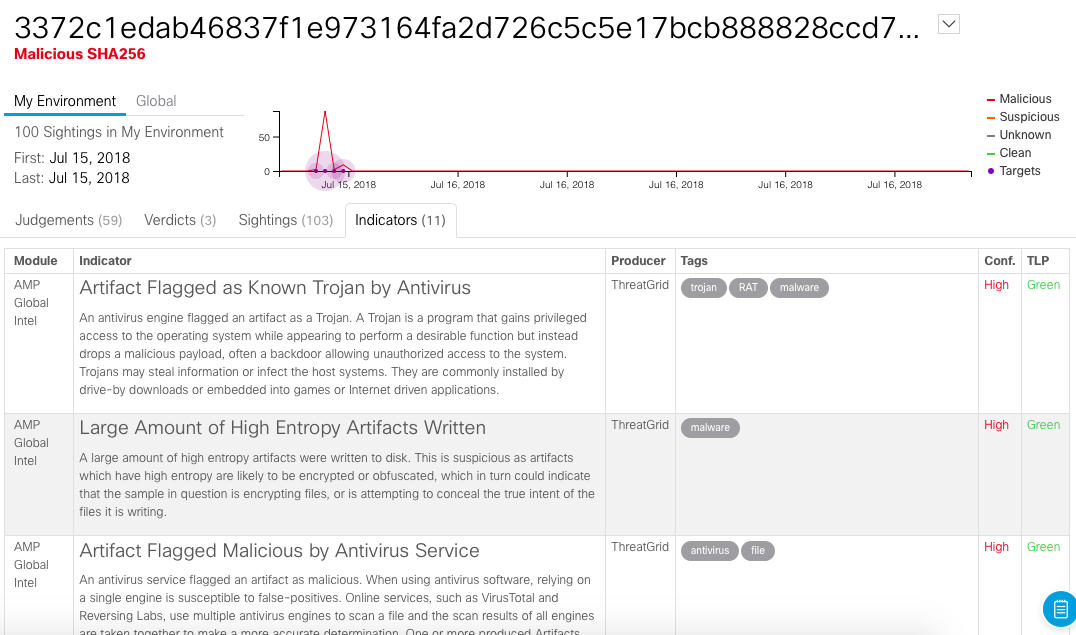
The Sightings tab shows us the artifacts of the threat and where they were discovered:
The Indicators tab shows a detailed description of each indicator inherent in detected traces:
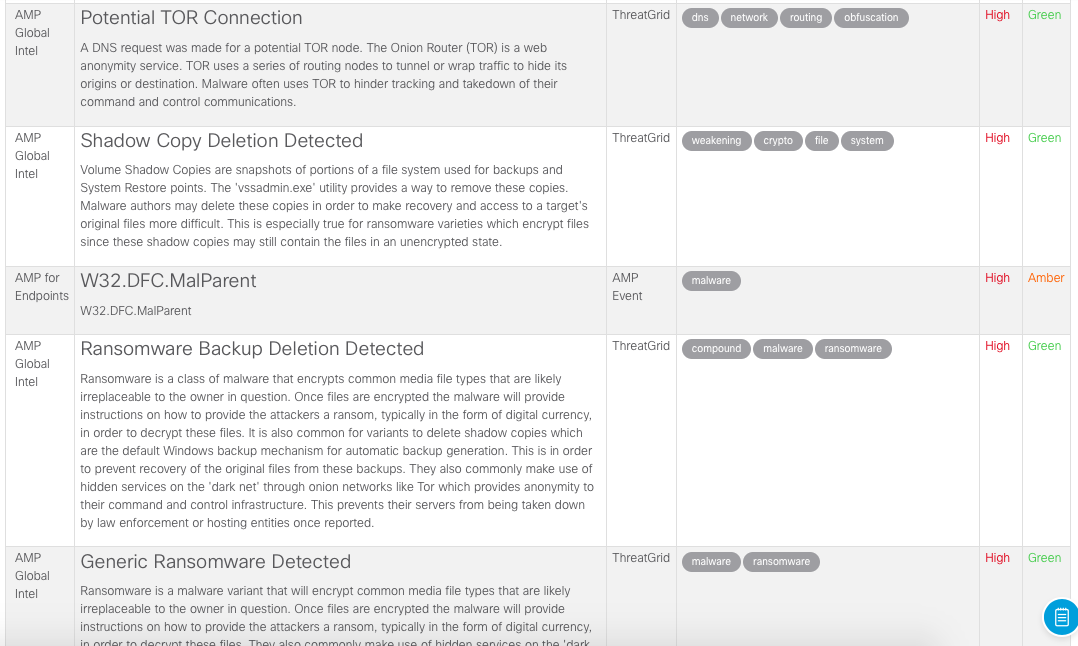
Please note that we have here interaction with Tor, and deleting backups, and recognizing with antiviruses, and creating a large number of artifacts, etc. We analyze about 1000 different indicators in our Threat Intelligence databases.
After receiving information about the traces of the attack found in our infrastructure, we can conduct a more detailed investigation using the tools that gave the original data to Cisco Visibility. For example, we can run AMP for Endpoints in order to get a detailed analysis of a specific event, which led to the possibility of detecting a threat.
We see the whole picture of what is happening. Malicious file created by the explorer.exe process at 20:00:00 Moscow time on July 15th. We see where this file is located and the values of its hashes for various algorithms (SHA1 and MD5).

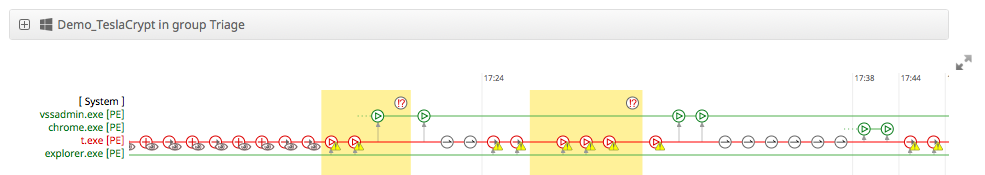
With the help of retrospective security technology and the Device Trajectory visualization mechanism, we can visualize all actions performed or carried out by the file of interest to us. In this case, we see that the file object t.exe, created by the explorer.exe process, has launched a completely legal Windows utility, vssadmin.exe, which manages shadow copies and, among other things, is often used by encryption tools to remove them encrypted data). If you look at the description of TeslaCrypt, then we will see that this cryptographer really uses vssadmin in its activities.
By the way, we recently updated the Device Trajectory mechanism and now it looks a bit different:
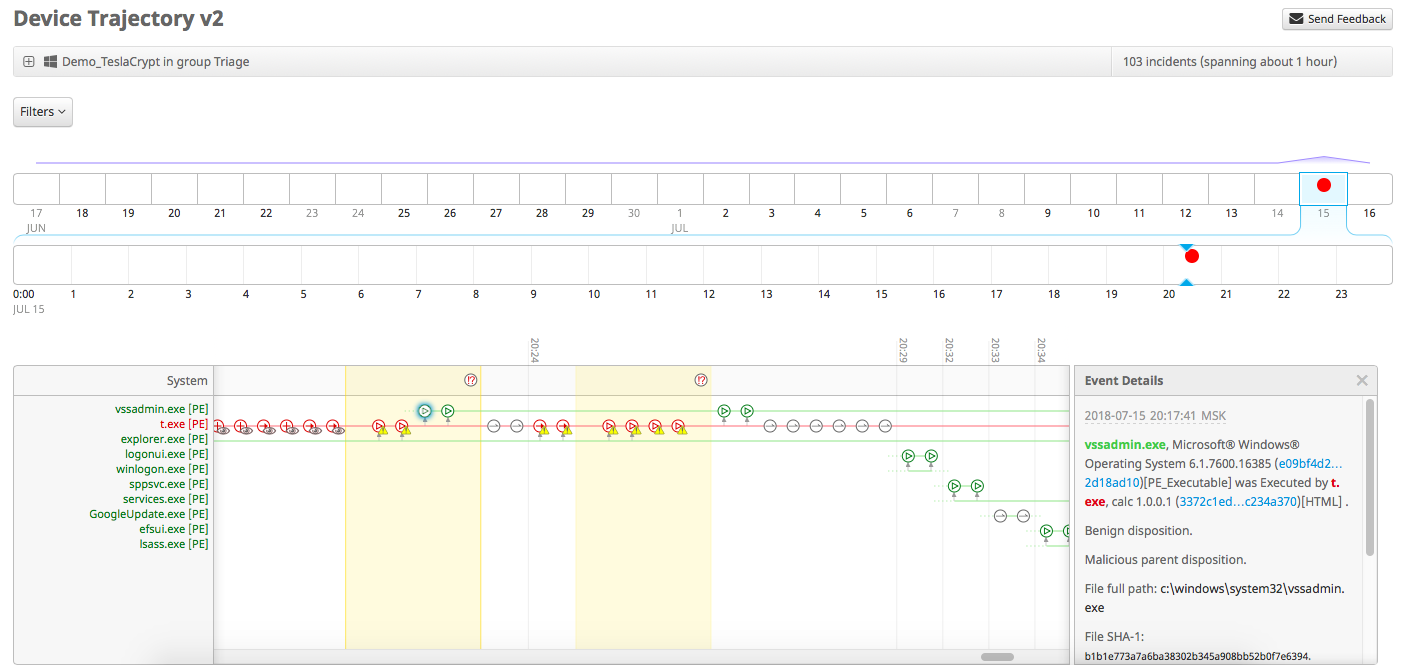
In the example above, the t.exe file was not blocked and was not quarantined, although in real life AMP for Endpoints does just that. But for the purposes of this article, AMP4E works in audit mode, which allows you to monitor events, but not block them. By the way, if, instead of vssadmin, PowerShell was launched (also a completely legal system administration tool), then we would see both this and the command line parameters used in PowerShell.
So, in brief, it looks like working with Cisco Visibility when searching for traces of threats in the local infrastructure and enriching existing security events with data from various Threat Intelligence sources.
PS: Cisco Visibility is based on the Cisco Threat Intelligence Model (CTIM) developed by us, which, in turn, is based on the Threat Intelligence communication standard - STIX. But unlike STIX, the CTIM model is not focused on formalizing the format of the threat data, but on the process of collecting, storing and analyzing this data. Based on the Cisco Threat Intelligence API (this is an open source project and it can be used in our solutions), we plan to expand the list of sources with which we will work, both in terms of receiving security events, and in receiving Threat Intelligence data. In addition, we plan to add to Cisco Visibility the ability to work not only with atomic indicators of compromise (IP, hash, domain, URL), but also with data on vulnerabilities (CVE), programs in configuration (CWE), attack pattern database (CAPEC) and a knowledge base about the methods, tactics and procedures of intruders (ATT & CK). This work is underway.
PPS: At the beginning of the note, I was a little devious. Cisco Visibility is really a free solution, but to use it, you must at least have Cisco AMP for Endpoints installed in your organization (and where can you get data for threat hunting from?). It is also desirable (but not necessary) to have access to Cisco Threat Grid (sandbox) and Cisco Umbrella (DNS analysis) services. In these cases, it will be possible to conduct a deeper analysis of threats (traces and indicators) already within the specified services launched from Cisco Visibility. And of course, you must have access to external Threat Intelligence services that integrate with Cisco Visibility. So far this is only VirusTotal (but we are not standing still and we will expand their number), access to which anyone can receive.
You do not know where to start? Where to look for traces of the threat that interests you? Here is a clean slate and in Cisco Visibility it looks like this:
')
In this window you load everything that you will search. Let's take TeslaCrypt as an example coder (in real life, instead of TeslaCrypt, you’ll expose any other threat whose traces you will need to find or prove its absence for the duration of Threat Hunting). First you need to put together all the indicators of compromise for what you use the existing services of Threat Intelligence. For example, you take TeslaCrypt data from the Cisco Talos blog . There are 9 indicators in front of you - IP addresses, hashes of files of malicious programs and domains with which the deployed cryptographer contacts to receive additional commands and pay for ransom in cryptocurrency. You download all these indicators to Cisco Visibility:
Here it is necessary to make a small digression. Cisco Visibility now works with data from Cisco AMP for Endpoints, that is, with an EDR (Endpoint Detection and Response) class solution, which is installed on personal and mobile computers running Windows, Linux, MacOS, Android, iOS. Therefore, Threat Hunting with the help of Cisco Visibility is carried out now on end devices, which in 70% are targeted by intruders.
What do we see after loading indicators in Cisco Visibility? The main screen area is occupied by the relationship graph, which reflects interactions between indicators of compromise, security events that are collected from the customer's infrastructure, and the external environment. You can scale the picture to get a general idea of the picture of what is happening.
Above the interaction graph is a panel that displays a summary of all points of interest to us:
- Goals or sacrifices. Clicking on this field, you will immediately receive a list of all the nodes on your network, which found the tracks you are looking for. This is exactly what you need in order to understand the scale of the disaster and how much you have suffered. If no nodes are shown here, then you have no nodes participating in the attack.
- Traces. Clicking on this field, you will receive a list of traces that you are looking for, with color highlighting, reflecting the fact that these traces are found in Cisco Threat Intelligence databases.
- Indicators. Clicking on this field, you will see the behavioral patterns that were found in your infrastructure, corresponding to the desired tracks.
- Domains, hashes, IP addresses and URLs. These fields show the corresponding traces.
- Modules. This menu item reflects the list of modules with the help of which data enrichment and detection of attack traces took place. There are several such modules and they include both Cisco solutions (for example, Cisco ThreatGrid, Cisco Umbrella, Cisco AMP Global Intelligence, Talos Intelligence) and third-party solutions (for example, VirusTotal). The list of these modules will be expanded.
Considering that AMP4E agents can be installed on hundreds or thousands of computers, we are not interested in all of them, but only those who “got under the distribution” (if they did, of course). Clicking on the field "Target" (Target), we get a list of those nodes where traces of the threat were found. In our case, this is just one node.
By clicking on the name of this node, we immediately get the area of the interaction graph, which reflects all the connections between the traces of interest and the compromised node.
It is immediately obvious that only a small part of the infrastructure was damaged, on which one can concentrate.
The traces found were enriched using various modules, including third-party solutions (in this case, VirusTotal). This allows us to be more confident in the results of the analysis, as confirmation of the traces found was obtained from various sources of Threat Intelligence. In this case, the investigation was enriched with TI data from 5 sources:
There are quite a few indicators of compromise, that is, behavioral patterns, applied to the sought tracks (19):
The Sightings Timeline screen area shows us a timeline reflecting two important questions — when found traces were found in our local infrastructure and when they were found outside the company, in the world (the last 30 days are displayed so as not to divert analysts too much from the current moment ). Such a comparison of the two timelines allows us to conclude whether the malicious activity is global (and we just came under the distribution, like many others) or it was a focal, designed specifically for us.
At the very bottom of the screen we will see a section where you can get the details of each trail found, the artifact, the indicator of compromise and go for a more detailed analysis. Please note that of all the traces we are looking for, we only met one on the network - the hash of the malicious file.
For example, this is how the information on malicious files found in our infrastructure with the corresponding hash looks like. However, it is worth paying attention to such an important point. For each track we see several tabs. The first of these is Judgments. In it, we see references to various modules that "saw" these traces sometime. For example, we see that in the VirusTotal database there is a corresponding hash and it is recognized by various antivirus engines. Does this mean that this threat is in our network? Not yet. Perhaps this is an old malware that no longer works. For example, in the Expiration field there may be a note that this trace was last recorded “in the wild” two months ago.
Much more important is the Verdict tab (final sentence), which allows us to make a final conclusion (due to the evaluation of various data, the weighted result of which is displayed on the Verdict tab) about the presence or absence of a threat in our infrastructure.
The Sightings tab shows us the artifacts of the threat and where they were discovered:
The Indicators tab shows a detailed description of each indicator inherent in detected traces:
Please note that we have here interaction with Tor, and deleting backups, and recognizing with antiviruses, and creating a large number of artifacts, etc. We analyze about 1000 different indicators in our Threat Intelligence databases.
After receiving information about the traces of the attack found in our infrastructure, we can conduct a more detailed investigation using the tools that gave the original data to Cisco Visibility. For example, we can run AMP for Endpoints in order to get a detailed analysis of a specific event, which led to the possibility of detecting a threat.
We see the whole picture of what is happening. Malicious file created by the explorer.exe process at 20:00:00 Moscow time on July 15th. We see where this file is located and the values of its hashes for various algorithms (SHA1 and MD5).
With the help of retrospective security technology and the Device Trajectory visualization mechanism, we can visualize all actions performed or carried out by the file of interest to us. In this case, we see that the file object t.exe, created by the explorer.exe process, has launched a completely legal Windows utility, vssadmin.exe, which manages shadow copies and, among other things, is often used by encryption tools to remove them encrypted data). If you look at the description of TeslaCrypt, then we will see that this cryptographer really uses vssadmin in its activities.
By the way, we recently updated the Device Trajectory mechanism and now it looks a bit different:
In the example above, the t.exe file was not blocked and was not quarantined, although in real life AMP for Endpoints does just that. But for the purposes of this article, AMP4E works in audit mode, which allows you to monitor events, but not block them. By the way, if, instead of vssadmin, PowerShell was launched (also a completely legal system administration tool), then we would see both this and the command line parameters used in PowerShell.
So, in brief, it looks like working with Cisco Visibility when searching for traces of threats in the local infrastructure and enriching existing security events with data from various Threat Intelligence sources.
PS: Cisco Visibility is based on the Cisco Threat Intelligence Model (CTIM) developed by us, which, in turn, is based on the Threat Intelligence communication standard - STIX. But unlike STIX, the CTIM model is not focused on formalizing the format of the threat data, but on the process of collecting, storing and analyzing this data. Based on the Cisco Threat Intelligence API (this is an open source project and it can be used in our solutions), we plan to expand the list of sources with which we will work, both in terms of receiving security events, and in receiving Threat Intelligence data. In addition, we plan to add to Cisco Visibility the ability to work not only with atomic indicators of compromise (IP, hash, domain, URL), but also with data on vulnerabilities (CVE), programs in configuration (CWE), attack pattern database (CAPEC) and a knowledge base about the methods, tactics and procedures of intruders (ATT & CK). This work is underway.
PPS: At the beginning of the note, I was a little devious. Cisco Visibility is really a free solution, but to use it, you must at least have Cisco AMP for Endpoints installed in your organization (and where can you get data for threat hunting from?). It is also desirable (but not necessary) to have access to Cisco Threat Grid (sandbox) and Cisco Umbrella (DNS analysis) services. In these cases, it will be possible to conduct a deeper analysis of threats (traces and indicators) already within the specified services launched from Cisco Visibility. And of course, you must have access to external Threat Intelligence services that integrate with Cisco Visibility. So far this is only VirusTotal (but we are not standing still and we will expand their number), access to which anyone can receive.
Source: https://habr.com/ru/post/417345/
All Articles