Smart Home on Arduino for dog house
Nothing unusual, just another controller on the Arduino. With sensors, relays and a web page. But with its features and quite specific practical application, albeit rather banal - the remote inclusion of electric heating in the country. Quotation marks in the header are not random, the controller is not a smart home in the current version, but serves as a good basic blank for it. (note - this phrase was added on April 12, 18 based on the results of comments).
Key features:
')
- The gauge of the electrical network parameters is the Neva electric power meter via RS-485;
- Remote modification of the management web page lying on the SD card;
- Reliable inclusion of a group of Dallas temperature sensors on long lines;
- Graphs of changes in parameters without the involvement of cloud services;
- Fault-tolerant solutions (external watchdog, UPS, automatic restart of the router);
- Protection of izernet-schild from freezes in case of interference from power relays;
- Finished design in DIN rail housing.
I did this system slowly, as entertainment, from time to time throwing the project for months ... Some one and a half years passed from idea to implementation :)
Since I hadn’t dealt with microcontrollers at all, I started with a starter set with aliexpress, played with LEDs, buttons and sensors, understood something like that, and started building a controller for remote control and monitoring. Well, not straight "smart home" of course, but something about that.
The practical goal was first set one - remotely turn on the heating in the country. I did not have time to build a house (my hands did not reach, yeah), but then I have a wonderful, comfortable cottage with full stuffing, heated with electric convectors. In advance to warm the sheds that have cooled down in a week by Friday evening - a very tempting opportunity during the cold season.
However, the task of remote load control turned out to be quite trivial. Arduino plus izernet-shild, ready-made sketch from the Internet, and relyushki already clicked from the checkmarks on the web page. The practical goal was achieved somehow very quickly and simply. And it was boring. I wanted something more interesting.
He set himself a second practical goal - to monitor the current consumption in the dacha power grid. Acquired simple current sensors for tests, played. Everything worked well, but this option was not suitable for combat work. Sensors more powerful than 5A, I could not find, but I had to at least 25A.
And I had the idea to use an electricity meter as an electrical sensor. And it was a beautiful thought! And I created a device such, and saw that it was good! Not without difficulties, but I completed this task excellently in the end, and I’ll tell you about it with a feeling of deep satisfaction :).
Functional
The first (and so far the last) combat version of the controller "smart dog" has the following functionality:
- Remote manual control of switching on the power relays through the browser and control of their current state;
- Remote monitoring of the parameters of the three-phase power supply network (voltage, current, frequency and many more unnecessary garbage, which I then turned off);
- Remote monitoring of readings of a two-tariff electricity meter;
- Remote monitoring of a group of temperature sensors;
- Logging data and registering events on a memory card;
- Display in the browser data from all sensors for the selected day in the form of graphs.
Ideology
The principle of building the entire system - without the use of third-party cloud services and data collection and display servers. This is neither good nor bad. At the initial stage of "smart home building" such a scheme is sufficient and simple. Although it imposes certain restrictions on use.
Arduino with izernet-shield is the only web server in the system. The web page with the management interface is stored on the memory card of the Izernet-Shield and is transmitted to the browser when accessing it to the specified IP address. Further interaction of the user interface with Arduino is carried out through java-scripts, whose bodies are not embedded in the web page, but are stored in my home file storage with Internet access. This approach reduces the weight of the web page, which speeds up its reading from the SD card, and allows you to more quickly and simply modify the script code.
Reading the log data for displaying graphs is made from a memory card on request (pressing a button in the browser). The data is displayed only in the current session, the browser pages are not saved anywhere, and when the page is reloaded, it is necessary to read them again. This is a minus of ideology, since reading from a memory card is rather slow, and getting a daily amount of data can take a minute or two (it was thought to rework the data storage format to reduce their size and speed up reading).
The current values of the sensors are displayed on the page and are updated in real time with the frequency of the loop cycle, which is about 1 Hz.
There is no “intelligence” in the algorithm now. I will not know whether the algorithm will be instructed in the future, so far the current version suits me completely.
Network topology
At the dacha mobile Internet Yota (usb-modem + wifi-router). There is no fixed IP address, and there is no opportunity to receive it either, even for money. Yes, and even a dynamic white IP-address is not, therefore DynDNS does not apply. Only gray IP address of the internal Yota network. IPota Yota does not support (at least for 2017 it is). Therefore, I found only one way to reach the country router from the outside - VPN.
At home (in the city) wired internet with a white fixed IP address. Router, followed by network storage. A VPN server is raised on this home router. The country router is configured to raise the VPN VPN tunnel via PPTP to the home router.
The controller on Arduino is connected to the LAN port of the country router and sits behind NAT, the 80th port is forwarded to it. Thus, I can get access to Arduino only from my VPN. Accordingly, my local network and VPN are two segments of the same subnet, access is direct there. I set up a VPN connection on my working office computer and on my smartphone and also got access to Arduino. Not very convenient to use, but it works. Yes, and relative security is provided - without authorization in my VPN, no one else can get to the controller's management page.
The bottleneck is the VPN tunnel to the country router. Periodically falls. Moreover, it is the PPTP connection that is being broken, access to the Internet remains. And the worst thing is that when a PPTP connection is broken, it no longer rises. It does not help even rebooting the router. Only a full restart on power along with a USB modem, and then not immediately. It is necessary to turn it off, wait 10 minutes, turn it on again. Lucky - well, no - next iteration. The reason, according to Zyxel technical support, is to block PPTP packets by the cellular operator, since one side correctly sends, the second listens correctly, but the data does not reach (at both ends of the VPN tunnel I have Zyxel routers). Yota is to blame, but it is impossible to get anything intelligible from them. And maybe not Yota.
Watchdog
To ensure a relatively uninterrupted VPN operation, I use a software log
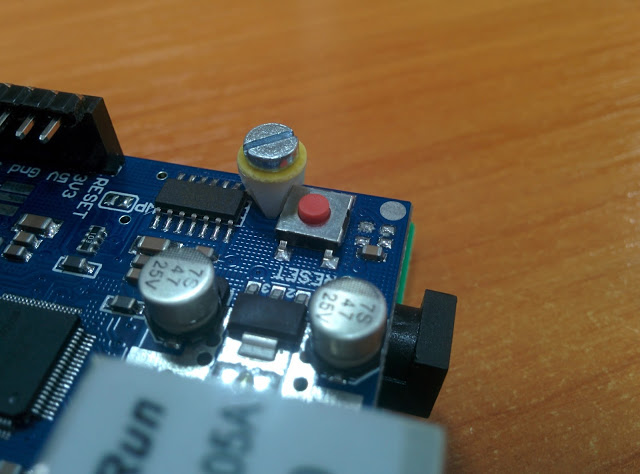
In addition to software, I also implemented a hardware watchdog. Just in case. The controller should work for weeks and even sometimes for months in the absence of me, and not hang. How all this economy will behave in big minuses was unknown to me, therefore I was insured. The watchdog built into Atmega did not suit me by not working at all for Arduino Mega out of the box, and in order to make it work, it was necessary to have a thorough sex. This problem is well described here . In addition, he had a maximum interval of 8 seconds, which seemed to me insufficient. Therefore, I applied the TPL5000DGST watchdog timer microcircuit, the interval of which is set by a combination of three pins and can reach 64 seconds, which suits me perfectly. For this microcircuit, I purchased a small prototype, soldered it and fixed it on the connector with the IO-ports of Arduina (the photo will be lower in the section about the assembly). The tests showed the reliable operation of this watchdog, and I was wondering how often it will work in reality. To do this, I added a variable to the program code, where the time and date of the program launch are stored, and this information is displayed on the management web page. Practice has shown that, unlike VPN, the controller runs uninterruptedly for a long time, and the watchdog timer has so far never come in handy (while writing the article, the watchdog did work for the first time, but it was not for nothing). The time of continuous work reached more than 3 months and there could be more if I didn’t need to add something to the code from time to time and reflash the controller.
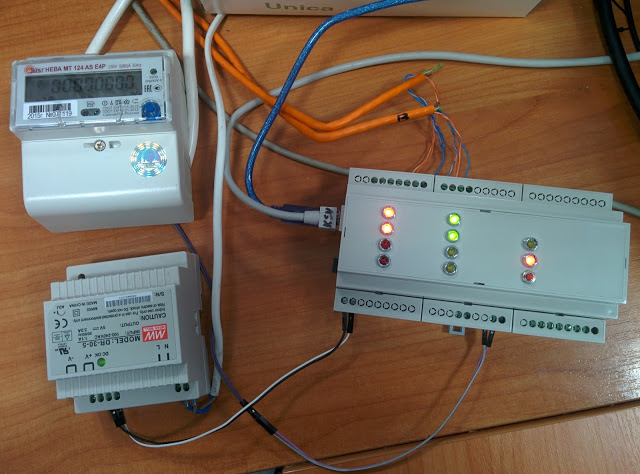
Sensor of electrical network parameters - Neva electric meter
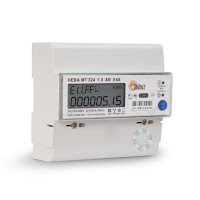
As I mentioned above, in my opinion, it is impossible to find anything better and more accurate as a sensor for the parameters of the electrical network than a modern digital electricity meter with an external data access interface. I chose the Neva counter of the St. Petersburg company Taypit with RS-485 interface.
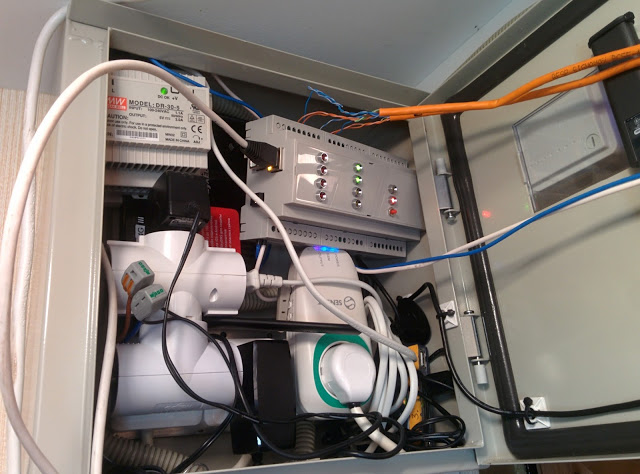
I emphasize that an electric meter with wires of the 485th interface which are constantly connected to it is not officially allowed to be used as a metering device ( update : in the comments it was suggested that it was allowed). Therefore, in the dacha power grid, I put two counters in series. The first one is the official electricity metering device, sealed up and registered, located in the street opening shield. The second one is my sensor of the electric network parameters, unsealed and unaccounted for, on which the power supply company already doesn’t give a damn, since it doesn’t care about everything that is installed after the metering device. This electric meter is already located in the panel inside the dog house, and in the same panel there is also a controller on Arduino, but, about this a bit later.
At the cottage I have a three-phase power grid. In the city, I have the opportunity to debug only on a single phase. Therefore, I purchased two meters, the three-phase Neva MT-324 and the single-phase Neva MT-124. The initial debugging of the controller was done on the table on a three-phase counter with one phase connected, then it was installed in the dacha panel in the combat mode of operation. Debugging of the following software modifications was done on a cheaper single-phase counter on the table:
To connect the meter to Arduino, an RS-485 to TTL level converter is required:
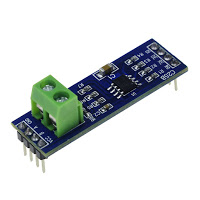
Also, to work with the meter you need a free serial port on the Arduino. Unfortunately, the Arduino Uno has only one serial port, taking which under the counter would have lost the debug output of textual information (the port monitor), and without this it is impossible to write a sketch. Therefore, I use Arduino Mega, which has several serial ports. It would be possible to implement the second serial port soft through the Arduino digital ports, but I could not find the appropriate library with the ability to change other port settings besides speed. And the counter port settings are different from the default ones: 9600 bitrate, 7 data bits, 1 stop bit, even parity control. The standard Serdu object in Arduino, fortunately, allows you to make these settings.
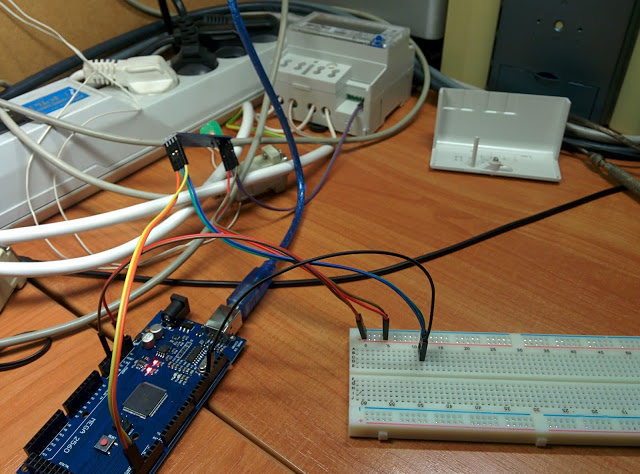
The exchange protocol with the counter was relatively easy to obtain - the counter manufacturer in the public domain has a parameter reading program for Windows, which also has a port monitor. To connect the meter to a computer, I used the interface converter MOXA 232/432 / 485USB. Some time for a visual analysis of the packages - and I selected the main commands.
However, this did not seem enough to me, and I turned to the manufacturer by e-mail. After a month of correspondence with the company Taypit, I finally managed to get a full list of commands with interpretation:
Character encoding MT3XX E4S
Coding parameters NEVA MT124 AS OP (E4P)
Next is the case of technology - to write a parameter polling cycle under Arduino and, for starters, bring them to the port monitor. The time of one cycle was about a second. However, in the final version of the project with logging data to a flash drive and polling temperature sensors, this time increased to 4-x seconds. This did not suit me at all and had to plunge into optimization. As a result, I again achieved a second interval without loss of functionality. By the way, I rewritten the sketch from scratch two or three times until I found the right architecture and cost-effective algorithms.
Software implementation of the exchange with the counter
The code is torn from the context of my big working sketch. Compiled, but in this form, I never ran it. I cite for example only, and not as a finished work program. Although in theory everything should work in this form.
The code is written for two types of meters simultaneously, single-phase MT-124 and three-phase MT-324. The choice of the type of counter occurs in the program automatically by the response word of the initiating command.
I bring the code as it is, without beautiful and additional comments except for those that I wrote for myself. And yes, I'm not a programmer, and I don’t even learn from it, so I shouldn’t kick me for the quality of the code, but I can teach how to code: EnergyMeterNeva.ino
A huge additional plus of the electricity meter is a reliable and accurate real-time clock. I did not have to provide the system with an additional module, which still needs to be found not just anyhow, but a quality one. The current time, up to a second, I get from the counter, among other data. Yes, relative to atomic time, the time of the counter is slightly shifted (a few seconds), I don’t know what it is connected with, with a poor-quality factory setting or something else, but the accuracy is excellent, just with a slight offset.
In rare moments, when the power supply in the country is turned off and the meter becomes unavailable, I get the current time from Arduina's internal timer. When the electric meter is working and its data is available, I re-write the Arduine internal timer with the value from the counter on each loop loop. When the counter falls off - the current time continues to tick on the Arduina timer.
In addition to reading the parameters of the counter, of course, you can and program. That is, the interface works on both reading and writing. However, I with such difficulties sought the protocol of reading commands, that I didn’t even give a hint about the request of the record protocol to the manufacturer. Firstly, it was no good for me, except maybe just a little time to move. Secondly, I suspect that this data is no longer open, since it can be used for fraudulent purposes.
Temperature sensors
I have already conducted a test of temperature sensors using a sketch example separately earlier. Now it was necessary only to build in their poll into the main project. It was no difficulty. All nine sensors I had worked without problems when connected in parallel via 1-Wire. The scatter of readings between them was about 0.5 degrees, which indicates the senselessness of using them at maximum accuracy of 0.0625 degrees. Sensors for the test assembled in a pack and wrapped in several layers of polyethylene foam. For greater accuracy, I placed the pack vertically and waited 24 hours for the full equalization of temperature. The readings of all the sensors were not the same.
However, I didn’t bother to deactivate the accuracy of temperature conversion of the sensors either. It would be simpler to round the readings programmatically, but I would not get the benefits of the survey time, because I came up with an algorithm where the conversion waiting time is not an empty useless delay (750). The usual logic of working with sensors is as follows: first, issuing a command to start temperature conversion, then waiting for the conversion to finish (those are at least 750 ms), and then read the data. I did the opposite, which allowed me to eliminate the empty waiting interval - first I read the data from the sensors, and then immediately start the conversion. And while the rest of the code in the LOOP loop runs, the data just have time to prepare for reading in the next round. By the time I get the data from the sensors in this case a little later - the LOOP cycle takes about 1-1.5 seconds, but this is absolutely not critical.
Sometimes from all sensors I received data "85" or "0". I didn’t understand what a jamb is, so I did a check in the code and excluded such data from getting into the result. I also found a joint in one of the sensors - it did not hold the settings when the power was turned off. Either its internal flash drive is dead, or something else. Therefore, in the setup I have registered the sensor settings, and now on power-up (if it still disappears), all the sensors are set to be guaranteed.
I obtained the addresses of specific sensors using a sketch example, somewhere dug up and slightly modified by me: DS18x20_Temperature.ino
After that I scored the addresses with constants in the array and in the main program I turned to the sensors right away at their addresses: TempSensors_DS18B20.ino
For proper operation of the sensors on the 1-Wire bus, a 4.7 kΩ pull-up resistor is required between the data line and the power supply. It was convenient for me to solder an SMD resistor between the pins of the terminal block, but I found only 5.1 kOhm in my suitable case and put it up (it is visible on the photo in the section on the assembly on the bottom side of the board). Everything works well.
My temperature sensors are connected electrically in parallel on one long line (+5, gnd and data), all 9 pieces, but tricky. Physically, twisted-pair cables are connected by a star for easy wiring sensors across the object. In each cable arm, I use two pairs. One pair is powering the sensor. The second pair is a data line that goes along one wire to the sensor and returns from it back along the second wire. Thus, it is possible to separate cables from the shield with a star, but electrically it is a star only in terms of power, and according to data it is one line. This connection option turned out to be more reliable in working on long lines; with a simple parallel connection, there were many failures when reading data. Here is a sketch of such a scheme:
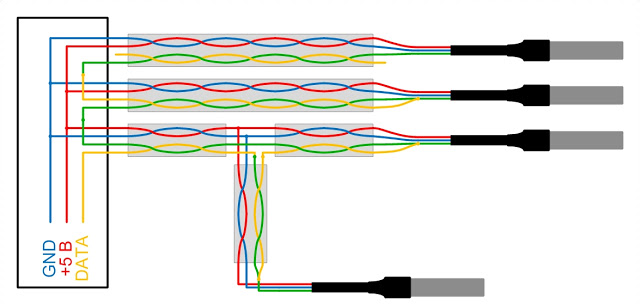
I did not shorten the half-meter tails of the three-wire cables of the sensors themselves, connected them as they were, turned out to be not critical.
In total, there are three cables divorced, two for external sensors, one for each, and one for all seven remaining internal ones. These seven internal sensors are connected in the same way, but within the same long cable and with short branches from it (see the lower T-shaped configuration in the sketch). Somewhere the standard half-meter tail of the sensor was enough for a branch, somewhere it was branched using the same twisted pair.
Two-wire connection of sensors, with the so-called. I didn’t use parasitic power (when the sensors are powered by the data line) because ... why? I would take four-pair cables anyway, just because I had them. There are no problems with cable laying. And the scheme with parasitic power is critical to the amount of current consumption in some modes of operation, unnecessary problems could arise.
The total length of the twisted pair cable trailer was approximately 25 meters. Pieces for external sensors are 5 and 10 meters, and a ten-meter internal piece with branches to seven sensors. Everything works almost perfectly. Only occasionally skips dashes instead of temperature values. This means that the data from a particular sensor was read incorrectly. But it happens so rarely (I notice once a month it can) that it does not cause any problems.
Remote access
For remote access to Arduino, an Ethernet shield was purchased. With the built-in library, working with it, as with everything else in Arduino, turned out to be quite simple.
Functionally, I have such a work scheme. A web server is raised on Arduino, which, when a client (browser) accesses it, generates a web page with various information. Auto-update of data on the page is implemented via javascript, polling the server by timer.
The page also has a set of controls for controlling the actuators connected to the Arduino - power relays that commute the load - electric heaters and lighting.
With the design of the web page, I was not steamed, especially since the minimum amount of text data was needed to load it faster, so the most primitive html is all: In the html code, I have embedded tags instead of data, which are replaced on the fly with real data when generating the page server. When auto-updating data on request javascript, they are transferred to the browser directly from the microcontroller in JSON format.

The code of the pages lies in a file on the memory card and is loaded from it when accessing the server. For a quicker and more convenient modification of the page code, I built in the mechanism of its updating into it myself. Below, under the main control block there is a text field and the Submit button. I copy the new html-code into the text field, press the button, after which the java-script sends the data to the controller's web server, which saves it first to a spooled file. If the transfer was successful, the main file is replaced by the buffer, the page is automatically updated. Everything.Changes accepted.
I give code snippets of my implementation of this mechanism.
In the html-page we embed the form:
<script type="text/javascript" src="http://domain/send_HTM.js"></script></pre> <pre style="font-size: 14px;"><form> <br><br> CONTROL.HTM:<br> <textarea cols="100" rows="20" wrap="off" id="htm"></textarea><br> <input type="button" value="" onclick="send_HTM();"><br> <div id="progress" style="display:none"> <div id="label"> :</div> <div style="width:800px;border:1px solid #000"> <div id="bar" style="background:#00f;height:10px;width:0px"></div> </div> </div> </form> The “Send” button launches the following java script: send_HTM.js
In the sketch in the function of processing web server requests, the following actions are defined by the prefixes in the query 'CONTROL.HTM' (start sending the file), 'htmlineN' (sending row No.) and 'END_CONTROL.HTM' (end of sending the file):
File acceptHtmFile; ................ if (fl_accept_htm) // 'CONTROL.HTM' { SD.remove(CTRL_HTM); acceptHtmFile = SD.open(CTRL_HTM, FILE_WRITE); // if (!acceptHtmFile) // - { #ifdef DEBUG_SD Serial.println("SD-card not found"); #endif client.print("FAIL"); client.stop(); } else client.print("OK_OPEN_FILE"); acceptHtmMode = true; break; } if (fl_htmline) // 'htmlineN' { int b = acceptHtmFile.println(tag); if (b == 0) { client.print("FAIL"); acceptHtmMode = false; cntHtmModeIteration = 0; } else { client.print("OK"); } cntHtmModeIteration = 0; break; } if (fl_endhtm) // 'END_CONTROL.HTM' { SD.remove(CONTROL_HTM); acceptHtmFile.close(); File htmlFile = SD.open(CONTROL_HTM, FILE_WRITE); // acceptHtmFile = SD.open(CTRL_HTM); // for (int i = 0; i < acceptHtmFile.size(); i++) { digitalWrite(PIN_WATCHDOG_DONE, 1); htmlFile.write(acceptHtmFile.read()); digitalWrite(PIN_WATCHDOG_DONE, 0); } acceptHtmFile.close(); htmlFile.close(); client.print("OK_CLOSE_FILE"); acceptHtmMode = false; cntHtmModeIteration = 0; break; } The defaults CONTROL_HTM and CTRL_HTM here are the names of the html files. The first is the main file, the second is the spooled file. In the array of char tags is the text of the received string, selected from the request. The logic is as follows: when receiving data, they are written into a spooled file, after receiving the spooled file is overwritten into the main one. How easy it is to rename the files, I could not understand, in the standard SD library there is no such function, therefore, stupid character-by-character copying takes a lot of time.
It would be convenient to store the code of the web page of the control not on the controller's memory card, but on the client machine, or load it from some external resource. But the ban on cross-domain queries does not allow this. Javascripts can send their requests only to the north from which they downloaded themselves. The bodies of javascripts can be loaded from anywhere, it is only important where the page with their call was loaded from.
Data logging
The Ethernet shield has an onboard micro SD card slot. It is because of its presence that I decided to write data to the log files. There is also a built-in library for working with a memory card, and managing the writing and reading of files with it is generally elementary.
To save data, I built the logging algorithm so that the recording occurs only when the data changes by more than a predetermined threshold. For temperature it is 0.1 °, for voltage it is 0.2V. Data is written to one file in one day. At zero hours a new file is created. The storage format I chose plain text, delimited, so that you can quickly monitor the contents of files when debugging, and it would be easy to load into Excel.
Design constraints do not allow conveniently insert-remove a memory card, so I used a large-capacity card. According to my calculations, it will be filled for several years, after which it will be necessary to subdivide the case, remove the memory card and clean it.
I don’t see the meaning of the logging code, everything is completely trivial - a banal text entry to the file. Yes, and this code is spread over the whole sketch (not only the parameters of the sensors are logged, but also various one-time events), it is difficult to isolate.
Charts
As a graphing engine, I use a very flexible javascript library for data visualization amchart . The library is free and available for download and offline use. I also located this library on my online storage with constant access to the Internet. Connect and use it with the default settings is not difficult, but in order to get the result that I needed, I had to tinker a lot. It helped a huge number of examples on the site and the availability of detailed documentation.
For example, give your javascript drawing graphs. It is useless by itself, as it works only in aggregate with the web server, and with the html page, and, possibly, is tied to other scripts (it was a long time ago, I don’t remember all the details). But the appearance settings of my graphs can be contained in it and you can draw them from there: get_log.js
The big advantage of the amchart library is that it can draw the correct graphs from “ragged” data. As I mentioned above, I save the data in the log only when it is changed. That is, it happens asynchronously and chaotically. New data may not be a few minutes, and then in a few seconds they will change several times. Accordingly, entries in the log go with arbitrary time intervals. Amchart when drawing takes this into account on its own, I do not need to interpolate the data before drawing. I just send the dataset as it is, and I see a nice time-uniform timeline.
I found only one drawback of this library - it does not know how (or I did not understand how) to update graphics in real time in a human way. You can add new data to the existing ones, but the redrawing is performed every time completely the entire data array, and this greatly slows down the browser. However, the very ideology of reading data from Arduin for drawing at the request from the browser is flawed by its non-optimality, therefore there was no point in fighting for a quick update in real time.
The correct solution would be to organize a separate server for storing and visualizing data, where real-time data would drop from the Arduina bit and stored in the database, and from where they could quickly be sent to the user in the browser for visualization.
Now the graphics look like this (on the example of the day when there is no one in the bungalow and, accordingly, there is no energy consumption). When current data appears, the scale is automatically set so that everything fits nicely, and the values of current levels appear on the vertical axis:
The graphs are displayed on the same page where the control takes place, right below the main control unit.
I do not intentionally cite a complete set of project source codes for several reasons:
- It cannot be run as it is on any other network except mine, since I did not try to make the project portable, and it is tightly tied to my addresses and my network topology.
- I am sure that the overall ideology of the project suffers from a variety of problems, since this is my first attempt in the field in which I understand poorly. Therefore, I do not offer anyone the whole project to be repeated in this form. I shared only those moments in which I was less sure.
- The project was done long and long, and I will never remember all the details and can not explain a number of solutions. The size of the sketch is very large (by my standards, about 2 thousand lines), there are more than a dozen different serving Java scripts, I didn’t do the iron schematic. That is, I can not help advisory on most issues.
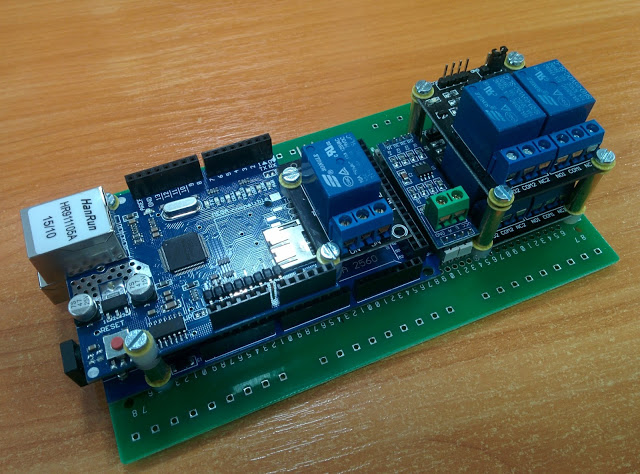
Assembly
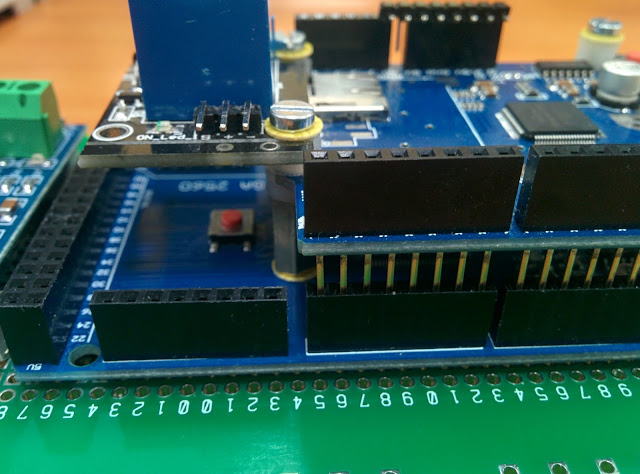
From the very beginning I set myself a goal - to make a complete device, and not just a mockup with a pile of wires on the table:
And immediately decided that the device is what I want to place inside the switchboard. There and food, and the counter, and in general, it is convenient.
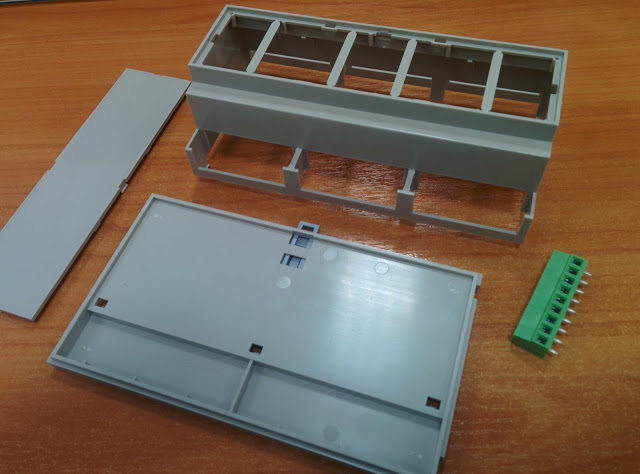
This required dinreech body. At first I thought about developing it and printing it on a 3D printer. But I don’t have my own 3D printer, but what my colleagues at work on their self-assembled printers print doesn’t suit me the quality of appearance. Found on the market ready-made housing for a DIN-rail (of different sizes), look good, it is convenient to use (collapsible), and even a mole-fee for them is specially ready-made.
I bought the largest case so that not only Arduino with the izernet-shield would be housed in it, but also a relay for switching the load:
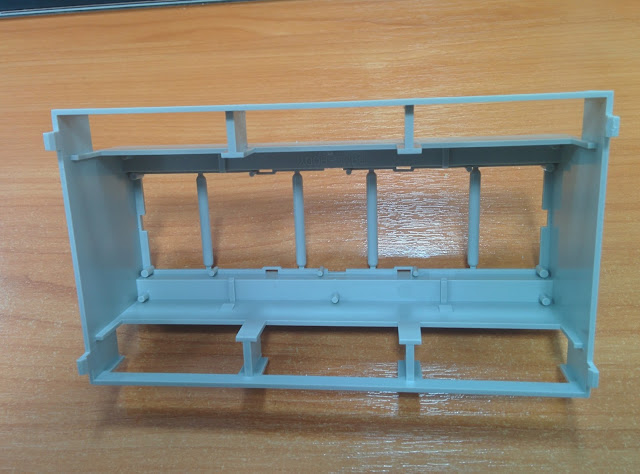
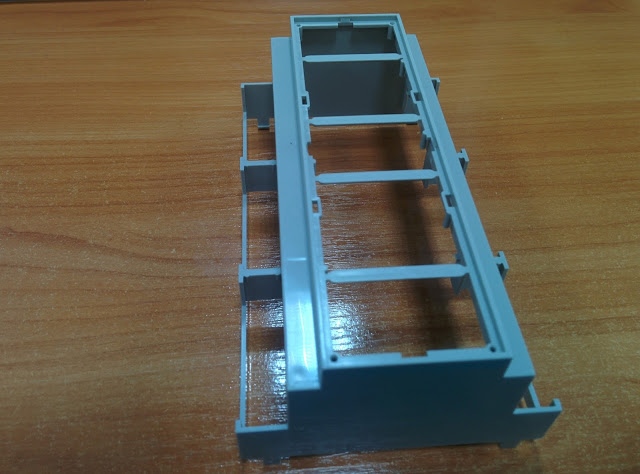
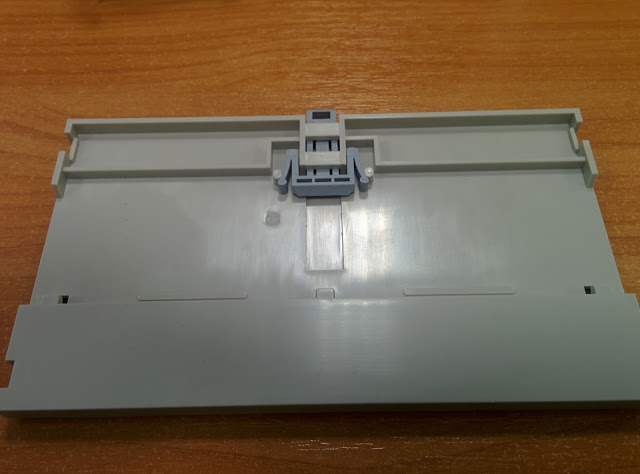
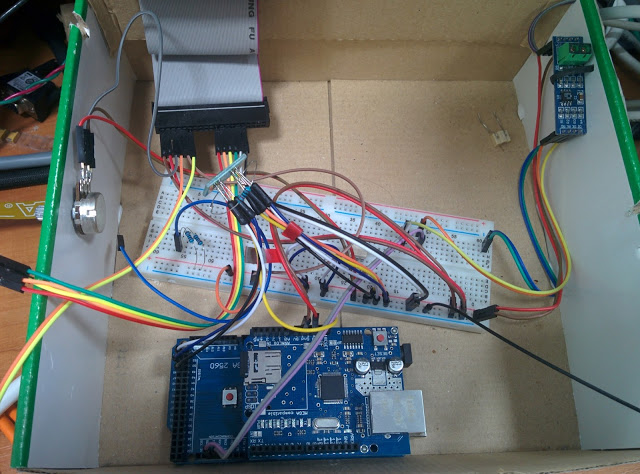
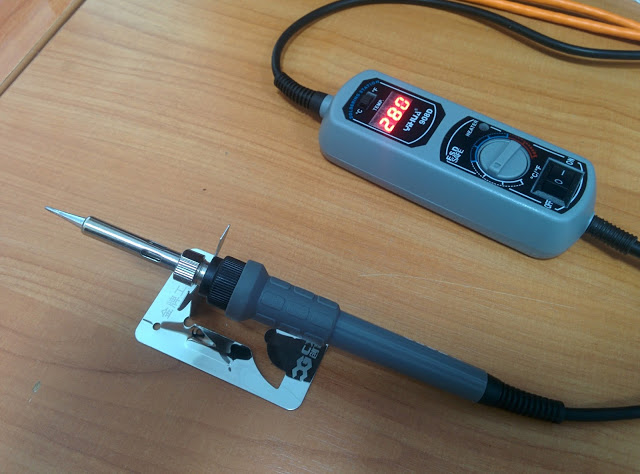
Next was a long and fascinating process of mounting all the tripe into the hull. Under this case, I even bought myself a wonderful soldering iron with a sleep function (my soldering irons were all still from Soviet times):
For installation, I bought a bunch of various small stands, screws, washers and gadgets. First approximate assembly:
To connect the wires to the top pins, we had to use bent pins, otherwise it would not fit into the case:
Insulating washers in some places had to cut:
And in some places, izgalyatsya more izvratno, lift the screw on the sleeve, and pretentiously trim the sleeve:
For a single relyushki there were not enough points of support, so it hung only on two points:
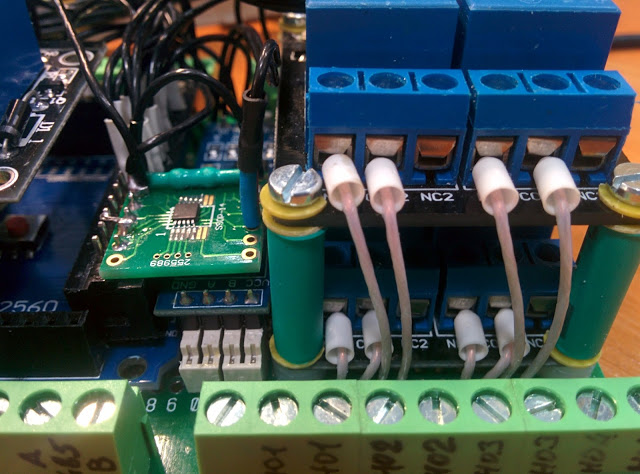
Estimated assembly with terminal blocks:

Then the odd job became gradually overgrown with wires. The board was used only for power distribution and for connections to terminal blocks. For signal connections, I used the MS-16 wire (I like it more), for power it did not pass through voltage (up to 100 V), therefore MGTF:

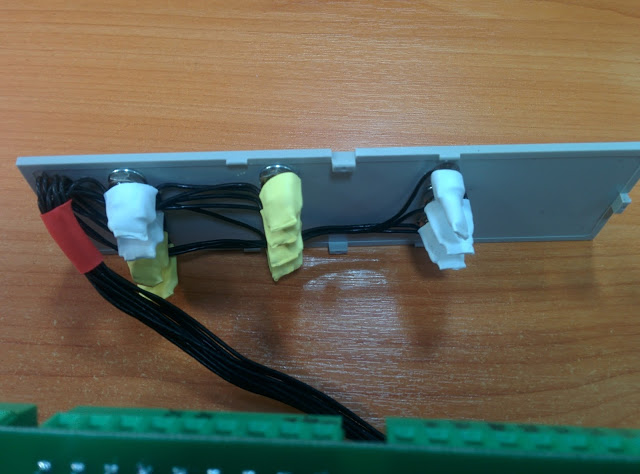
On the front panel I fixed the LEDs, the current-limiting resistors were soldered directly to the legs of the LEDs and closed with heat shrink:
The result was such a bearded stuffing:

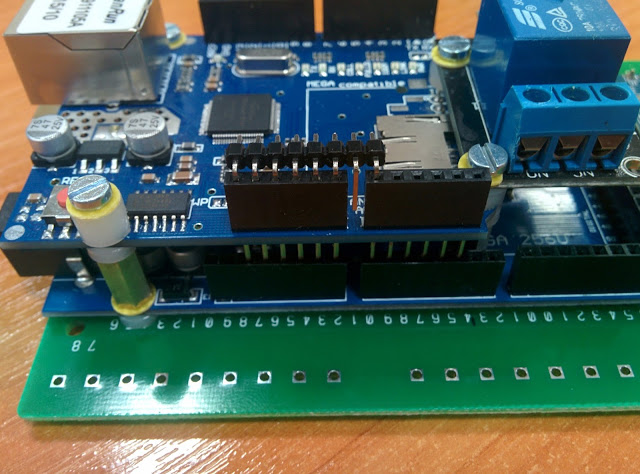
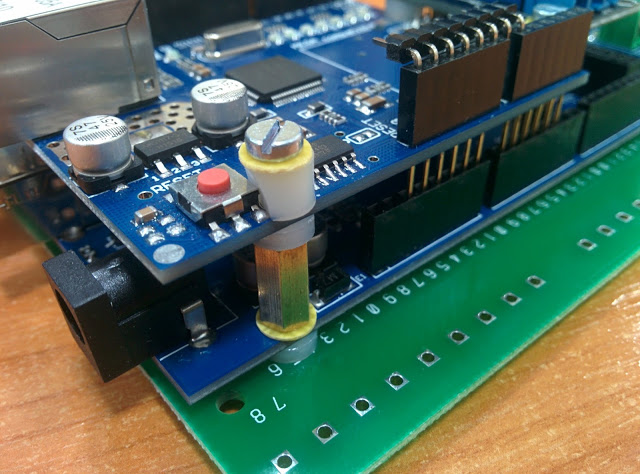
And here is a handkerchief with a microcircuit watchdog timer, nestled in the depths of my creation, right above the RS-485 level converter - TTL:
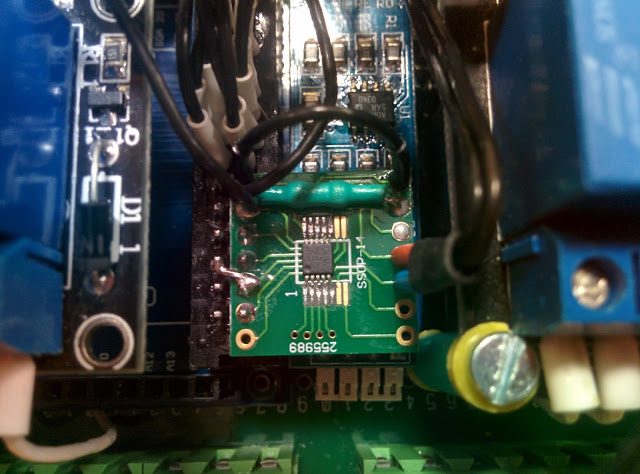
The whole structure is collapsible, everything can be removed, disconnected and replaced without soldering, except for the scarves with watchdog, it is soldered to the connector pins, clad on a number of IO-ports of Arduina.
In the box:

Holes for connectors Arduina cut in the plastic wall of the case. At first, I made the holes exactly according to the size of the connectors, but the assembly into the case needs to be started diagonally (otherwise there is simply no way) and the connectors did not go through, I had to squander some:

The inclusion of the finished product on the table, everything worked right away:

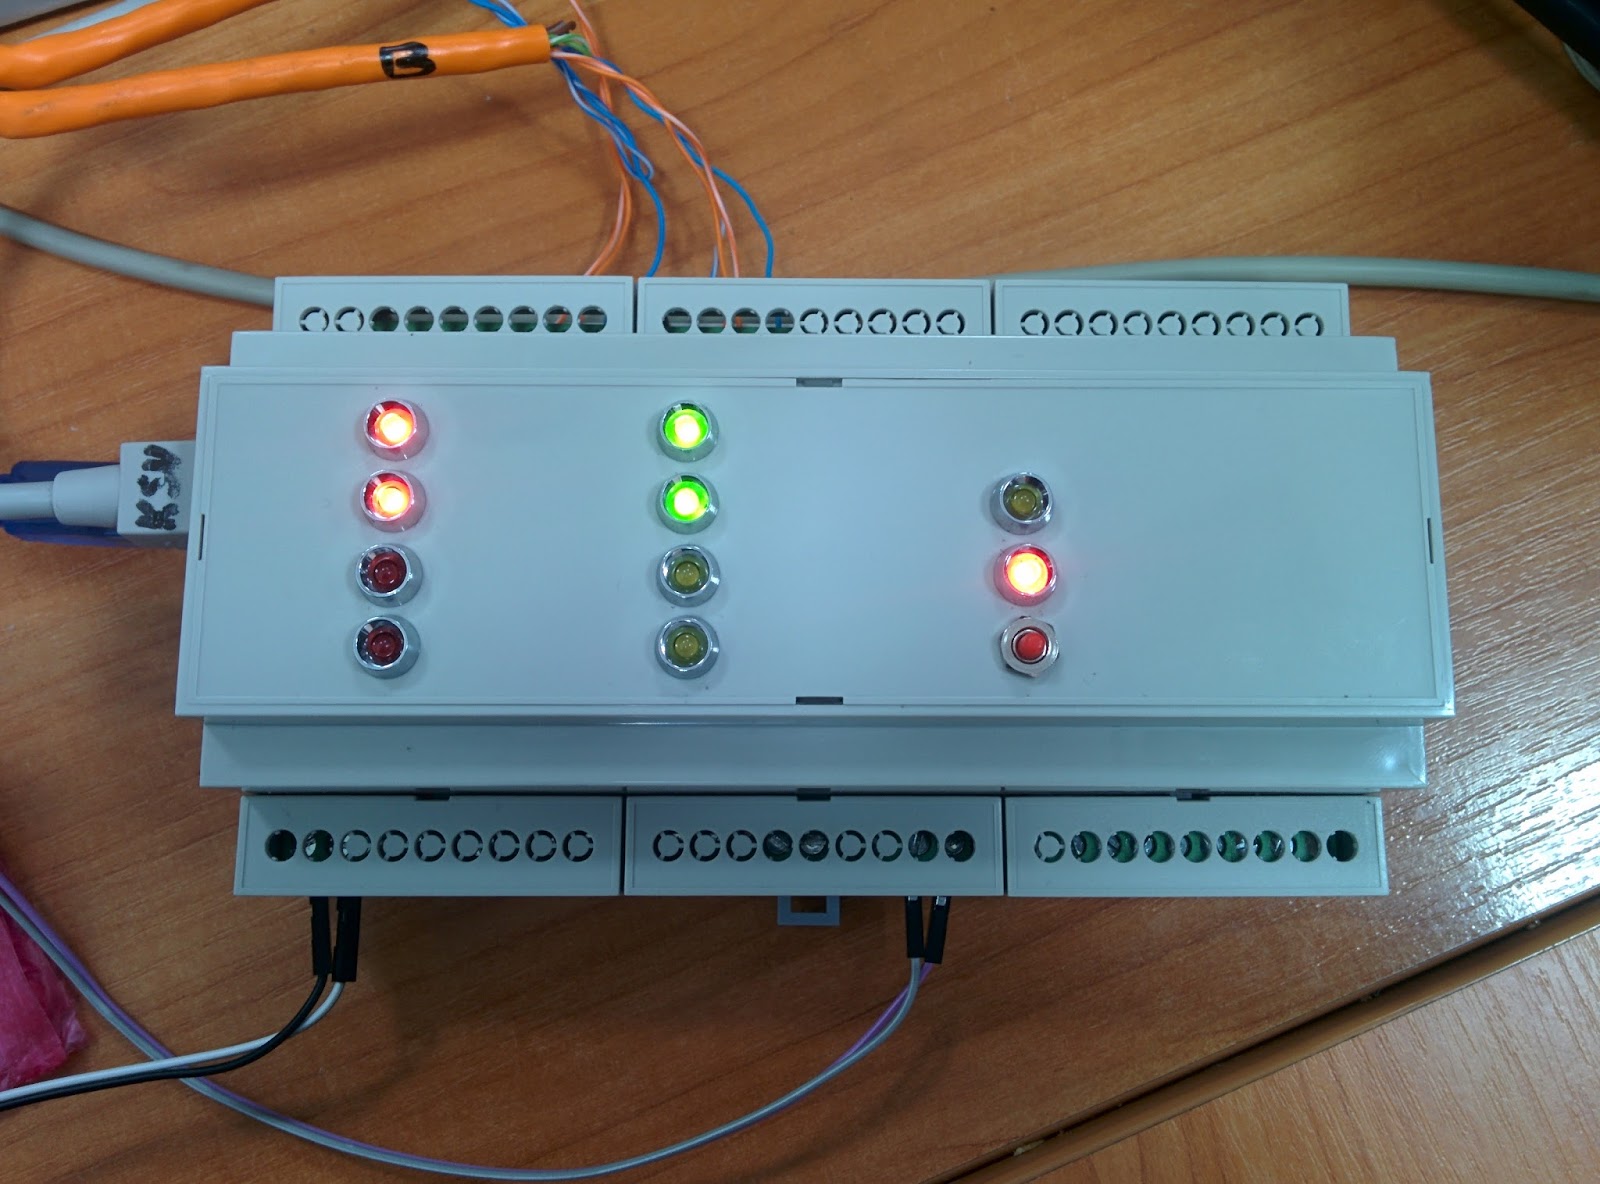
On the front panel brought:
- Four red LEDs - load indication;
- Two green - the connection with the meter and the VPN-server;
- Two yellow - spare;
- One yellow - indication of the router reboot;
- One red - food;
- And a reset button.
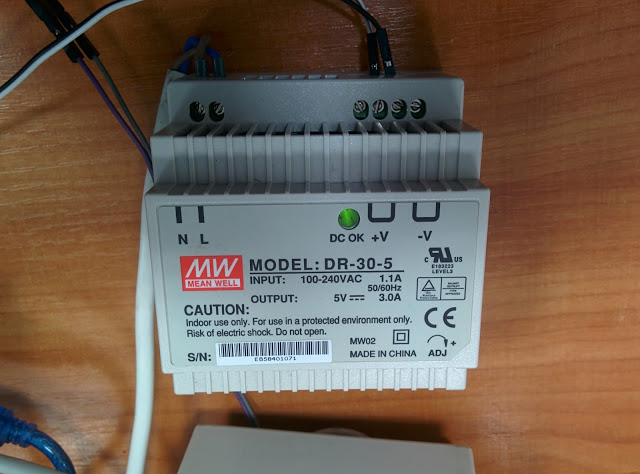
To get 5 volts from 220, I used a dinrayic power supply unit with output level adjustment, power was supplied directly to the microcontroller, bypassing the input converter from 7-12 to 5 volts. It was convenient for several reasons. First, the power of the built-in converter at some point was not enough, the current is limited there. Secondly, it was still necessary to power the relay with 5 volts. Thirdly, in the shield it is convenient to have a dinreech form factor in terms of installation. Therefore, here:
Tests
On the table everything was preverno, everything worked as it should, it was time to install the controller in the shield and check it in combat mode.
But first, I connected everything “on snot”, literally shoving all the noise into another shield, low-current, in order to test the operation of thermal sensors in real conditions on long lines laid in one cable channel with ~ 220V power cables:
As you can see in the photo above, until now I tried to control the reboot of the router by power using the Senseit smart socket. However, this device is insanely worth 5 thousand (in 2016) turned out to be extremely buggy and capricious. For a year of use, I have repeatedly forced me to arrive at the dacha at an inappropriate time unplanned, in order to manually take this miracle of engineering and marketing thought from deep down into GSM communications. With the transition to my Arduino controller, which turned out to be unlike more reliably, I was relieved to throw this “professional” junk in a beautiful box into a box, and forgot about it.

The test was successful, there were no failures, and it was possible to proceed with the final installation in a regular place:
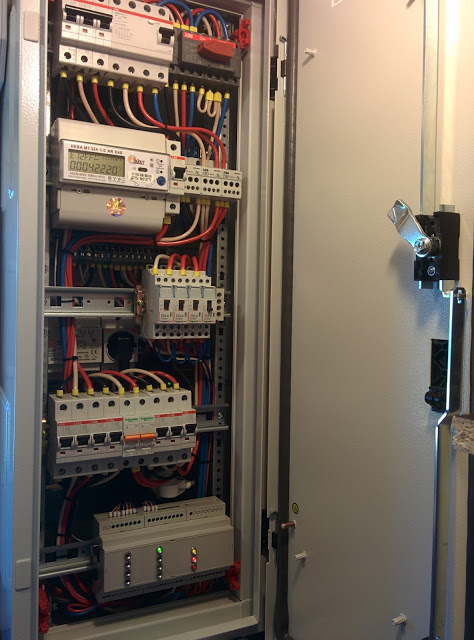
Yes, yes, this is a ABB TwinLine 800x300x225 IP55 shield, worth 25 thousand rubles. without filling (and filling for another 15 thousand approximately). And yes, it is installed in the change house 6x2. Everyone has their own cockroaches. Yes, I collected all the electrics myself . And built a shed too, yes. No, I'm not an electrician. And not a builder.

In the back of the dashboard, I positioned a small Powercom WOW 300 uninterruptible power supply, its green LED lights up there, and to the left and above it has its input power plug:

It lasts for ~ 40 minutes of autonomous operation of the Arduino device, a router with a USB modem and Wi-Fi, and Full HD IP cameras for outdoor surveillance.
And here you can see the white power plugs for two uninterrupted consumers - the Arduino power supply and the low-current dashboard, where the router and the power supply of the surveillance camera are located. This line goes with a break through the contactor, which is controlled by Arduino, just for the software program that reboots the power router in case of a VPN crash (the camera restarts at the same time, although it doesn’t need it). Twisted pair lines from temperature sensors are connected to the controller from above:

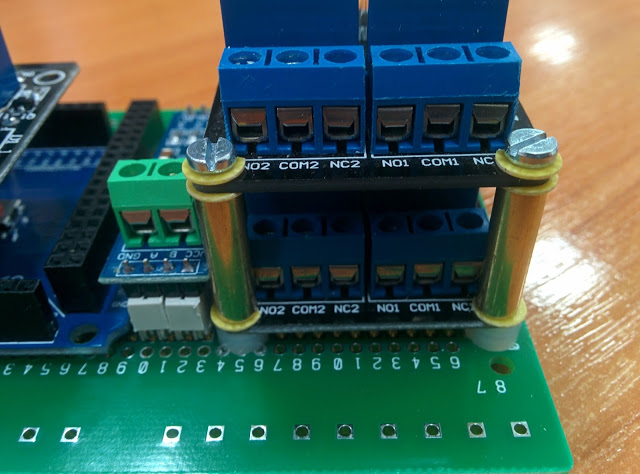
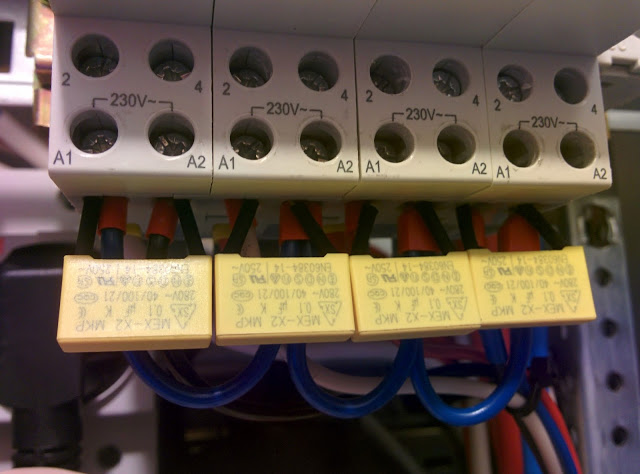
It should be noted that I would never trust the switching of a powerful load to small blue Chinese relyushechkas, despite the parameters of these relyushek that allow me to do this. Therefore, the use of the normal Legrand modular contactors cat. No. 4 125 01 with manual control was immediately put in place . That is, the relays inside the controller case control the contactors, and the contactors already control the load. It is reliable. But the power of the router and the camera is carried out only through this small blue Chinese relyushku, the current there is small, so you can.
At the first combat launch, I was in for a big disappointment. On the table, I experienced everything except the load. What for? Contactors click, and so it is clear that they will commute the load. But no, it was necessary to experience. Powerful electric convectors introduced noise into the system at the time of contact opening, which led to guaranteed freezing of the shielder. Moreover, it was only possible to remove it from the downstairs by removing the power, a simple reset did not help. Googled - yes, there is such a problem with this Chinese. And the library does not handle this situation. That is, the shitty piece of iron, and the software is not very.
I thought that everything was gone. I even ordered solid-state relays, but they, bastards, are bigger in height, and would not fit in my design. But then I thought that there might still be a hindrance. Googling again, found special anti-interference capacitors (so-called type X capacitors). Just connected them in parallel with the control winding of the contactors, and lo and behold! Hanging disappeared completely. For the past year of operation, not a single case has been registered:


But in this way you can look inside the box:


Well, the finished look of the shield with the plastron (the plugs were not given here):

For debugging and flashing, the USB cable is connected to the controller and is stored inside the shield behind the closed door (it will be temporarily disconnected from this photo):


The system has been operating for almost a year, it survived frosts up to 20 degrees without problems.
In general, I am pleased with the result. However, for more or less functional tasks, Arduino is clearly weak. I have repeatedly faced with running out of memory and had to cut and optimize. And the speed of work, especially with a memory card, does not suit me at all. Therefore, the future implementation of such handicrafts, if any, I would like to base on something more powerful. Colleagues PR me Raspberry Pi, a good option, I think.
Some may say “How many difficulties for such a primitive task,” and will probably be right. For me, this whole undertaking is a hobby, with a little excuse for meaning. Therefore, I was looking for entertainment wherever I could :)
Source: https://habr.com/ru/post/411141/
All Articles