It is easy to estimate PPFD when the plant is illuminated with white LEDs: 1000 lx = 15 µmol / s / m2
The article " Lighting plants with white LEDs " caused a lively discussion of practical problems, and it became clear that the methods should be simplified.
How can elementary recalculation of light intensity into units of photosynthetic active radiation: PPFD , YPFD and radiometric power density? And what of this really need?
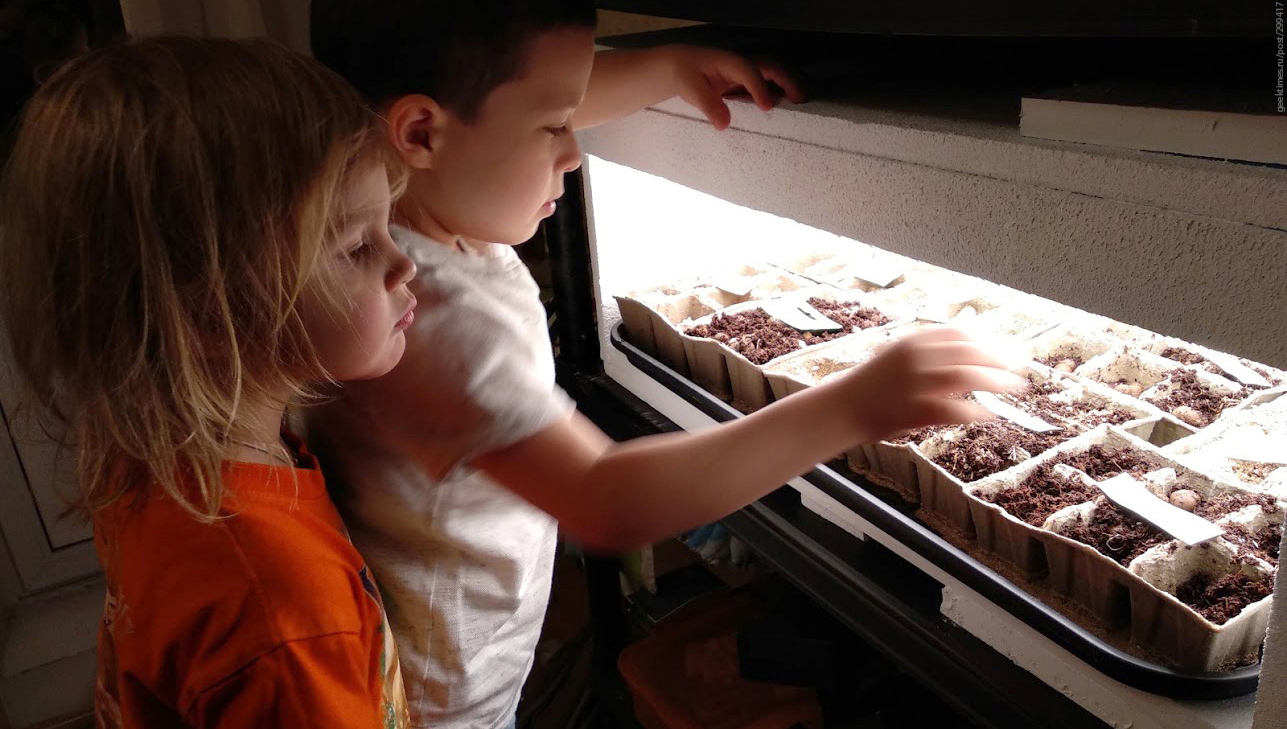
The title photo shows a lighting installation built by children, for which, unlike many commercial solutions, a complete set of parameters is known: {0.3 m 2 ; 50 watts; 11,000 lux; 3000 K ; R a = 98; 165 µmol / s / m 2 ; 24 × 7}. The parameters may not be optimal, but their entry allows the decision to discuss, learn from the experience, suggest and try other options. Do not make such entries in the educational project is incorrect and non-pedagogical.
')
To estimate the magnitude of the light of a plant with non-white light a spectrometer is required. White light illumination is measured by a much more affordable luxmeter . And since the shape of the spectrum of white light with sufficient for agrotechnical purposes, the accuracy is described usually known color temperature and color reproduction [1], the measurement of illumination in lux allows us to estimate the photosynthetically active radiation in any other units.
Under the white light, plants have evolved the entire history of life on Earth, grow well under it and in an artificial environment. The efficiency of modern white LED luminaires, expressed in μmol / J in the current range of 400 ... 700 nm, roughly corresponds to the best specialized DNaT and is slightly inferior to LED luminaires with a depleted spectrum [1]. What makes the use of white light energetically justified.
Project Phitex presented the results of an experiment on growing different crops under the same conditions, but under the light of a different spectrum. The experiment showed that the spectrum of the crop parameters is affected. It is extremely curious to compare plants grown under white light, under the light of DNaT and narrowband pink (Fig. 2).
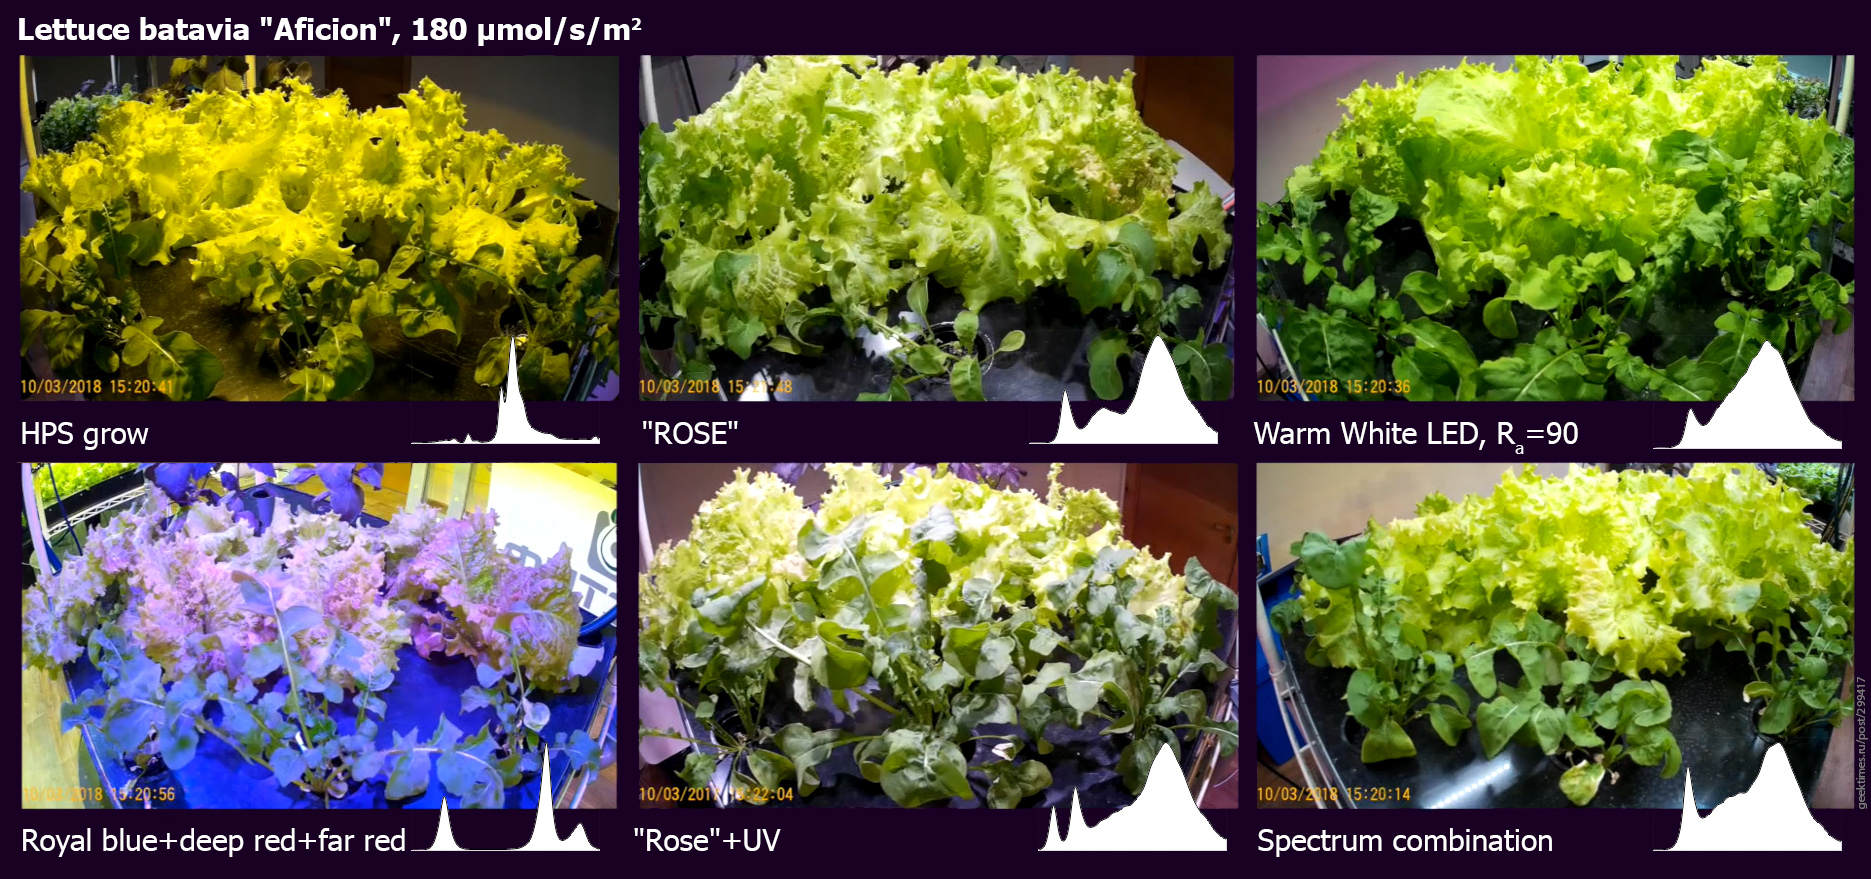
Fig. 2 Lettuce grown under the same conditions, but under the light of a different spectrum. Images from the videotape published by the Fiteks project in the materials of the conference “Technologies of Agrophotonics” in March 2018.
By numerical indicators, the first place was taken by a unique non-white spectrum under the commercial name Rose, which in form does not differ much from the tested warm white light of high color rendition R a = 90. Surprise it turned out that it is even less different from the spectrum of warm white light by extra-high color rendering R a = 98 (the same one used by children in the lighting system in the title picture). The main difference is that Rose has a small amount of energy removed from the central part (redistributed to the edges):
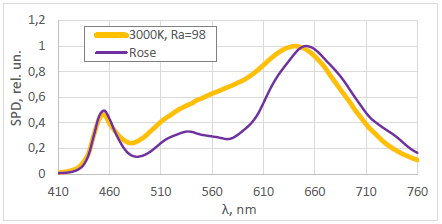
The redistribution of radiation energy from the center of the spectrum to the edges either does not lead to anything, or reduces the efficiency of photosynthesis of the leaves of the lower tier [2]. But the light turns pink.
Pink light or yellow light HPS can be used in industrial greenhouses. But when people share a common space with plants, white light is needed. For example, in educational projects, plants must be constantly observed and there is no alternative to white light with high color rendering, which ensures human visual comfort and good conditions for plant development [1].
A direct comparison of the spectra of light sources (Fig. 3) shows that the light of the most common white LEDs 4000 K / R a = 80 is richer than the spectrum of the DNaT and is somewhat inferior in content of the red component to the typical spectrum of pink light for illuminating plants with an established but obviously incorrect commercial name. " Grow light full spectrum ". White light of high color rendition in spectral composition is richer than the other options and closer to a continuous spectrum of natural light.
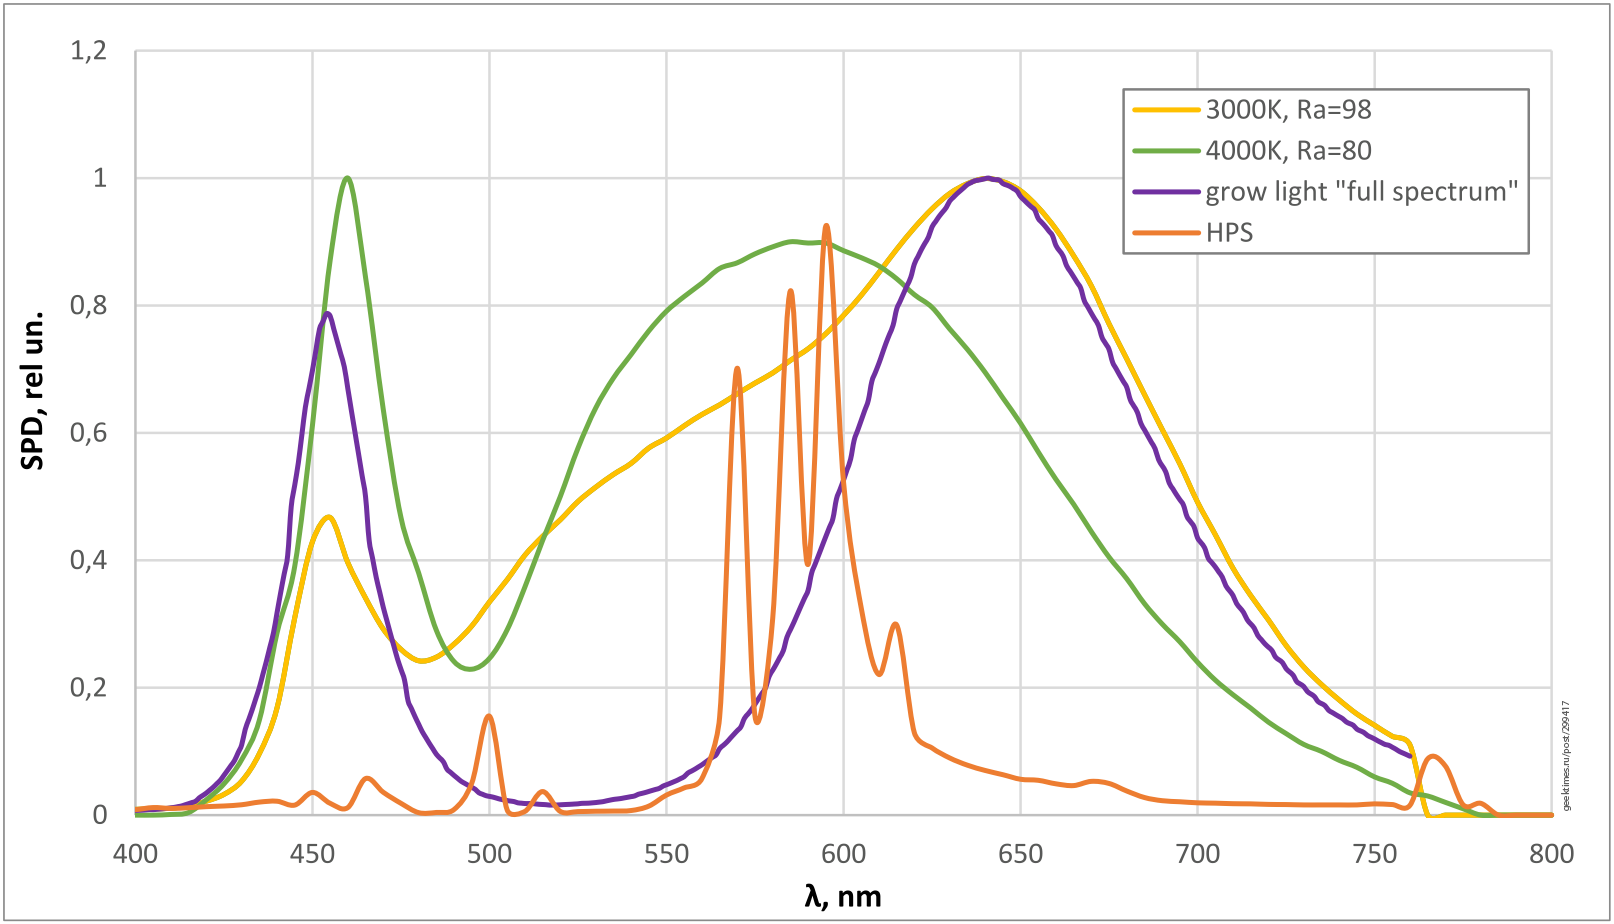
Fig. 3 Comparison of the spectra of white LED light and the main options for specialized light for growing plants
The graphs show that the growth of color rendition of white light leads to an increase in the proportion of light that is useless for photosynthesis with a wavelength of more than 700 nm. But this proportion does not exceed a few percent and is not higher than that of the “ grow light full spectrum ”.
Spectral components that perform only the signal function, and not included in the spectrum of white LED light - primarily 400 nm and 730 nm, can be added to white light using separate lamps with narrow-band LEDs. Testing the feasibility of such an additive and determining its optimal intensity for each crop grown is quite simple. But the first thing to be satisfied is the basic need of a plant for light - energy.
The parameter LER [lm / W] has the same dimension as the light return η [lm / W], which characterizes the luminaire, but denotes the luminous flux in lumens, corresponding to one watt of radiometric radiation power.
The LER is weakly dependent on the color temperature of the CCT, and has a significant variation with a fixed color rendition R a (Fig. 4). As an estimate of the LER, you can use the rounded value LER = 300 lm / W.
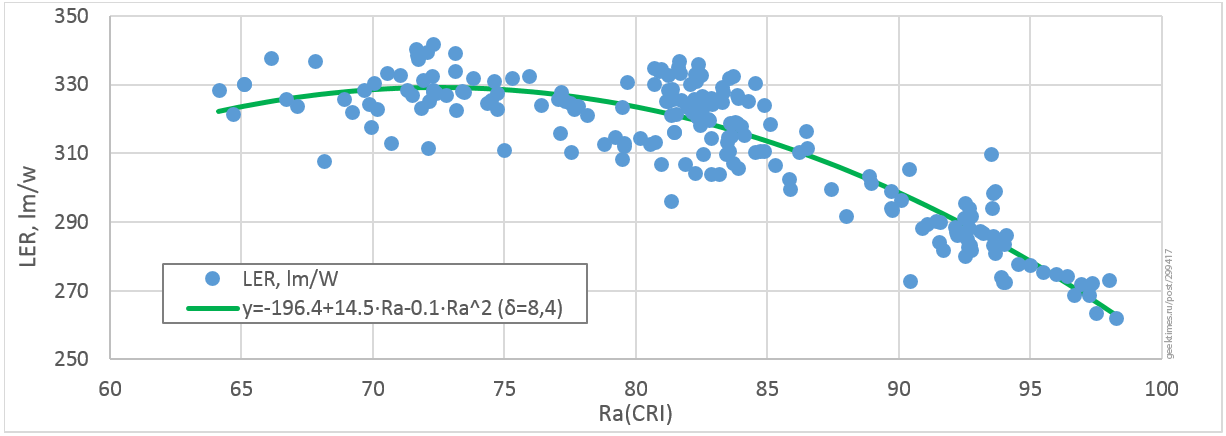
Fig. 4 Dependence of LER white LED light on the overall color rendering index
Knowing the LER , it is easy to calculate the radiometric power by the formula W = F / LER and the radiometric power density W / S = E / LER , where W [W] is the radiometric power, F [lm] is the luminous flux, S [m 2 ] - the area on which the luminous flux falls, E [lx] is the illuminance.
If it is necessary to maximize the radiometric power for a given power consumption, the luminaire can be selected by the criterion of maximum energy efficiency, which is calculated by the formula: Efficiency = 100% · η / LER , where η [lm / W] is the light output of the luminaire.
Radiometric light density is rarely used in plant lighting recommendations. The LER estimate is useful in understanding that the radiometric flux density is proportional to the illumination in lux, and the spectral parameters of white light can be neglected in the first approximation. The LER estimate also makes it possible to estimate the efficiency of a lighting installation as a whole using the formula Efficiency = 100% · E · S / LER / P , where E [lx] is the actual measured illumination created on the area S [m 2 ] by the lighting installation consuming power P [ W]. Efficiency is an important integral parameter of performance monitoring.
The energy value of light for a plant is determined by the PPF (Photosynthetic Photon Flux) in micromoles per second in the range 400 ... 700 nm, or more precisely the YPF (Yield Photon Flux) value, taking into account the correction for the McCree 1972 curve [4]. Most of the data cited in the scientific literature, which must be relied upon in evaluating the lighting system, operate on PPF values, and this makes an interesting analysis of the ratio of PPF and YPF .
For white light between PPF and YPF, the dependence is quite close, weakly dependent on color rendition and is determined by the color temperature (Fig. 5).
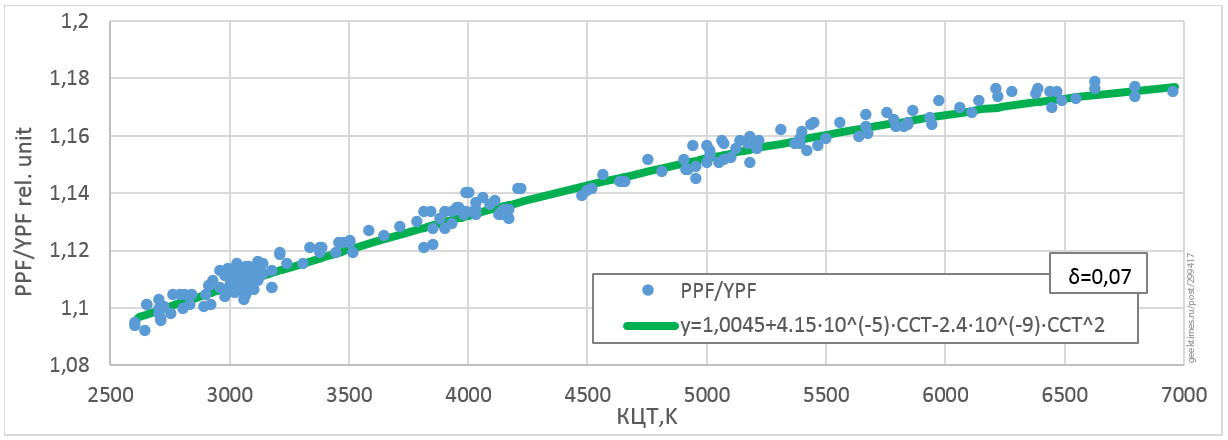
Fig. 5 Dependence of the ratio between PPF and YPF on the white color temperature
For practical purposes, it is enough to take into account that the dependence is almost linear and PPF for 3000 K is more than YPF by about 10%, and for 5000 K it is 15%. Which means about 5% greater energy value for a plant of warm light compared to a cold one with equal illumination in lux.
For typical values of the spectral parameters PPF and PPFD are obtained as follows:
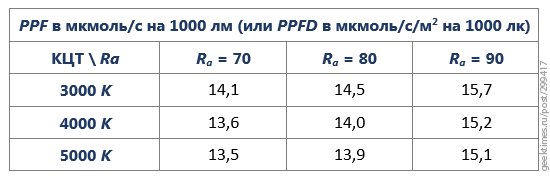
It is seen that a slightly higher energy value for a plant with equal illumination has warm light and light with high color rendition.
The values in the table differ from the round value of 15 units by no more than 7%, therefore for practical purposes the following rule can be used: a flow of 1000 lm corresponds to PPF = 15 μmol / s, and an illumination of 1000 lx corresponds to PPFD = 15 μmol / s / m 2 .
According to data from [3], specialized DNaT for lighting greenhouses with a capacity of 600 ... 1000 W have an efficiency of about 1.6 μmol / J, 1000 lm of light flux correspond to about PPF = 12 μmol / s, and an illumination of 1000 lux corresponds to about PPFD = 12 µmol / s / m 2 . Thus, white light for a plant is a quarter “calorie-rich” compared to the light of HPS, and the same illumination in lux means a greater PPF.
Also, these data allow to recalculate suites for DNaT in μmol / s / m 2 and to use the experience of lighting plants in industrial greenhouses.
The coefficient of use of the luminous flux k is the fraction of the luminous flux from the lighting installation, falling on the leaves of plants. This value can be used, for example, to estimate PPFD using the formula: PPFD [μmol / s / m 2 ] = k · 15 · F [km] / S [m 2 ], where F is the luminous flux in kilolumens, S is illuminated area in square meters.
The uncertainty of k increases the error of the estimate. Consider the possible values of k for the main types of lighting systems:
1) Point and line sources
The illumination created by a point source in the local area decreases inversely with the square of the distance between this area and the source. The illumination created by linear long sources over narrow beds decreases inversely with the distance.
The fall in illumination is not due to the fact that light "weakens" with distance, but due to the fact that with increasing distance, an increasing proportion of light does not fall on the leaves. This makes it extremely disadvantageous to light single plants or single long beds with highly suspended lamps. Narrowing light flux optics allows you to send a large fraction of the light flux to the plant, but in general it is not known what.
The strong dependence of light on the distance and the uncertainty of the effect of using optics do not allow us to determine the coefficient of use of k in the general case.
2) Reflective surfaces
When using closed volumes with perfectly reflective walls, the entire luminous flux enters the plant. However, the real reflection coefficient of mirror or white surfaces is less than unity. And this leads to the fact that the fraction of the luminous flux falling on the plants still depends on the reflective properties of the surfaces and the geometry of the volume. And it is generally impossible to determine k.
3) Large arrays of sources over large landing areas
Large arrays of point or linear lamps over large areas of landings are energetically beneficial. A quantum emitted in any direction, on some sheet, will fall, the coefficient k is close to unity.
For example, the “children's” lighting system on the main photo combines the advantages of a large array of light sources (LED tapes mounted on a smooth stationery tape) and reflective surfaces (painted with white water-dispersion paint), the actual value of the light flux utilization factor for it k > 0.9.
Intermediate conclusion: for all considered geometries of the lighting installation, the uncertainty of the fraction of light going to the plants is higher than the difference between PPFD and YPFD , and higher than the error determined by the uncertainty of color temperature and color reproduction. Consequently, for practical assessment of the intensity of photosynthetically active radiation, it is advisable to choose a rather crude method of estimating the light intensity that does not take into account these nuances. And if possible, measure the actual illumination with a luxmeter.
In direct measurements, it is necessary to take into account the unevenness of illumination created by the lighting installation. A typical example: the standard EN 12464-1 "The Lighting of Workplaces" requires a ratio of minimum illumination to average not more than 0.7. What in practice means the difference in illumination of different areas up to 30% and a significant error of the average value with a small number of measurements.
In addition, a few percent of the true values may differ indications of the luxmeter in accordance with its accuracy class. So GOST 24940-2016 "Buildings and facilities. Methods of measuring illumination "requires the use of luxmeters with an error of no more than 10%, and the most common in the Russian model of luxmeters" eLight02 "and" TKA-PKM "have an error of 8%.
In accordance with the law of the limiting factor (“Liebig's Barrel”), the deficient factor, which may be light, affects the yield linearly. However, the optimal level of PPFD is usually chosen according to the criterion of yield maximization, and therefore, at the border or abroad of linear dependence. For example, in work [5], the optimal illumination intensity of Chinese cabbage PPFD = 340 µmol / s / m 2 was determined, and the argument was used as a criterion that at high light levels, the yield increases with light so that it becomes economically unfeasible to increase light. In a private message, the authors of this work indicated that with an improved method of growing the same culture, a linear increase in yield was observed under illuminances up to 500 μmol / s / m 2 .
Thus, the situation of a significant effect of the PPFD level on the yield itself is a sign of insufficient light levels. A sufficient amount of light eliminates the significance of the error in determining the level of illumination and makes the use of high-precision estimates unjustified.
The most adequate assessment of the photosynthetically active flux of white light is achieved by measuring the illuminance E with a luxmeter, neglecting the effect of spectral parameters on the energy value of light for a plant, and evaluating the PPFD of white LED light by the formula:
The author is grateful for the help in the preparation of the article to the staff member of the State Scientific Center of the Russian Federation-IMBP RAS, Irina O. Konovalova; Gorshkoff.ru Technical Director Nikolay N. Sleptsov; CREE specialist Michael Chervinsky; lighting engineering to Anna G. Savitskaya; Senior Researcher of IRE RAS, Ph.D. Alexander A. Sharakshane, Leading Researcher, IRE RAS and Professor I.M. Sechenov, Doctor of Physics and Mathematics Andrei A. Anosov.
How can elementary recalculation of light intensity into units of photosynthetic active radiation: PPFD , YPFD and radiometric power density? And what of this really need?
Measurement and recording of lighting installation parameters
The title photo shows a lighting installation built by children, for which, unlike many commercial solutions, a complete set of parameters is known: {0.3 m 2 ; 50 watts; 11,000 lux; 3000 K ; R a = 98; 165 µmol / s / m 2 ; 24 × 7}. The parameters may not be optimal, but their entry allows the decision to discuss, learn from the experience, suggest and try other options. Do not make such entries in the educational project is incorrect and non-pedagogical.
')
To estimate the magnitude of the light of a plant with non-white light a spectrometer is required. White light illumination is measured by a much more affordable luxmeter . And since the shape of the spectrum of white light with sufficient for agrotechnical purposes, the accuracy is described usually known color temperature and color reproduction [1], the measurement of illumination in lux allows us to estimate the photosynthetically active radiation in any other units.
When white light is not only justified, but also desirable
Under the white light, plants have evolved the entire history of life on Earth, grow well under it and in an artificial environment. The efficiency of modern white LED luminaires, expressed in μmol / J in the current range of 400 ... 700 nm, roughly corresponds to the best specialized DNaT and is slightly inferior to LED luminaires with a depleted spectrum [1]. What makes the use of white light energetically justified.
Project Phitex presented the results of an experiment on growing different crops under the same conditions, but under the light of a different spectrum. The experiment showed that the spectrum of the crop parameters is affected. It is extremely curious to compare plants grown under white light, under the light of DNaT and narrowband pink (Fig. 2).
Fig. 2 Lettuce grown under the same conditions, but under the light of a different spectrum. Images from the videotape published by the Fiteks project in the materials of the conference “Technologies of Agrophotonics” in March 2018.
By numerical indicators, the first place was taken by a unique non-white spectrum under the commercial name Rose, which in form does not differ much from the tested warm white light of high color rendition R a = 90. Surprise it turned out that it is even less different from the spectrum of warm white light by extra-high color rendering R a = 98 (the same one used by children in the lighting system in the title picture). The main difference is that Rose has a small amount of energy removed from the central part (redistributed to the edges):
The redistribution of radiation energy from the center of the spectrum to the edges either does not lead to anything, or reduces the efficiency of photosynthesis of the leaves of the lower tier [2]. But the light turns pink.
Pink light or yellow light HPS can be used in industrial greenhouses. But when people share a common space with plants, white light is needed. For example, in educational projects, plants must be constantly observed and there is no alternative to white light with high color rendering, which ensures human visual comfort and good conditions for plant development [1].
Comparison of various spectra variants for plant lighting
A direct comparison of the spectra of light sources (Fig. 3) shows that the light of the most common white LEDs 4000 K / R a = 80 is richer than the spectrum of the DNaT and is somewhat inferior in content of the red component to the typical spectrum of pink light for illuminating plants with an established but obviously incorrect commercial name. " Grow light full spectrum ". White light of high color rendition in spectral composition is richer than the other options and closer to a continuous spectrum of natural light.
Fig. 3 Comparison of the spectra of white LED light and the main options for specialized light for growing plants
The graphs show that the growth of color rendition of white light leads to an increase in the proportion of light that is useless for photosynthesis with a wavelength of more than 700 nm. But this proportion does not exceed a few percent and is not higher than that of the “ grow light full spectrum ”.
Spectral components that perform only the signal function, and not included in the spectrum of white LED light - primarily 400 nm and 730 nm, can be added to white light using separate lamps with narrow-band LEDs. Testing the feasibility of such an additive and determining its optimal intensity for each crop grown is quite simple. But the first thing to be satisfied is the basic need of a plant for light - energy.
LER : Luminaire Efficacy Rating
The parameter LER [lm / W] has the same dimension as the light return η [lm / W], which characterizes the luminaire, but denotes the luminous flux in lumens, corresponding to one watt of radiometric radiation power.
The LER is weakly dependent on the color temperature of the CCT, and has a significant variation with a fixed color rendition R a (Fig. 4). As an estimate of the LER, you can use the rounded value LER = 300 lm / W.
Fig. 4 Dependence of LER white LED light on the overall color rendering index
Knowing the LER , it is easy to calculate the radiometric power by the formula W = F / LER and the radiometric power density W / S = E / LER , where W [W] is the radiometric power, F [lm] is the luminous flux, S [m 2 ] - the area on which the luminous flux falls, E [lx] is the illuminance.
If it is necessary to maximize the radiometric power for a given power consumption, the luminaire can be selected by the criterion of maximum energy efficiency, which is calculated by the formula: Efficiency = 100% · η / LER , where η [lm / W] is the light output of the luminaire.
Radiometric light density is rarely used in plant lighting recommendations. The LER estimate is useful in understanding that the radiometric flux density is proportional to the illumination in lux, and the spectral parameters of white light can be neglected in the first approximation. The LER estimate also makes it possible to estimate the efficiency of a lighting installation as a whole using the formula Efficiency = 100% · E · S / LER / P , where E [lx] is the actual measured illumination created on the area S [m 2 ] by the lighting installation consuming power P [ W]. Efficiency is an important integral parameter of performance monitoring.
The energy value of a light unit
The energy value of light for a plant is determined by the PPF (Photosynthetic Photon Flux) in micromoles per second in the range 400 ... 700 nm, or more precisely the YPF (Yield Photon Flux) value, taking into account the correction for the McCree 1972 curve [4]. Most of the data cited in the scientific literature, which must be relied upon in evaluating the lighting system, operate on PPF values, and this makes an interesting analysis of the ratio of PPF and YPF .
For white light between PPF and YPF, the dependence is quite close, weakly dependent on color rendition and is determined by the color temperature (Fig. 5).
Fig. 5 Dependence of the ratio between PPF and YPF on the white color temperature
For practical purposes, it is enough to take into account that the dependence is almost linear and PPF for 3000 K is more than YPF by about 10%, and for 5000 K it is 15%. Which means about 5% greater energy value for a plant of warm light compared to a cold one with equal illumination in lux.
PPF and PPFD
For typical values of the spectral parameters PPF and PPFD are obtained as follows:
It is seen that a slightly higher energy value for a plant with equal illumination has warm light and light with high color rendition.
The values in the table differ from the round value of 15 units by no more than 7%, therefore for practical purposes the following rule can be used: a flow of 1000 lm corresponds to PPF = 15 μmol / s, and an illumination of 1000 lx corresponds to PPFD = 15 μmol / s / m 2 .
According to data from [3], specialized DNaT for lighting greenhouses with a capacity of 600 ... 1000 W have an efficiency of about 1.6 μmol / J, 1000 lm of light flux correspond to about PPF = 12 μmol / s, and an illumination of 1000 lux corresponds to about PPFD = 12 µmol / s / m 2 . Thus, white light for a plant is a quarter “calorie-rich” compared to the light of HPS, and the same illumination in lux means a greater PPF.
Also, these data allow to recalculate suites for DNaT in μmol / s / m 2 and to use the experience of lighting plants in industrial greenhouses.
Estimation of the utilization of light
The coefficient of use of the luminous flux k is the fraction of the luminous flux from the lighting installation, falling on the leaves of plants. This value can be used, for example, to estimate PPFD using the formula: PPFD [μmol / s / m 2 ] = k · 15 · F [km] / S [m 2 ], where F is the luminous flux in kilolumens, S is illuminated area in square meters.
The uncertainty of k increases the error of the estimate. Consider the possible values of k for the main types of lighting systems:
1) Point and line sources
The illumination created by a point source in the local area decreases inversely with the square of the distance between this area and the source. The illumination created by linear long sources over narrow beds decreases inversely with the distance.
The fall in illumination is not due to the fact that light "weakens" with distance, but due to the fact that with increasing distance, an increasing proportion of light does not fall on the leaves. This makes it extremely disadvantageous to light single plants or single long beds with highly suspended lamps. Narrowing light flux optics allows you to send a large fraction of the light flux to the plant, but in general it is not known what.
The strong dependence of light on the distance and the uncertainty of the effect of using optics do not allow us to determine the coefficient of use of k in the general case.
2) Reflective surfaces
When using closed volumes with perfectly reflective walls, the entire luminous flux enters the plant. However, the real reflection coefficient of mirror or white surfaces is less than unity. And this leads to the fact that the fraction of the luminous flux falling on the plants still depends on the reflective properties of the surfaces and the geometry of the volume. And it is generally impossible to determine k.
3) Large arrays of sources over large landing areas
Large arrays of point or linear lamps over large areas of landings are energetically beneficial. A quantum emitted in any direction, on some sheet, will fall, the coefficient k is close to unity.
For example, the “children's” lighting system on the main photo combines the advantages of a large array of light sources (LED tapes mounted on a smooth stationery tape) and reflective surfaces (painted with white water-dispersion paint), the actual value of the light flux utilization factor for it k > 0.9.
Intermediate conclusion: for all considered geometries of the lighting installation, the uncertainty of the fraction of light going to the plants is higher than the difference between PPFD and YPFD , and higher than the error determined by the uncertainty of color temperature and color reproduction. Consequently, for practical assessment of the intensity of photosynthetically active radiation, it is advisable to choose a rather crude method of estimating the light intensity that does not take into account these nuances. And if possible, measure the actual illumination with a luxmeter.
Illumination measurement error
In direct measurements, it is necessary to take into account the unevenness of illumination created by the lighting installation. A typical example: the standard EN 12464-1 "The Lighting of Workplaces" requires a ratio of minimum illumination to average not more than 0.7. What in practice means the difference in illumination of different areas up to 30% and a significant error of the average value with a small number of measurements.
In addition, a few percent of the true values may differ indications of the luxmeter in accordance with its accuracy class. So GOST 24940-2016 "Buildings and facilities. Methods of measuring illumination "requires the use of luxmeters with an error of no more than 10%, and the most common in the Russian model of luxmeters" eLight02 "and" TKA-PKM "have an error of 8%.
The effect of an error in the PPFD value on the result
In accordance with the law of the limiting factor (“Liebig's Barrel”), the deficient factor, which may be light, affects the yield linearly. However, the optimal level of PPFD is usually chosen according to the criterion of yield maximization, and therefore, at the border or abroad of linear dependence. For example, in work [5], the optimal illumination intensity of Chinese cabbage PPFD = 340 µmol / s / m 2 was determined, and the argument was used as a criterion that at high light levels, the yield increases with light so that it becomes economically unfeasible to increase light. In a private message, the authors of this work indicated that with an improved method of growing the same culture, a linear increase in yield was observed under illuminances up to 500 μmol / s / m 2 .
Thus, the situation of a significant effect of the PPFD level on the yield itself is a sign of insufficient light levels. A sufficient amount of light eliminates the significance of the error in determining the level of illumination and makes the use of high-precision estimates unjustified.
Conclusion
The most adequate assessment of the photosynthetically active flux of white light is achieved by measuring the illuminance E with a luxmeter, neglecting the effect of spectral parameters on the energy value of light for a plant, and evaluating the PPFD of white LED light by the formula:
Thanks
The author is grateful for the help in the preparation of the article to the staff member of the State Scientific Center of the Russian Federation-IMBP RAS, Irina O. Konovalova; Gorshkoff.ru Technical Director Nikolay N. Sleptsov; CREE specialist Michael Chervinsky; lighting engineering to Anna G. Savitskaya; Senior Researcher of IRE RAS, Ph.D. Alexander A. Sharakshane, Leading Researcher, IRE RAS and Professor I.M. Sechenov, Doctor of Physics and Mathematics Andrei A. Anosov.
Literature
Literature
[1] Sharakshane A., 2017, Whole high-quality light environment for humans and plants. Life Sci. Space Res. doi.org/10.1016/j.lssr.2017.07.001
[2] Avercheva, OV, Berkovich, Yu.A., Konovalova, IO, Radchenko, SG, Lapach, SN, Bassarskaya, EM, Kochetova, GV, Zhigalova, TV, Yakovleva, OS, Tarakanov, IG, 2016. Optimizing LED ratios and intermittent light pulses. Life Sci. Space Res. dx.doi.org/10.1016/j.lssr.2016.12.001
[3] Sharakshane A., 2017, White LED Lighting for Plants. Biorxiv.org, doi.org/10.1101/215095
(in Russian translation published at: geektimes.ru/post/293045 )
[4] McCree, KJ (1972) Action Spectrum, Absorption and Quantum Yield of Photosynthesis in Crop Plants. Agricultural Meteorology, 9, 191-216. http://doi.org/10.1016/0002-1571(71)90022-7
[5] Konovalova, I.O., Berkovich, Yu.A., Smolyanina, SO, Pomelova, MA, Erokhin, AN, Yakovleva, OS, Tarakanov, I.G. The influence of the parameters of the light regime on the accumulation of nitrates in the aboveground biomass of Chinese cabbage (Brassica chinensis L.) when grown with LED irradiators. Agrochemistry. 2015. No. 11. P. 63–70.
This post is an adapted translation of the article " An easy estimate of the PFDD for a plant illuminated with white LEDs: 1000 lx = 15 μmol / s / m 2 ". The methods and details of the calculations in Russian were not translated. But the language is simpler, examples and pictures are added.
Source: https://habr.com/ru/post/411099/
All Articles