Samsung Artik Cloud: Quick Start Guide
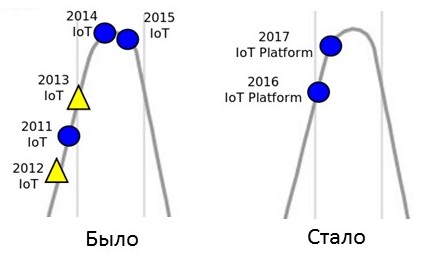
The subject of the Internet of Things platforms is now on the “HYIP” wave, which is confirmed by the Gartner curve of the main technological trends : since 2016, the “Internet of IoT Platforms” replaced the “Internet of Things” on the chart.
Today we will talk about what Samsung offers, and, above all, about the Samsung Artik Cloud.
Content:
')
The IoT platform, as a rule, is understood as a ready-made integrated solution of several components that helps speed up the process of bringing the IoT product to the market.
What components should such a platform ideally have? According to the author of the article “5 Things To Know About The IoT Platform Ecosystem” from IoT Analytics, the platform should consist of 8 functional components:
Tab. one.

At the moment, not all Internet of Things platforms have the listed components. As a rule, focus is on some of them: for example, Amazon AWS doesn’t have an ordinary database in which a permanent virtual “Shadow” of the device is created, IBM Bluemix has the ability to use the Watson analytics service, and in PTC ThingWorx you can easily create a graphical interface applications.
In 2016, Samsung released the Artik family, which currently includes:
An interesting point: Samsung releases under a single name both a software platform and a hardware solution, moreover at different levels: from the smallest and computationally weak Artik 0 to powerful and productive Artik 7.
Another interesting point: recently, in 2017, Samsung announced the merging of several technologies under the common name SmartThings Cloud: Samsung Connect (specialized routers of the Smart Home), SmartThings (home automation solutions) and the Artik family. In this case, all existing functionality will be preserved.
The official website of the product is on the link .
If we consider the Samsung Artik Cloud from the point of view of the list of functional components (see Table 1), we get the following:
Table 2

Of the key components, there is currently no analytics and machine learning component. But this year, Samsung announced the opening of an additional 4 new research centers of artificial intelligence around the world. So there is every reason to believe that work in this area is included in the company's strategic plans.
It's simple. Up to 100,000 messages per month can be sent for free. Unlike other similar services, you do not need to bind a bank card before use. They will not demand it from you at all. You will have to pay only if you decide to use Artik Cloud in a real task, where the number of messages per day and per month is critical - in this case, the cost of 1 million messages will be $ 15.
That is why Artik Cloud is great for teaching students: if you use it only in class, the chances of exhausting the quota are very small.
At the moment, you can interact with Artik Cloud in four ways at once:
Noteworthy is the support of two protocols at once, which are widely used precisely on the Internet of things: MQTT and CoAP.
Artik Cloud is still a young product (it appeared in 2016). Some features are still in Beta. For example, in the device simulator you cannot work with more than one device.
Documentation is evolving. For example, now the REST API is very well documented, and the MQTT API documentation needs some work.
And now we suggest you create a virtual device - a GPS tracker that will generate random data. Then we will access this data from the computer.
Go to the site https://my.artik.cloud/
There are several registration options. The easiest is to use an existing Google account. Spam will not be sent! Tested on personal experience.

You will be taken to the user page https://artik.cloud/ .
Here you can add devices to your system, watch logs, set interaction rules. Now, almost nothing can be done on it, because the devices and sensors we need are not among the options offered. Immediately go to the developer page: https://developer.artik.cloud/

Create a new device type.
Next, you need to come up with a name and a unique identifier - you will need it if you later want to share your virtual device with the community.
You will be prompted to create a "Manifest" in which the device fields are defined.
You will see the manifest creation window open in the first tab: Device Fields. As we are doing an example for a GPS tracker, create two fields for latitude and longitude. I called them lat (latitude) and long (longitude).
You can ask:
Click Next. There is no need to set “Actions” (Device Actions) in this example, so immediately after that proceed to the activation of the manifest.
Now you can create a new type of device by returning to https://my.artik.cloud . Click + Add Another Device ...
Let's try an interesting function - data simulation. It is useful for testing.
At the rectangle that indicates the device, click "...", and then - Simulate Device Data.
A window will appear in which you can set the simulation parameters for each field. For example, the interval of issuing values, boundaries, distribution (in our case, random is chosen).

After that, you can click on the Start Simulation button.
Data began to appear. You can see them on the chart. To do this, open the Charts tab in the top menu.

You will see in real time the values of longitude and latitude in the range you specified:
This schedule is quite easy to use. It can be scaled, back off the story, change the type of chart. As you can see in the screenshot, you can make more bar and scatter diagrams:

If you want to see the metadata, it is convenient to use the Data Logs tab. Here you will see the generation date, the acquisition date and the internal presentation of the data - this is a familiar JSON format.

Let's try to pull out our simulated data from the Cloud. We will use the REST API - this is logical, because we will write the code to get the data in JavaScript.
Click on the device name in the menu.
In the window that opens, you will see various device keys, of which two are important: Device ID and Device Token. When accessed from outside, these keys work as a login and password. Very soon you will need them.
How to find out which request to send? For this there is a very handy developer tool - API-console . It allows you to view and study examples of various API queries. Look at the GET (Get Last Normalized Messages) request:
To fulfill such a request, it is necessary to specify which device we are accessing ( sdids - here we need to substitute the device identifier obtained in the previous step), the fields of interest ( fieldPresense ), and how many values we want to get ( count ).
Fill in the fields and click the Try it! You will receive information sufficient to complete the request:
Here is a sample JavaScript code that will receive a message from the cloud and display it on the screen.
Of course, the varcall string and the Bearer authorization parameter need to be replaced with your own ones, obtained at the last step.
The result of this code in the Mozilla browser:

This is a JSON string, in which, among other things, there are lat and long search coordinates. It remains only to parse the string using the JSON parser, and the data is yours!
Based on this example, you can easily apply labels to a geographic map using the Yandex Maps API.
So what have we implemented? A simple example: creating a device in the cloud, simulating its data and retrieving this data to your computer.
Behind the brackets are:
For those who are interested to continue, these questions can be studied independently, using the official documentation .
 Author: Volkova Tatiana
Samsung Research Center employee
Manager and author of the curriculum of the project IoT Samsung Academy
Today we will talk about what Samsung offers, and, above all, about the Samsung Artik Cloud.
Content:
')
- Features Samsung Artik Cloud as the platform of the Internet of Things.
- We master the work with Artik Cloud in practice:
- Creating a new type of device
- Data simulation
- Retrieving data from the cloud using the REST API.
Features of Samsung Artik Cloud as an Internet of Things Platform
The IoT platform, as a rule, is understood as a ready-made integrated solution of several components that helps speed up the process of bringing the IoT product to the market.
What components should such a platform ideally have? According to the author of the article “5 Things To Know About The IoT Platform Ecosystem” from IoT Analytics, the platform should consist of 8 functional components:
Tab. one.
At the moment, not all Internet of Things platforms have the listed components. As a rule, focus is on some of them: for example, Amazon AWS doesn’t have an ordinary database in which a permanent virtual “Shadow” of the device is created, IBM Bluemix has the ability to use the Watson analytics service, and in PTC ThingWorx you can easily create a graphical interface applications.
In 2016, Samsung released the Artik family, which currently includes:
- Software platform - Artik Cloud - this material is dedicated to it,

- Hardware platform - Artik microcomputers.

An interesting point: Samsung releases under a single name both a software platform and a hardware solution, moreover at different levels: from the smallest and computationally weak Artik 0 to powerful and productive Artik 7.
Another interesting point: recently, in 2017, Samsung announced the merging of several technologies under the common name SmartThings Cloud: Samsung Connect (specialized routers of the Smart Home), SmartThings (home automation solutions) and the Artik family. In this case, all existing functionality will be preserved.
The official website of the product is on the link .
If we consider the Samsung Artik Cloud from the point of view of the list of functional components (see Table 1), we get the following:
Table 2
Of the key components, there is currently no analytics and machine learning component. But this year, Samsung announced the opening of an additional 4 new research centers of artificial intelligence around the world. So there is every reason to believe that work in this area is included in the company's strategic plans.
Benefits
Democratic pricing policy
It's simple. Up to 100,000 messages per month can be sent for free. Unlike other similar services, you do not need to bind a bank card before use. They will not demand it from you at all. You will have to pay only if you decide to use Artik Cloud in a real task, where the number of messages per day and per month is critical - in this case, the cost of 1 million messages will be $ 15.
That is why Artik Cloud is great for teaching students: if you use it only in class, the chances of exhausting the quota are very small.
Several different APIs
At the moment, you can interact with Artik Cloud in four ways at once:
- REST API
- WebSockets
- MQTT
- CoAP
Noteworthy is the support of two protocols at once, which are widely used precisely on the Internet of things: MQTT and CoAP.
Restrictions
Beta stage
Artik Cloud is still a young product (it appeared in 2016). Some features are still in Beta. For example, in the device simulator you cannot work with more than one device.
Incomplete documentation
Documentation is evolving. For example, now the REST API is very well documented, and the MQTT API documentation needs some work.
We master the work with Artik Cloud in practice
And now we suggest you create a virtual device - a GPS tracker that will generate random data. Then we will access this data from the computer.
Account creation
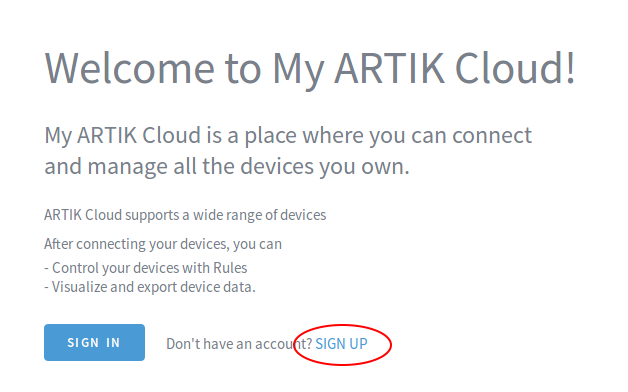
Go to the site https://my.artik.cloud/
There are several registration options. The easiest is to use an existing Google account. Spam will not be sent! Tested on personal experience.
Creating a new type of device
You will be taken to the user page https://artik.cloud/ .
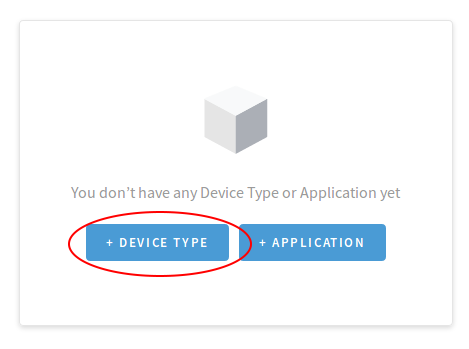
Here you can add devices to your system, watch logs, set interaction rules. Now, almost nothing can be done on it, because the devices and sensors we need are not among the options offered. Immediately go to the developer page: https://developer.artik.cloud/
Create a new device type.
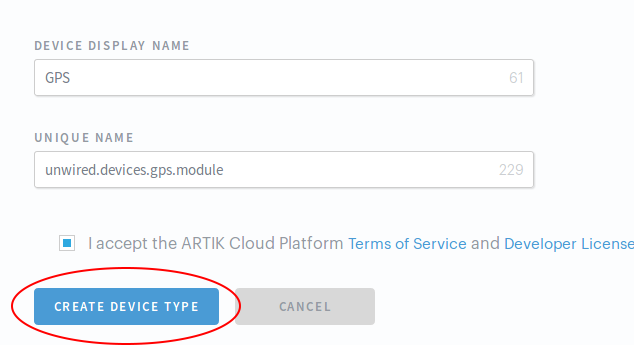
Next, you need to come up with a name and a unique identifier - you will need it if you later want to share your virtual device with the community.
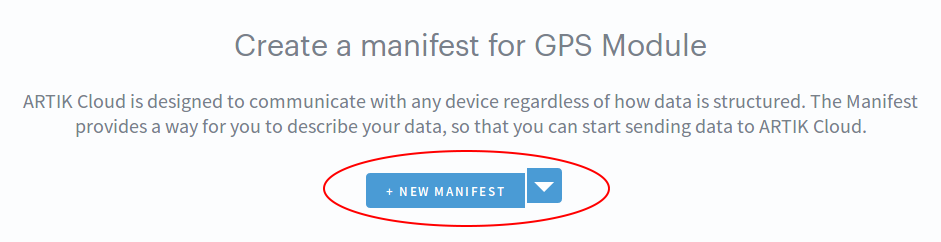
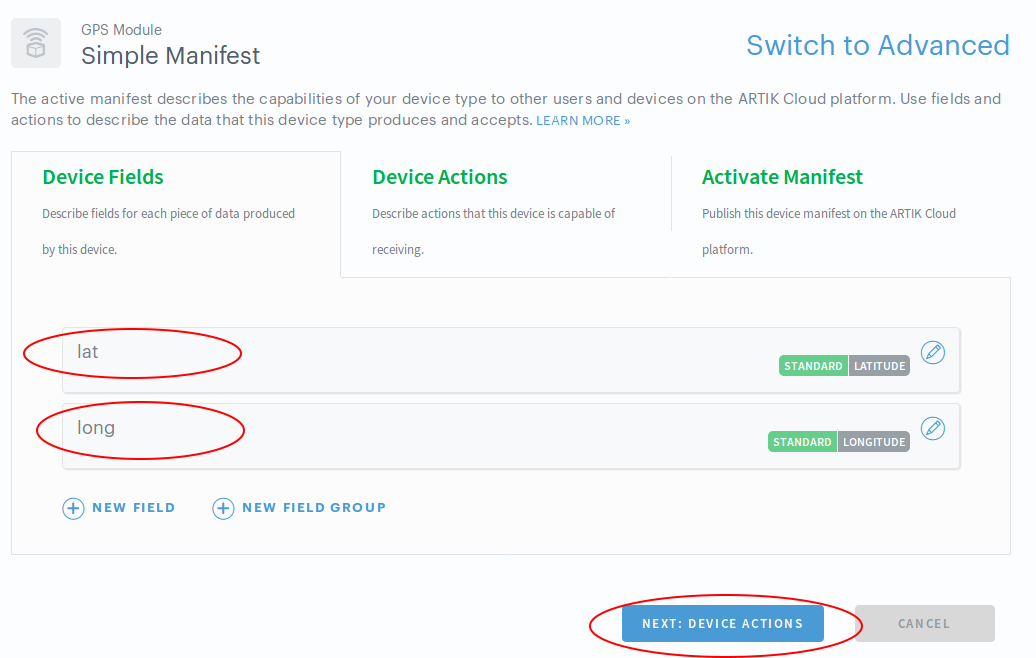
You will be prompted to create a "Manifest" in which the device fields are defined.
You will see the manifest creation window open in the first tab: Device Fields. As we are doing an example for a GPS tracker, create two fields for latitude and longitude. I called them lat (latitude) and long (longitude).
You can ask:
- Field names (in our case lat and long )
- Units of measurement (there are already standard units for this).
Click Next. There is no need to set “Actions” (Device Actions) in this example, so immediately after that proceed to the activation of the manifest.
Device creation
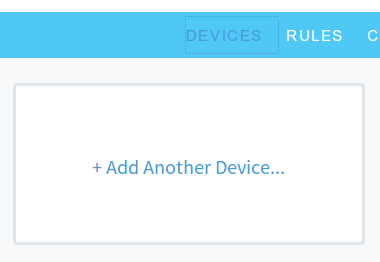
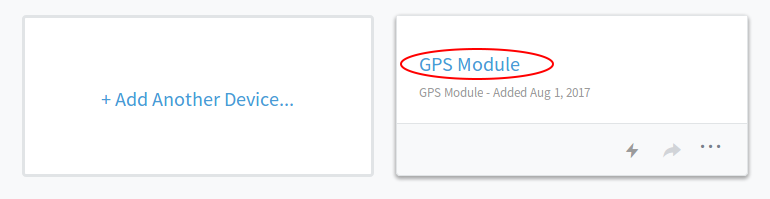
Now you can create a new type of device by returning to https://my.artik.cloud . Click + Add Another Device ...
Device simulation
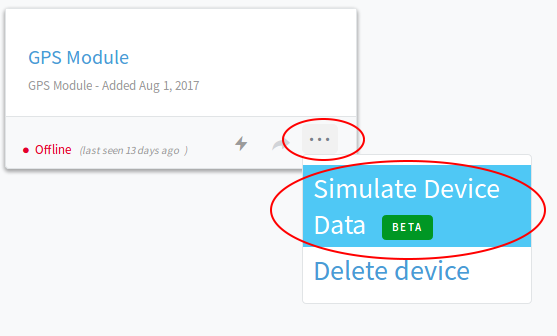
Let's try an interesting function - data simulation. It is useful for testing.
At the rectangle that indicates the device, click "...", and then - Simulate Device Data.
A window will appear in which you can set the simulation parameters for each field. For example, the interval of issuing values, boundaries, distribution (in our case, random is chosen).
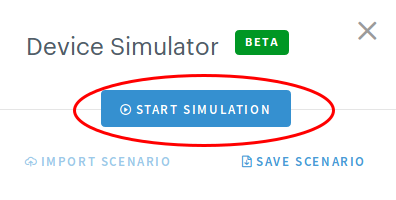
After that, you can click on the Start Simulation button.
Data began to appear. You can see them on the chart. To do this, open the Charts tab in the top menu.
You will see in real time the values of longitude and latitude in the range you specified:
This schedule is quite easy to use. It can be scaled, back off the story, change the type of chart. As you can see in the screenshot, you can make more bar and scatter diagrams:
If you want to see the metadata, it is convenient to use the Data Logs tab. Here you will see the generation date, the acquisition date and the internal presentation of the data - this is a familiar JSON format.
Getting data from the cloud
Let's try to pull out our simulated data from the Cloud. We will use the REST API - this is logical, because we will write the code to get the data in JavaScript.
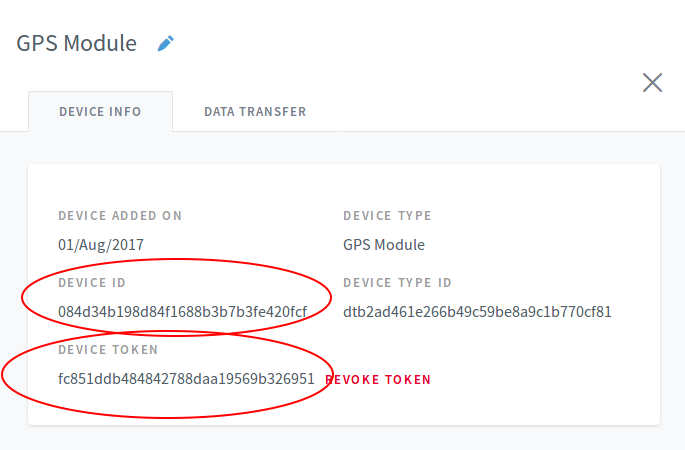
Click on the device name in the menu.
In the window that opens, you will see various device keys, of which two are important: Device ID and Device Token. When accessed from outside, these keys work as a login and password. Very soon you will need them.
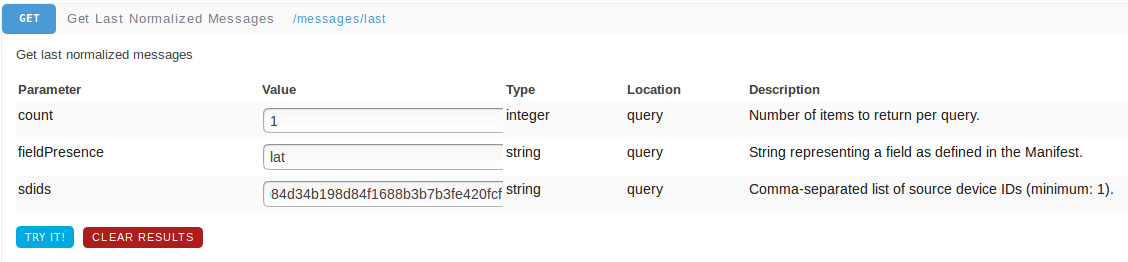
How to find out which request to send? For this there is a very handy developer tool - API-console . It allows you to view and study examples of various API queries. Look at the GET (Get Last Normalized Messages) request:
To fulfill such a request, it is necessary to specify which device we are accessing ( sdids - here we need to substitute the device identifier obtained in the previous step), the fields of interest ( fieldPresense ), and how many values we want to get ( count ).
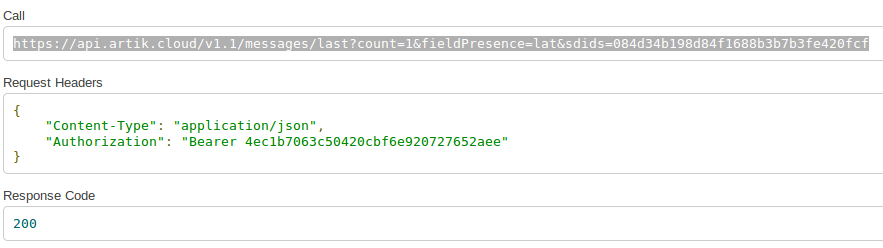
Fill in the fields and click the Try it! You will receive information sufficient to complete the request:
- Call is the address to which the request will be sent,
- Request Headers - headers to be sent with the request,
- 200 - response code.
Javascript code
Here is a sample JavaScript code that will receive a message from the cloud and display it on the screen.
varxmlhttp=newXMLHttpRequest(); varcall = "https://api.artik.cloud/v1.1/messages/last?count=1&fieldPresence=lat&sdids=084d34b198d84f1688b3b7b3fe420fcf"; xmlhttp.open('GET',call,true); xmlhttp.setRequestHeader("Content-Type","application/json"); xmlhttp.setRequestHeader("Authorization","Bearer fc851ddb484842788daa19569b326951"); xmlhttp.onreadystatechange=function(){ if(xmlhttp.status==200){ alert(xmlhttp.responseText); } }; Of course, the varcall string and the Bearer authorization parameter need to be replaced with your own ones, obtained at the last step.
The result of this code in the Mozilla browser:
This is a JSON string, in which, among other things, there are lat and long search coordinates. It remains only to parse the string using the JSON parser, and the data is yours!
Based on this example, you can easily apply labels to a geographic map using the Yandex Maps API.
Conclusion
So what have we implemented? A simple example: creating a device in the cloud, simulating its data and retrieving this data to your computer.
Behind the brackets are:
- Sending data to the cloud via REST API,
- Interaction with the cloud through other interfaces, such as MQTT,
- Actions (Device Actions),
- Rules (Rules Engine).
For those who are interested to continue, these questions can be studied independently, using the official documentation .
Author: Volkova Tatiana Samsung Research Center employee
Manager and author of the curriculum of the project IoT Samsung Academy
Source: https://habr.com/ru/post/410843/
All Articles