Permian shale basin model

Many people think that everything depends on the decisions of the Washington Regional Committee, but this is of course nonsense, our destinies are in the calluses of the harsh
To answer the question of what will happen to the barrel and with us, it is necessary to build a model of the field, which will allow us to calculate the potential production volumes under certain conditions. As a basis, you can take the data Drilling Productivity Report (DPR), but there are a number of problems that impose significant restrictions on the possibility of forecasting.
To begin with, it is worth understanding that the seemingly smooth lines of such a key indicator as “Production from one drilling site for the first month” are indicated with no more than the answer of the first-graders about the meaning of life within the framework of the concept of transhumanism. If you have the habit of waking up at night, drinking kefir and regularly downloading DPR reports, then you can see that the difference between the initial estimate and the refinement can reach 34% in a year and still significantly change even after that:
')
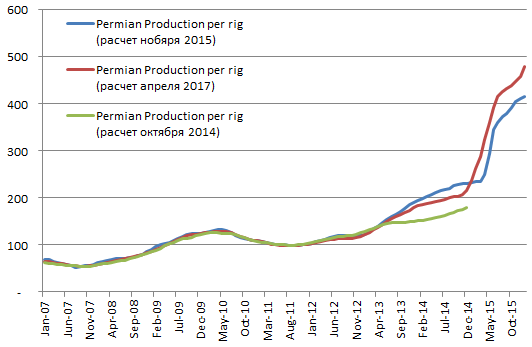
Therefore, you need to understand that the latest data is very approximate and can be revised very radically.
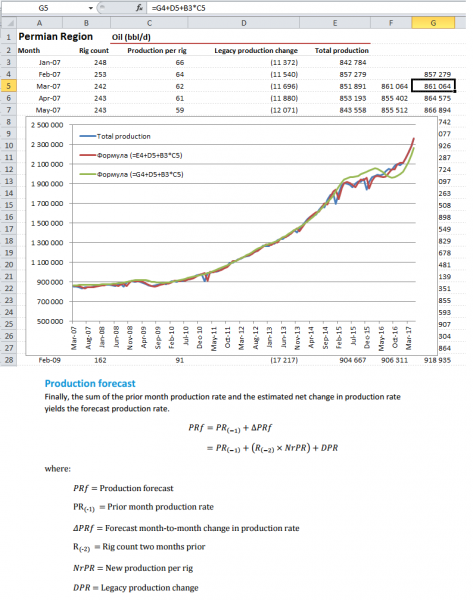
Further, the methodology states that the calculation of DPR production is carried out according to the formula:
Production for the previous month + Products from one drill for the first month * Number of drilling two months ago - Drop in production wells over 1 month = Projected production
The problem here is that it is not true. The discrepancies between the " Projected production " and the calculation using the stated formula are particularly visible when calculating with the cumulative total (green line):
Accordingly, in order to work with this crafts, we had to build a model that takes into account the monthly dynamics of the flow rate of wells open since 2007. The main difficulty is that vertical wells have one flow rate drop rate, and horizontal wells another one. And the ratio of these types all the time changed:
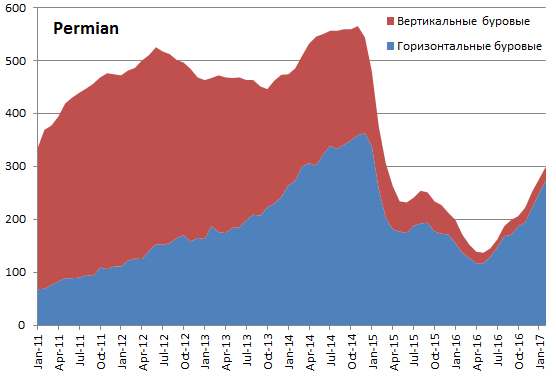
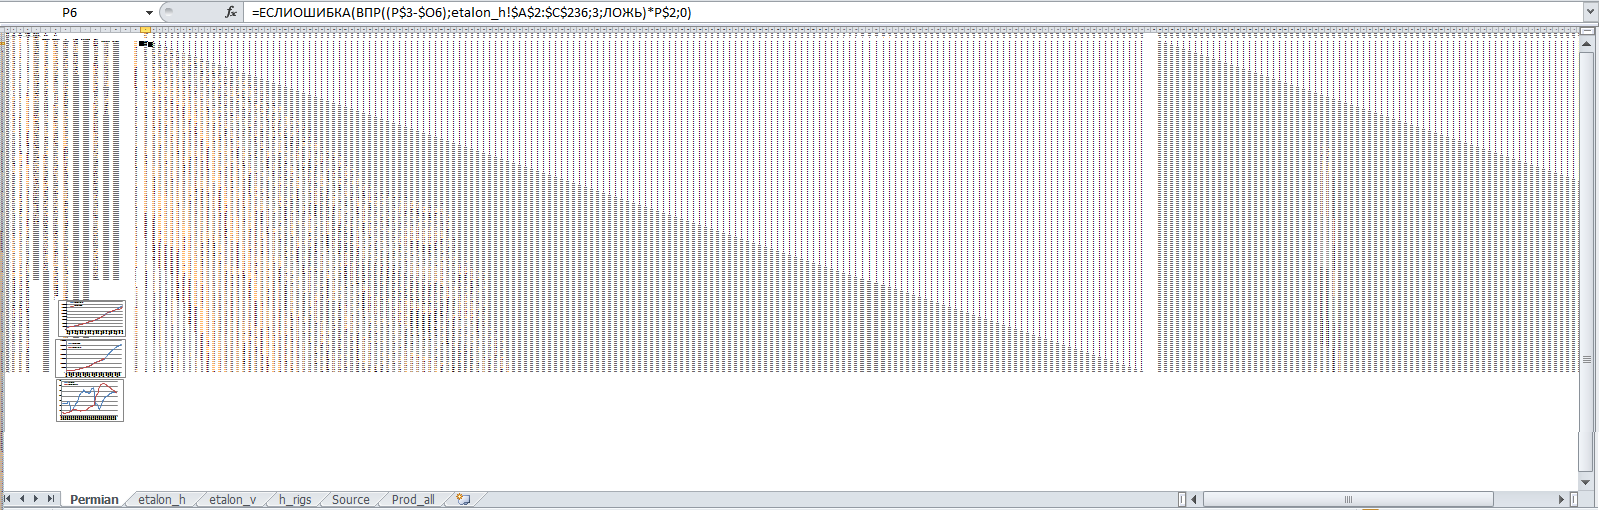
Those. It is impossible to derive the "average well" and do calculations on it. Accordingly, I consider separately vertical wells and separately horizontal ones. In general, this is what it looks like in Excel if you reduce the cell scale to 10%:
Since the DPR report includes all Texas produced oil and this is not only shale, but also classical production, and since the reduction in production from conventional wells is very different from shale, they should be excluded from the calculation. Accordingly, it turned out this model:
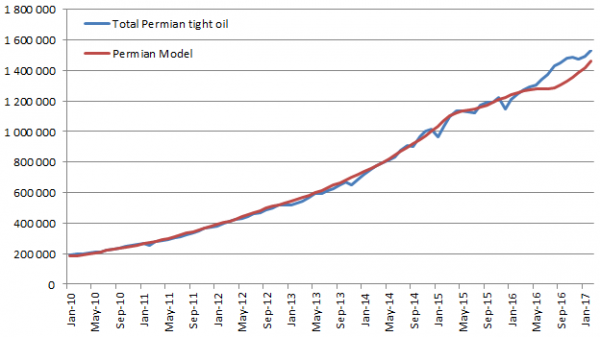
This ugly divergence in recent months is striking. This may be for several reasons, and in my opinion, the most likely version is a massive re-fracturing for some of the wells that were held from June to September. The reason could be a price increase of up to $ 50, which could be temporarily used to increase production in this way. Since the model takes into account repeated fracturing smoothly spaced in time over the entire period of operation, such a local conjuncture surge cannot be predicted. And maybe the data is crooked and in a couple of years everything will be redrawn.
Now, to the forecasts, but first let's talk about the difference from the Bakken model , which very successfully predicted the dynamics of production, due to the fact that it was possible to calculate the density of wells in each layer at each site. This made it possible for Bakken to calculate at what price of a barrel, how many wells would be profitable to plug in yet, but in the case of Permian there is no such complete information. And although previously it was possible to pump out the coordinates of all the wells in Texas, but their productivity is known only with great accuracy, so that you do not clear up
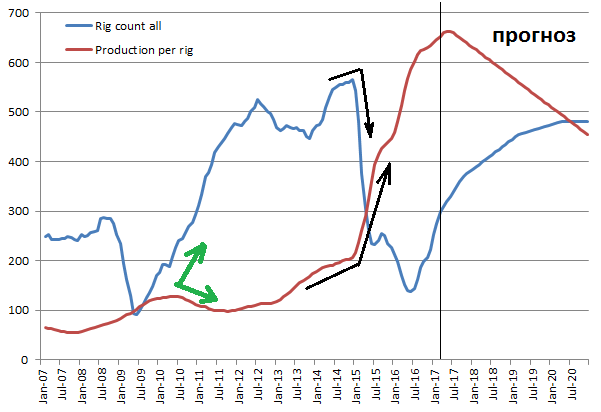
However, something is clear and true. For example, it is known that, at a price of $ 30-40, the number of active drilling rigs dropped and at the same time their efficiency dramatically increased, expressed in the volume of new products per drilling rig. This can be explained by the fact that only the richest areas were drilled, as a result of which the flow rate of the average well increased sharply (black arrows). Accordingly, with rising prices, we can expect a moderate decrease in efficiency, just as it was in 2010-2011 (green arrows):
In general, the trend of efficiency growth is exhausted clearly seen on this graph:
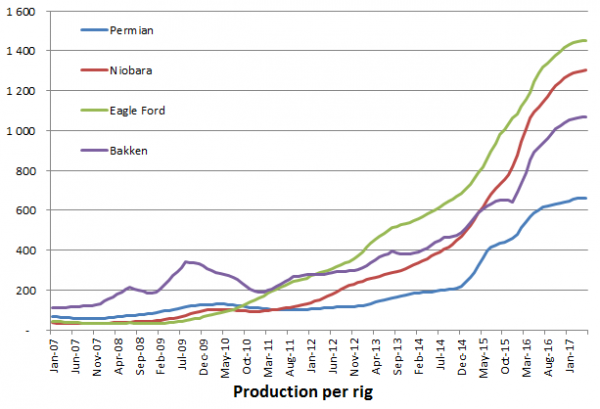
Those. in order to expand the geography of drilling one has to go to less and less sweet points. Well, plus the fat areas themselves do not multiply while they are sucked. At the same time, if the rise in prices is sufficiently large and sharp, then an increase in efficiency due to investments may reverse the downward trend, but for the time being I proceed from a moderate rise in prices to about $ 80 in 2020. Accordingly, with an increase in the number of drilling rigs to 480, it is possible to calculate the dynamics of Periman shale extraction, which is obtained as follows:
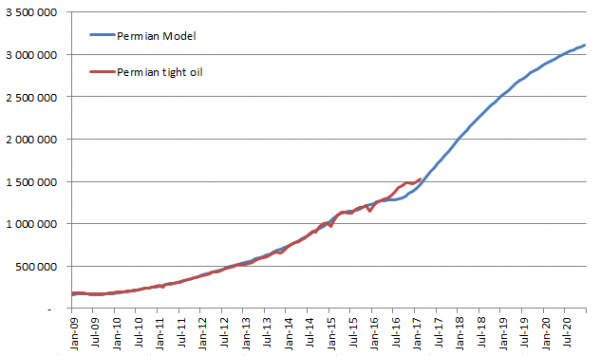
This is slightly more than the EIA predicts (they only get about ~ 2 mbd of Permian by 2020), but this is not so much more than to turn the world oil market upside down, since consumption growth by that time can grow by 5-6 mbd (depends on price dynamics mainly). Well, to ensure this growth, there will be a place for the same OPEC, and for shalers, its share of the pie will break off.
Source: https://habr.com/ru/post/403705/
All Articles