Adding SDM-220 counter to OpenHab
Almost a year has passed since my first publication on an electric meter with an RS485 / ModBus interface SDM-220 , then there was a second article on how to collect data from it and process statistics. This is the third, hopefully the last. It is about how to integrate the counter with OpenHab . The result finally suits me completely.
So, the first attempt to collect statistics from the counter was made using the external cloud service ThingSpeak . A thin client (mini-computer) with an Ubuntu Server installed on the USB flash drive was used as a local server that polls the meter. It was the first mistake - the flash drive "died" after 3 months (accident, I thought). Without making any conclusions, I killed the second flash drive in 2 months (pattern). In the third version, a usb-pocket with a 2.5 "screw was already used as storage.
The ThingSpeak service itself allows some processing, but does not allow sufficient flexibility with data manipulation. Data per day, for example, was collected as the sum of data for hours. If some data packet to the server did not arrive or I sent several data during testing, an error appeared. Thoughts about having to keep dvuhtarifny accounting with reference to the time of day, optimism did not add.
')
In general, I decided to learn OpenHab .
Installation of OpenHab itself is detailed in the instructions . After installation, through the Paper UI → Bindings panel you need to install ModBus binding - binding-modbus1 - 1.9.0
The Modbus bus is polled via the USB-RS485 adapter, so you need to make sure that the adapter is in the system and add the port access rights to the openhab user:
Then it is recommended to set permissions for Java (this is also described in detail in the OpenHab installation instructions):
After these manipulations, you need to configure the services / modbus.cfg configuration file:
Then you need to create the data items in the items / sdm220.items file :
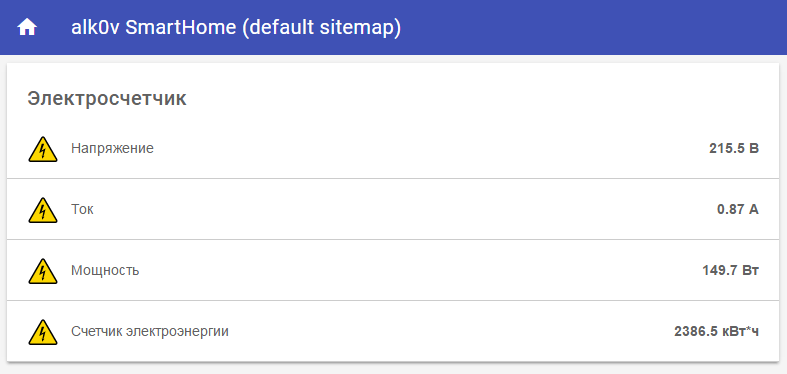
It remains to add the current readings on the dashboard. To do this, edit the sitemaps / default.sitemap file:
In principle, this is enough to see the current meter reading:
OpenHab supports multiple control panels. I apparently liked HabPanel the most . Via Paper UI → User Interfaces , we install HabPanel - ui-habpanel - 2.0.0 .
To draw graphs, you also need to store data somewhere. OpenHab uses the term Persistence for databases. I wanted to use the MySQL base, the community discussed a lot of problems with this base, in the end I found instructions that worked for me.
So, install MySQL Persistence (persistence-mysql - 1.9.0).
Install MySQL:
Configuring the database:
Restart openhab:
Rules services / mysql.cfg :
Rule persistence / mysql.persist . By default, the values of all Items will be entered into the database with each change:
If everything is set up correctly, the Items table and the ItemXX tables for each Item should appear in the database.
Now you can bring beauty to HabPanel.
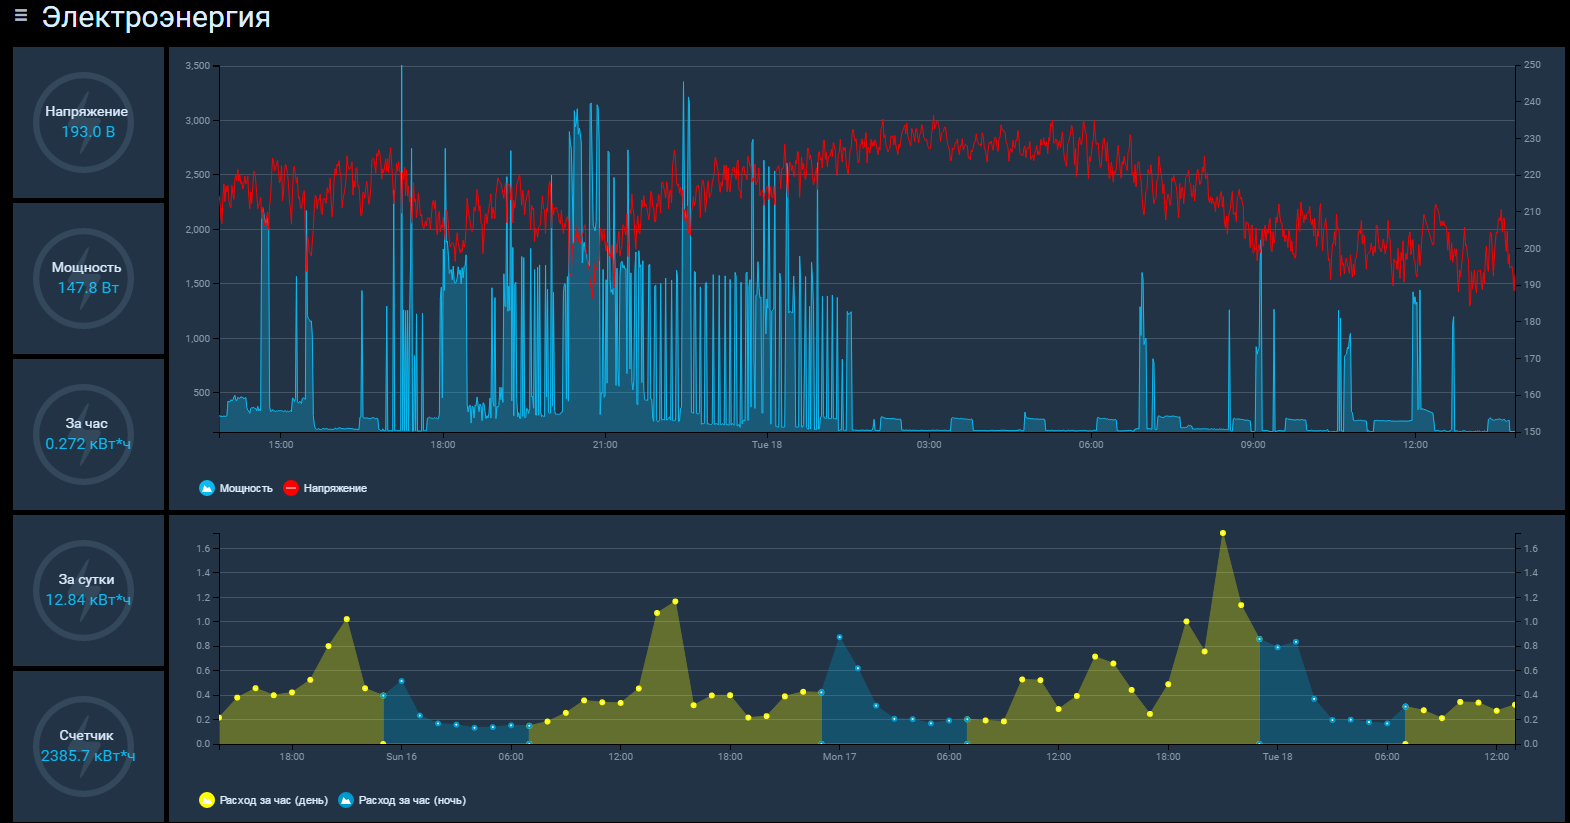
Add Dashboard, add new widgets to it. To display the values used by the widget Dummy , for displaying graphs - Chart . It's all intuitive. The parameters of power and voltage, I brought on one graph, using two different scales Y.
Specify the mysql data source as:

Adjust the thresholds for the voltage axis:
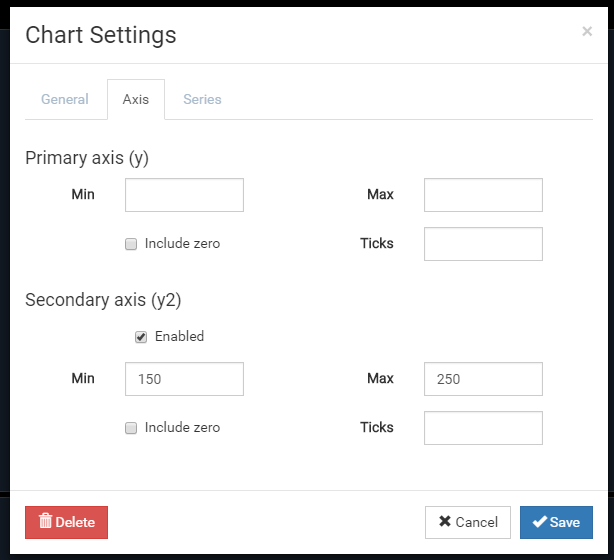
Add Items, specify color and line type for them, specify Secondary axis for voltage:

We get the result :)

Displaying the state change over time is good, but I also wanted to get statistics on consumption per hour, day, month. That is, the task is to periodically perform some calculations. This is where the rules mechanism in OpenHab comes to the rescue.
So, set up the Rules .
First you need to add new Items to items / sdm220.items :
Then we create the rules / energy.rules file , in which you need to specify 2 rules: one will be executed once an hour, the second - once a day.
For debugging, you can use the console OpenHab. Standard login and password: openhab / habopen. You can connect to it with the command:
Or you can view the log file:
I plan to change the main electric meter to a two-tariff one, according to which the electricity consumed in the range from 23:00 to 07:00 is paid with a factor of 0.5, so I would like to see the expected effect and keep two tariffs. At first, I simply added additional conditions for the time in Items and Rules and put the day and night readings in two different tables. Everything was beautiful in the database, but on the graph it looked clumsy, as the graph connected the last two values with a straight line:
To entertain my sense of beauty, I had to be a little confused.
So, the final script Rules for two-tariff accounting looks like this:
Before editing the script add the necessary Items:
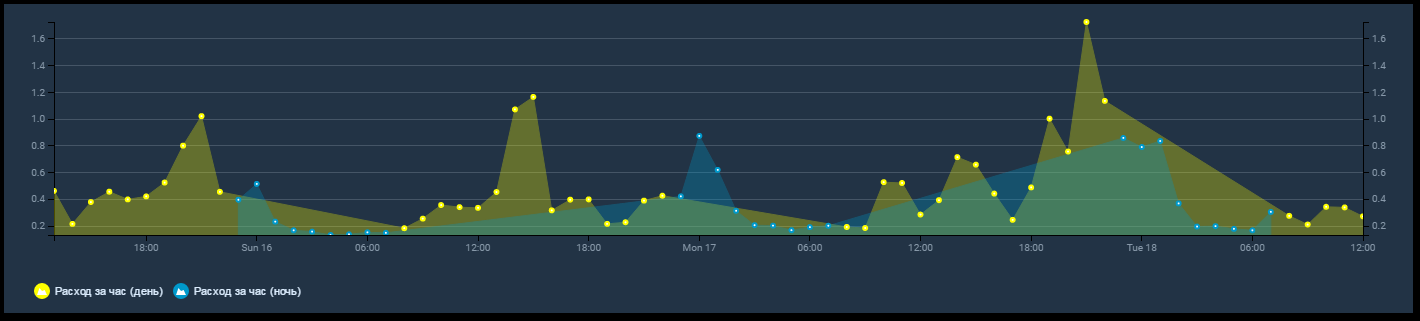
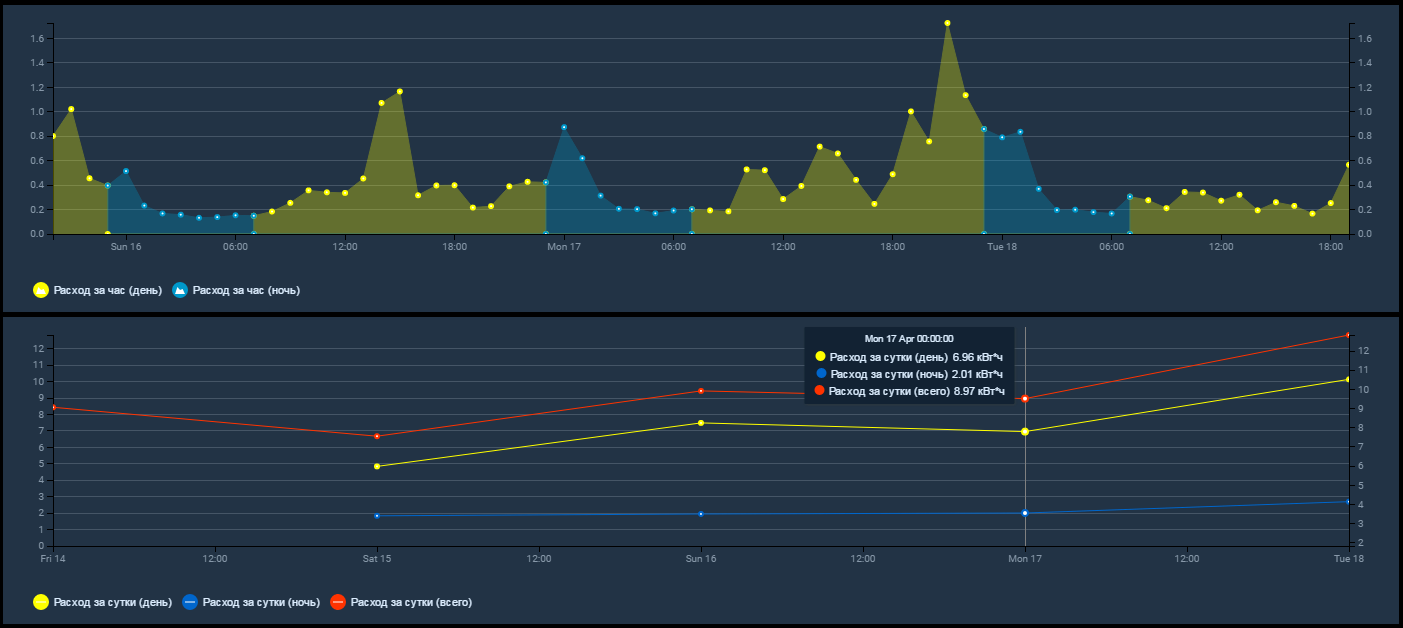
Now the schedule of hourly and daily consumption is as follows:
On this, perhaps, everything. The plans still add the calculation of the consumption of electricity and money for the month at the day and night rate and generate a report with sending by mail.
So, the first attempt to collect statistics from the counter was made using the external cloud service ThingSpeak . A thin client (mini-computer) with an Ubuntu Server installed on the USB flash drive was used as a local server that polls the meter. It was the first mistake - the flash drive "died" after 3 months (accident, I thought). Without making any conclusions, I killed the second flash drive in 2 months (pattern). In the third version, a usb-pocket with a 2.5 "screw was already used as storage.
The ThingSpeak service itself allows some processing, but does not allow sufficient flexibility with data manipulation. Data per day, for example, was collected as the sum of data for hours. If some data packet to the server did not arrive or I sent several data during testing, an error appeared. Thoughts about having to keep dvuhtarifny accounting with reference to the time of day, optimism did not add.
')
In general, I decided to learn OpenHab .
Task one: get raw data from the meter.
Installation of OpenHab itself is detailed in the instructions . After installation, through the Paper UI → Bindings panel you need to install ModBus binding - binding-modbus1 - 1.9.0
The Modbus bus is polled via the USB-RS485 adapter, so you need to make sure that the adapter is in the system and add the port access rights to the openhab user:
lsusb Bus 002 Device 002: ID 0403:6001 Future Technology Devices International, Ltd FT232 Serial (UART) IC ls /dev/ttyUSB* /dev/ttyUSB0 sudo adduser openhab dialout sudo adduser openhab tty Then it is recommended to set permissions for Java (this is also described in detail in the OpenHab installation instructions):
sudo vi /etc/default/openhab2 EXTRA_JAVA_OPTS="-Dgnu.io.rxtx.SerialPorts=/dev/ttyUSB0" After these manipulations, you need to configure the services / modbus.cfg configuration file:
sudo vi /etc/openhab2/services/modbus.cfg # poll=30000 # , . start - . connection (9600,8,n,1), . # - 0x00 serial.slave1.connection=/dev/ttyUSB0:9600:8:none:1:rtu:2000:1000:none:none serial.slave1.type=input serial.slave1.start=0 serial.slave1.length=2 serial.slave1.valuetype=float32 # - 0x06 serial.slave2.connection=/dev/ttyUSB0:9600:8:none:1:rtu:2000:1000:none:none serial.slave2.type=input serial.slave2.start=6 serial.slave2.length=2 serial.slave2.valuetype=float32 # - 0x0C serial.slave3.connection=/dev/ttyUSB0:9600:8:none:1:rtu:2000:1000:none:none serial.slave3.type=input serial.slave3.start=12 serial.slave3.length=2 serial.slave3.valuetype=float32 # ( ) - 0x156 serial.slave4.connection=/dev/ttyUSB0:9600:8:none:1:rtu:2000:1000:none:none serial.slave4.type=input serial.slave4.start=342 serial.slave4.length=2 serial.slave4.valuetype=float32 Then you need to create the data items in the items / sdm220.items file :
sudo vi /etc/openhab2/items/sdm220.items # Group gSDM220 # , , energy - Number sdm220_voltage " [%.1f ]" <energy> (gSDM220) {modbus="slave1:0"} Number sdm220_current " [%.2f ]" <energy> (gSDM220) {modbus="slave2:0"} Number sdm220_actpower " [%.1f ]" <energy> (gSDM220) {modbus="slave3:0"} Number sdm220_actcounter " [%.1f *]" <energy> (gSDM220) {modbus="slave4:0"} It remains to add the current readings on the dashboard. To do this, edit the sitemaps / default.sitemap file:
sudo vi /etc/openhab2/sitemaps/default.sitemap sitemap default label="alk0v SmartHome (default sitemap)" { Frame label="" { Text item=sdm220_voltage Text item=sdm220_current Text item=sdm220_actpower Text item=sdm220_actcounter } } In principle, this is enough to see the current meter reading:
Task two: HabPanel setup and visualization of readings
OpenHab supports multiple control panels. I apparently liked HabPanel the most . Via Paper UI → User Interfaces , we install HabPanel - ui-habpanel - 2.0.0 .
To draw graphs, you also need to store data somewhere. OpenHab uses the term Persistence for databases. I wanted to use the MySQL base, the community discussed a lot of problems with this base, in the end I found instructions that worked for me.
So, install MySQL Persistence (persistence-mysql - 1.9.0).
Install MySQL:
sudo apt-get install mysql-server sudo mysql -u root -p Configuring the database:
CREATE DATABASE OpenHAB; CREATE USER 'openhab'@'localhost' IDENTIFIED BY 'YOURPASSWORD'; GRANT ALL PRIVILEGES ON OpenHAB.* TO 'openhab'@'localhost'; quit Restart openhab:
sudo service openhab2 stop sudo service openhab2 start Rules services / mysql.cfg :
# the database url like 'jdbc:mysql://<host>:<port>/<database>' (without quotes) url=jdbc:mysql://localhost:3306/openhab # the database user user=openhab # the database password password=YOURPASSWORD Rule persistence / mysql.persist . By default, the values of all Items will be entered into the database with each change:
Strategies { // if no strategy is specified for an item entry below, the default list will be used everyMinute : "0 * * * * ?" every5Minutes : "0 */5 * * * ?" everyHour : "0 0 * * * ?" everyDay : "0 0 0 * * ?" default = everyChange } Items { // persist all items once a day and on every change and restore them from the db at startup * : strategy = default, restoreOnStartup } If everything is set up correctly, the Items table and the ItemXX tables for each Item should appear in the database.
mysql> use openhab; Database changed mysql> show tables; +-------------------+ | Tables_in_openhab | +-------------------+ | Item1 | | Item2 | | Item3 | | Item4 | | Items | +-------------------+ 5 rows in set (0.00 sec) mysql> select * from Items; +--------+--------------------------+ | ItemId | ItemName | +--------+--------------------------+ | 1 | sdm220_voltage | | 2 | sdm220_actpower | | 3 | sdm220_actcounter | | 4 | sdm220_current | +--------+--------------------------+ 4 rows in set (0.00 sec) Now you can bring beauty to HabPanel.
Add Dashboard, add new widgets to it. To display the values used by the widget Dummy , for displaying graphs - Chart . It's all intuitive. The parameters of power and voltage, I brought on one graph, using two different scales Y.
Specify the mysql data source as:
Adjust the thresholds for the voltage axis:
Add Items, specify color and line type for them, specify Secondary axis for voltage:
We get the result :)
The third task: hourly and daily metering of electricity consumed
Displaying the state change over time is good, but I also wanted to get statistics on consumption per hour, day, month. That is, the task is to periodically perform some calculations. This is where the rules mechanism in OpenHab comes to the rescue.
So, set up the Rules .
First you need to add new Items to items / sdm220.items :
Number sdm220_hourcounter (gSDM220) Number sdm220_daycounter (gSDM220) Then we create the rules / energy.rules file , in which you need to specify 2 rules: one will be executed once an hour, the second - once a day.
rule "Energy by hour" when Time cron "0 0 * * * ?" then // . var hour = sdm220_actcounter.state as DecimalType - sdm220_actcounter.historicState(now.minusHours(1), "mysql":).state as DecimalType // logInfo("TEST","sdm220_hourcounter = "+hour) // Item postUpdate(sdm220_hourcounter, hour) end rule "Energy by day" when Time cron "0 0 0 * * ?" then var day = sdm220_actcounter.state as DecimalType - sdm220_actcounter.historicState(now.minusDays(1), "mysql":).state as DecimalType postUpdate(sdm220_daycounter, day) For debugging, you can use the console OpenHab. Standard login and password: openhab / habopen. You can connect to it with the command:
ssh -p 8101 openhab@localhost openhab> log:tail 19:22:00.012 [INFO ] [.eclipse.smarthome.model.script.TEST] - sdm220_hourcounter_day = 0.526123046875 19:22:00.014 [INFO ] [.eclipse.smarthome.model.script.TEST] - sdm220_daycounter = 10.861083984375 19:22:09.462 [INFO ] [marthome.event.ItemStateChangedEvent] - sdm220_current changed from 16.0433025360107421875 to 5.69449329376220703125 19:22:11.500 [INFO ] [marthome.event.ItemStateChangedEvent] - sdm220_actcounter changed from 2387.51904296875 to 2387.5458984375 19:22:13.532 [INFO ] [marthome.event.ItemStateChangedEvent] - sdm220_voltage changed from 192.7679595947265625 to 200.4195098876953125 19:22:15.568 [INFO ] [marthome.event.ItemStateChangedEvent] - sdm220_actpower changed from 2271.8486328125 to 1132.8717041015625 19:23:00.014 [INFO ] [.eclipse.smarthome.model.script.TEST] - sdm220_hourcounter_day = 0.515869140625 19:23:00.015 [INFO ] [.eclipse.smarthome.model.script.TEST] - sdm220_daycounter = 10.8769531250 Or you can view the log file:
tail -f /var/log/openhab2/openhab.log 2017-04-18 19:17:45.587 [INFO ] [el.core.internal.ModelRepositoryImpl] - Refreshing model 'energy.rules' 2017-04-18 19:18:00.259 [INFO ] [.eclipse.smarthome.model.script.TEST] - sdm220_hourcounter_day = 0.571044921875 2017-04-18 19:18:00.272 [INFO ] [.eclipse.smarthome.model.script.TEST] - sdm220_daycounter = 10.8330078125 2017-04-18 19:19:00.015 [INFO ] [.eclipse.smarthome.model.script.TEST] - sdm220_daycounter = 10.83789062500 2017-04-18 19:19:00.025 [INFO ] [.eclipse.smarthome.model.script.TEST] - sdm220_hourcounter_day = 0.557861328125 2017-04-18 19:20:00.013 [INFO ] [.eclipse.smarthome.model.script.TEST] - sdm220_hourcounter_day = 0.55517578125 2017-04-18 19:20:00.024 [INFO ] [.eclipse.smarthome.model.script.TEST] - sdm220_daycounter = 10.859130859375 I plan to change the main electric meter to a two-tariff one, according to which the electricity consumed in the range from 23:00 to 07:00 is paid with a factor of 0.5, so I would like to see the expected effect and keep two tariffs. At first, I simply added additional conditions for the time in Items and Rules and put the day and night readings in two different tables. Everything was beautiful in the database, but on the graph it looked clumsy, as the graph connected the last two values with a straight line:
To entertain my sense of beauty, I had to be a little confused.
So, the final script Rules for two-tariff accounting looks like this:
rule "Energy by hour" when Time cron "0 0 * * * ?" then var hour = sdm220_actcounter.state as DecimalType - sdm220_actcounter.historicState(now.minusHours(1), "mysql":).state as DecimalType // if(now.getHourOfDay > 7 && now.getHourOfDay < 23) { logInfo("TEST","sdm220_hourcounter_day = "+hour) postUpdate(sdm220_hourcounter_day, hour) } else { // // primary key timestamp, if(now.getHourOfDay==7) { postUpdate(sdm220_hourcounter_night, hour) Thread::sleep(1000) postUpdate(sdm220_hourcounter_night, 0) Thread::sleep(1000) postUpdate(sdm220_hourcounter_day, 0) Thread::sleep(1000) postUpdate(sdm220_hourcounter_day, hour) } else if(now.getHourOfDay==23) { postUpdate(sdm220_hourcounter_day, hour) Thread::sleep(1000) postUpdate(sdm220_hourcounter_day,0) Thread::sleep(1000) postUpdate(sdm220_hourcounter_night, 0) Thread::sleep(1000) postUpdate(sdm220_hourcounter_night, hour) } else { postUpdate(sdm220_hourcounter_night, hour) } } postUpdate(sdm220_hourcounter, hour) end rule "Energy by day" when Time cron "0 0 0 * * ?" then var day = sdm220_actcounter.state as DecimalType - sdm220_actcounter.historicState(now.minusDays(1), "mysql":).state as DecimalType //night counter, 00:00..07:00 + 23:00..00:00 var day2 = sdm220_actcounter.historicState(now.minusHours(17),"mysql":).state as DecimalType - sdm220_actcounter.historicState(now.minusDays(1), "mysql":).state as DecimalType + sdm220_actcounter.state as DecimalType - sdm220_actcounter.historicState(now.minusHours(1),"mysql":).state as DecimalType //day counter, 07:00..23:00 var day1 = sdm220_actcounter.historicState(now.minusHours(1),"mysql":).state as DecimalType - sdm220_actcounter.historicState(now.minusHours(17),"mysql":).state as DecimalType logInfo("TEST","sdm220_daycounter_day = "+day1) logInfo("TEST","sdm220_daycounter_night = "+day2) logInfo("TEST","sdm220_daycounter = "+day) postUpdate(sdm220_daycounter, day) postUpdate(sdm220_daycounter_day, day1) postUpdate(sdm220_daycounter_night, day2) end Before editing the script add the necessary Items:
Number sdm220_hourcounter_day (gSDM220) Number sdm220_hourcounter_night (gSDM220) Number sdm220_daycounter_day (gSDM220) Number sdm220_daycounter_night (gSDM220) Now the schedule of hourly and daily consumption is as follows:
On this, perhaps, everything. The plans still add the calculation of the consumption of electricity and money for the month at the day and night rate and generate a report with sending by mail.
Source: https://habr.com/ru/post/403237/
All Articles