Logging in the ROS program
Good afternoon, dear readers! I continue to talk about various interesting and useful features of the Robot Operation System (ROS) robotic platform. In this small tutorial I will talk about the possibilities of logging using ROS tools when programming in C ++. I think many would agree that displaying messages when executing a program is of great importance when developing programs, especially when debugging. ROS provides a convenient API for outputting various types of messages to a terminal with the ability to visualize and filter messages in special ROS tools. Let's start!
So, we write a simple node, which we call logging_tutorial:
Add to CMakeLists.txt:
')
Now let's start writing the main.cpp code. We import a special header file console.h in the file header with the definition of logging functions:
Add a simple message to the main method:
Compile the package and run it:
The output will be:
At the beginning of the message is added a “level” or type and time stamp in seconds and nanoseconds from January 1, 1970. In this case, we have a message with an INFO level.
We can pass parameters to the message in the same way as the printf method:
You can create a message as a standard stream like std :: cout:
ROS supports the following "levels of detail" (in order of increasing relevance):
To display a message of a certain level, the corresponding function is used in the format: ROS _ \ <LEVEL \>. Messages of various types are displayed with a certain color with highlighting: DEBUG - green, INFO - white, WARN - yellow, ERROR - red, FATAL - purple. The purpose of each type of message is easy to guess by its name. For example, DEBUG messages are useful for debugging.
Add a few different messages and run everything in a loop. I got this file:
By default, the program displays messages of all types except DEBUG. This is determined by the minimum level, the so-called “severity level,” using the ROSCONSOLE_MIN_SEVERITY parameter. The ROSCONSOLE_MIN_SEVERITY parameter limits the output of messages in such a way that all messages with a level equal to or higher than the minimum are displayed. By default, the minimum level is set to DEBUG. You can change the minimum level by setting ROSCONSOLE_MIN_SEVERITY to the value of one of the message levels (ROSCONSOLE_SEVERITY_DEBUG, ROSCONSOLE_SEVERITY_INFO, etc.) or none of them (ROSCONSOLE_SEVERITY_NONE) using the macro at the beginning of the node file:
You can also set the level of importance for all nodes in the package in the CMakeLists.txt file:
This method has one limitation: only messages of a higher level than DEBUG will be displayed, even if we directly specify ROSCONSOLE_SEVERITY_DEBUG. You can solve this problem using a special configuration file. Create a config folder and inside it a custom_rosconsole.conf file with the following contents:
Then create the launch logging.launch file and specify the path to the custom_rosconsole.conf file in the ROSCONSOLE_CONFIG_FILE variable:
Here we added the parameter output = "screen", which allows displaying messages of levels starting from INFO.
Compile and run our launch:
We will get a similar conclusion:
ROS has the ability to assign names to messages. By default, messages get the host name. Users can give names to various messages through the ROS _ \ <LEVEL \> [_ STREAM] _NAMED function:
Names allow you to assign different minimum levels to each named message in the configuration file and modify them individually. The message name is indicated after the package name:
Conditional messages (conditional messages) executed under a certain condition can also be useful. To do this, use the ROS _ \ <LEVEL \> [_ STREAM] _COND [_NAMED] function:
Messages can be output at a specific frequency using the ROS _ \ <LEVEL \> [_ STREAM] _THROTTLE [_NAMED] function. The first parameter is the frequency in seconds:
Run the rqt_console utility:
And launch our node using launch:
The rqt_console window will look like this:

Here in the table for each message its level, the name of the node, the name of the file and the line of code where it is generated are displayed.
Double click on the message you can get detailed information about it:
You can filter messages by excluding all error messages. To do this, add a filter by clicking on the plus sign next to the Exclude messages table and selecting the "... containing" option:
Or exclude messages with Info level:

Also messages of a given level can be distinguished among all by using filters in the Highlight Messages section:
Thus, rqt_console allows you to flexibly customize the display of messages from various nodes and simplify the debugging of programs in ROS.
I hope this guide will be useful in the work and will simplify the solution of problems encountered during programming. I wish you all success in your work with ROS and see you soon!
Using the console.h library methods to display messages in the node
So, we write a simple node, which we call logging_tutorial:
catkin_create_pkg logging_tutorial roscpp std_msgs Add to CMakeLists.txt:
')
add_executable(logging_node src/main.cpp) target_link_libraries(logging_node ${catkin_LIBRARIES} ) Now let's start writing the main.cpp code. We import a special header file console.h in the file header with the definition of logging functions:
#include <ros/console.h> Add a simple message to the main method:
int main(int argc, char** argv) { ros::init(argc, argv, "logging_node"); ros::NodeHandle n; ROS_INFO("logging_node start"); return 0; } Compile the package and run it:
cd ~/catkin_ws catkin_make source devel/setup.bash rosrun logging_tutorial logging_node The output will be:
[ INFO] [1492194213.009783103]: logging_node start At the beginning of the message is added a “level” or type and time stamp in seconds and nanoseconds from January 1, 1970. In this case, we have a message with an INFO level.
We can pass parameters to the message in the same way as the printf method:
int val = 5; ROS_INFO("message with argument: %d", val); You can create a message as a standard stream like std :: cout:
ROS_INFO_STREAM("message with argument: " << val); ROS supports the following "levels of detail" (in order of increasing relevance):
- DEBUG
- INFO
- WARN
- ERROR
- Fatal
To display a message of a certain level, the corresponding function is used in the format: ROS _ \ <LEVEL \>. Messages of various types are displayed with a certain color with highlighting: DEBUG - green, INFO - white, WARN - yellow, ERROR - red, FATAL - purple. The purpose of each type of message is easy to guess by its name. For example, DEBUG messages are useful for debugging.
Add a few different messages and run everything in a loop. I got this file:
#include <ros/ros.h> #include <ros/console.h> int main(int argc, char** argv) { ros::init(argc, argv, "logging_node"); ros::NodeHandle n; ros::Rate rate (1); while(ros::ok()) { ROS_DEBUG("debug message"); ROS_INFO("logging_node start"); int val = 5; ROS_INFO("message with argument: %d", val); ROS_INFO_STREAM("stream message with argument: " << val); ROS_WARN("My warning"); ROS_ERROR("Some error"); ROS_FATAL("Fatal error"); ros::spinOnce(); rate.sleep(); } return 0; } By default, the program displays messages of all types except DEBUG. This is determined by the minimum level, the so-called “severity level,” using the ROSCONSOLE_MIN_SEVERITY parameter. The ROSCONSOLE_MIN_SEVERITY parameter limits the output of messages in such a way that all messages with a level equal to or higher than the minimum are displayed. By default, the minimum level is set to DEBUG. You can change the minimum level by setting ROSCONSOLE_MIN_SEVERITY to the value of one of the message levels (ROSCONSOLE_SEVERITY_DEBUG, ROSCONSOLE_SEVERITY_INFO, etc.) or none of them (ROSCONSOLE_SEVERITY_NONE) using the macro at the beginning of the node file:
#define ROSCONSOLE_MIN_SEVERITY ROSCONSOLE_SEVERITY_DEBUG You can also set the level of importance for all nodes in the package in the CMakeLists.txt file:
add_definitions(-DROSCONSOLE_MIN_SEVERITY=ROSCONSOLE_SEVERITY_ERROR) This method has one limitation: only messages of a higher level than DEBUG will be displayed, even if we directly specify ROSCONSOLE_SEVERITY_DEBUG. You can solve this problem using a special configuration file. Create a config folder and inside it a custom_rosconsole.conf file with the following contents:
log4j.logger.ros.logging_tutorial=DEBUG Then create the launch logging.launch file and specify the path to the custom_rosconsole.conf file in the ROSCONSOLE_CONFIG_FILE variable:
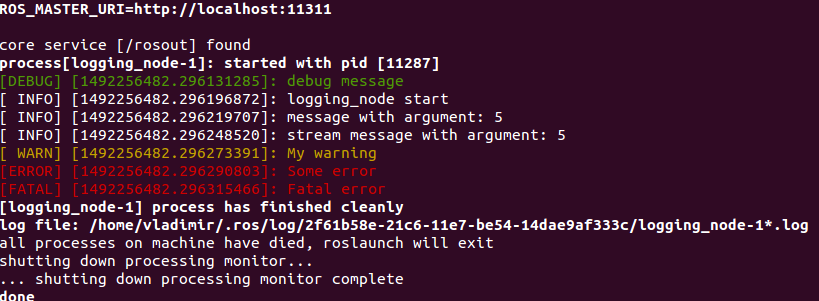
<launch> <env name="ROSCONSOLE_CONFIG_FILE" value="$(find logging_tutorial)/config/custom_rosconsole.conf"/> <node pkg="logging_tutorial" type="logging_node" name="logging_node" output="screen"/> </launch> Here we added the parameter output = "screen", which allows displaying messages of levels starting from INFO.
Compile and run our launch:
cd ~/catkin_ws catkin_make roslaunch logging_tutorial logging.launch We will get a similar conclusion:
ROS has the ability to assign names to messages. By default, messages get the host name. Users can give names to various messages through the ROS _ \ <LEVEL \> [_ STREAM] _NAMED function:
ROS_INFO_STREAM_NAMED("named_msg", "named info stream message with argument: " << val); Names allow you to assign different minimum levels to each named message in the configuration file and modify them individually. The message name is indicated after the package name:
log4j.logger.ros.logging_tutorial.named_msg = ERROR Conditional messages (conditional messages) executed under a certain condition can also be useful. To do this, use the ROS _ \ <LEVEL \> [_ STREAM] _COND [_NAMED] function:
ROS_INFO_STREAM_COND(val < 2, "conditional stream message shown when val (" << val << ") < 2"); Messages can be output at a specific frequency using the ROS _ \ <LEVEL \> [_ STREAM] _THROTTLE [_NAMED] function. The first parameter is the frequency in seconds:
ROS_INFO_THROTTLE(3, "throttled message with period 3 seconds"); Using rqt_console to display messages
Run the rqt_console utility:
rosrun rqt_console rqt_console And launch our node using launch:
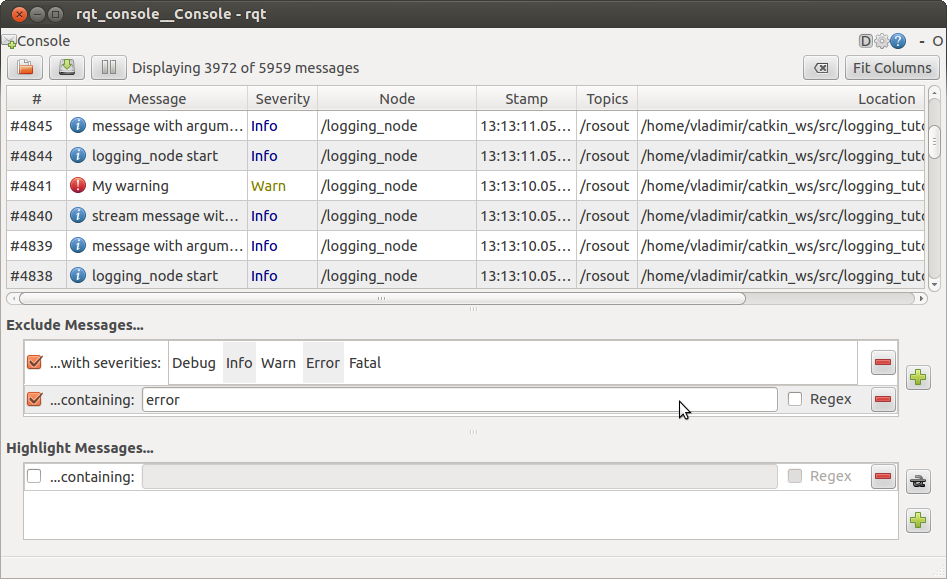
roslaunch logging_tutorial logging.launch The rqt_console window will look like this:
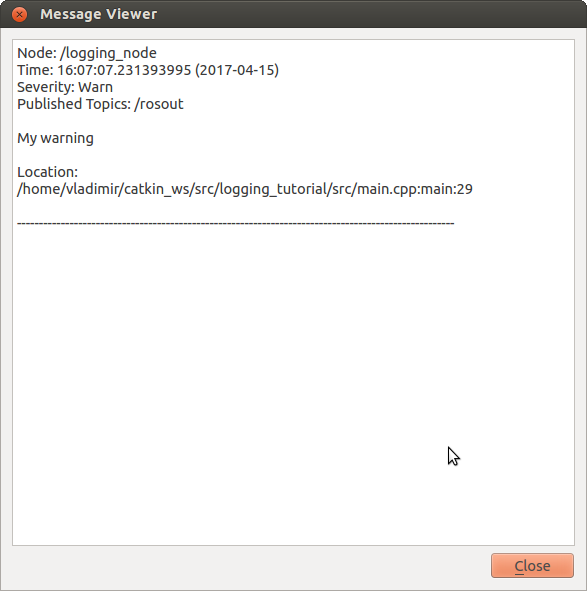
Here in the table for each message its level, the name of the node, the name of the file and the line of code where it is generated are displayed.
Double click on the message you can get detailed information about it:
You can filter messages by excluding all error messages. To do this, add a filter by clicking on the plus sign next to the Exclude messages table and selecting the "... containing" option:
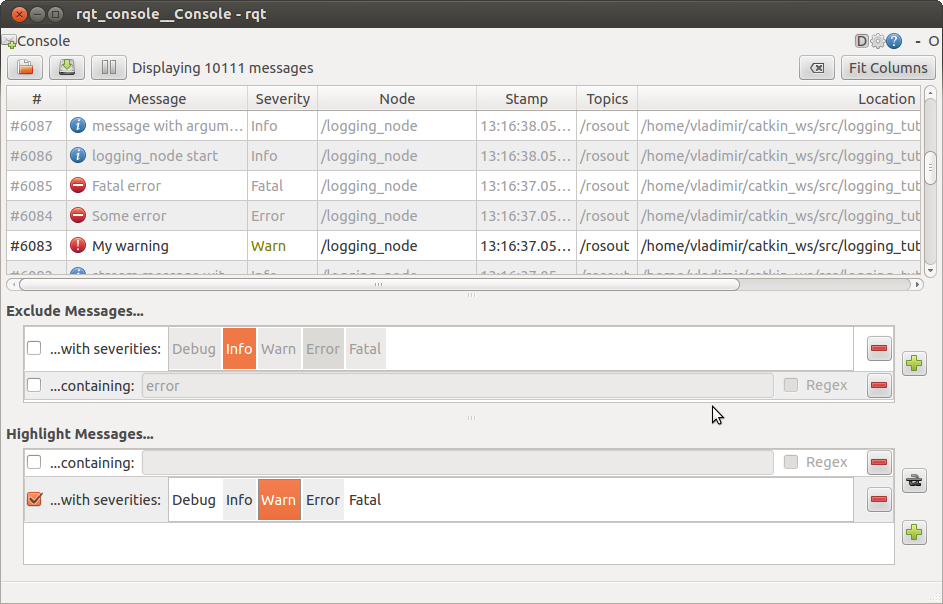
Or exclude messages with Info level:
Also messages of a given level can be distinguished among all by using filters in the Highlight Messages section:
Thus, rqt_console allows you to flexibly customize the display of messages from various nodes and simplify the debugging of programs in ROS.
I hope this guide will be useful in the work and will simplify the solution of problems encountered during programming. I wish you all success in your work with ROS and see you soon!
Source: https://habr.com/ru/post/403191/
All Articles