Citizenship by DNA, or whether Jews buy genetic tests
According to our experience, the analysis of the human population by DNA, raises three big questions to the public: can genes and ethnic groups be interconnected, how does origin analysis come from a technical point of view, and whether genetic tests are able to “identify Jews”. For some reason, the question of Jewish identity in DNA is of great concern both to those who have indisputable evidences of belonging to the B-chosen people, and those who don’t eat matzo and do not read Torah.
In the new material Genotek on Geektimes we will try to answer everything in order. And yes, the Jews also define.

Mankind has a bad habit of justifying violence by the “innate” superiority of one race over another - that’s why modern biologists approach the question of genetic differences between populations with the sapper’s caution. (Not) the existence of biological boundaries between racial and ethnic groups was fiercely discussed throughout the 20th century, but no final consensus on this issue has been reached so far ( 1 ).
')
There were hopes that the sequencing of the human genome would reconcile all. The genome, read “from” and “to”, will show that the boundaries between groups are of a social nature, and the genes are the same for all. It turned out differently: a careful study of the human nucleotide code revived and heightened interest in biological differences between racial and ethnic populations. Similar, in general, genes found slightly different allelic variants associated with the risk of disease ( 2 ), drug metabolism ( 3 ), the body’s response to environmental conditions ( 4 ), and these variants were encountered in different populations with different frequencies.
The search for non-existent "Indian" or "African" genes was stopped, but research in the field of medical and population genetics continues to draw parallels between the biological characteristics and the ethnicity of the participants. The use of the terms "race" and "ethnicity" in such works is actively discussed (and often condemned). There have been attempts to introduce rules that make researchers justify the need to use “slippery” categories and clarify what exactly is meant by specific terms. In February last year, in Science, one of the most authoritative natural science journals, an ambiguous article ( 5 ) was published, suggesting that we completely abandon the use of the term “race” in genetic research, replacing it with a more correct and neutral “ancestry” - “origin” .
But even in the face of uncertainty with terms, the division of humankind into population groups is still necessary: in particular, for the correct conduct of clinical trials of drugs and the assessment of the risk of diseases. For example, the three allelic variants of the NOD2 gene - R702W, G908R and 1007fs - are associated with an increased risk of Crohn's disease in European Americans ( 6 , 7 ), however, none of these variants is associated with Crohn's disease in Japanese ( 8 ). Known alleles of the CCR5 gene affecting the rate of development of immunodeficiency in HIV-infected patients ( 9 ): among them was found an option that slows the progression of the disease in European Americans, but accelerates its development in African Americans ( 10 ). In Asians, a correlation was found between the polymorphisms of the p53 protein gene, which regulates the stress response and suppresses the development of tumors, and the average winter temperatures in the populations' habitats - genetic adaptation to frost ( 11 ). And if in the past, only information provided by the participants themselves was used to divide the sample into ethnic groups, in the post-genomic era they are increasingly complemented and specified by genetic evaluation of the subject's origin.
In everyday life, we divide people into groups by appearance or language of communication. Most Danes resemble each other more than each of them - like an Italian ( here is a cool visualization with averaged portraits of different nationalities). Danes and Italians are much closer to each other than each of them to the inhabitants of sub-Saharan Africa: human phenotypes are clustered according to a geographical pattern. The distribution of genotypes has a similar structure: members of a local group, as a rule, have closer family ties than residents of remote areas, and populations inhabiting one region are closer than those whose habitats are separated by geographic barriers (for example, mountain ranges or water array).
At the same time, the genetic diversity of the human population is lower than in many species. This is explained by the fact that humanity is a kind of young: some groups had relatively little time to accumulate differences. Two randomly selected people differ from each other in each of ~ 1000 nucleotides, whereas two chimpanzees do not coincide every ~ 500 "letters". And yet, in total, there are about 3 million potential “points of divergence” in the human genome. Most of these discrepancies, called single nucleotide polymorphisms (SNPs), are neutral or almost neutral, but some of them are responsible for the phenotypic differences between people.
The distribution of neutral polymorphisms (since they do not have a biological meaning, are not subject to directed evolutionary selection, carried by the wind of migrations) in the world population reflects the demographic history of our species. Genetic and archaeological evidence indicates that the size of the human population has increased significantly over the past 100,000 years. People settled outside Africa, colonizing the rest of the world. The resettlement process influenced the geographical distribution of alleles in two ways: first, the “founder effect” had an effect - in the population of immigrants, as a rule, only part of the genetic variants from the entire pool of their diversity in the ancestral population was represented; secondly, the so-called “assortative crossing” took place, i.e. the pairs were formed mainly within their group, which limited the spread of existing and de novo emerging polymorphisms among individuals inhabiting different geographic areas. These processes led to a gradual accumulation of genetic differences.
In the context of population groups, genomic markers began to be studied in the 70s – 80s, in the 90s they were used to identify the population of a particular person. Researchers have again and again demonstrated that genetic polymorphisms make it possible to successfully isolate population groups and determine the group identity of an individual. At the same time, it was shown that people living on the same continent are, as a rule, closer to each other genetically than people from different continents. Initially, in such studies information about the place of birth, race, ethnic group was known from the very beginning and was used in conjunction with genetic data; if the subjects were distributed blindly to the clusters, solely on the basis of genetic traits, the correspondence between geographical origin, ethnicity and population structure was less pronounced. As further studies have shown, success depended on the genetic markers used and their number (more - better), the correct choice of reference populations and other factors ( 12 ).
By 2004, in the US, the genetic definition of population ownership was used not only in biomedical research, but also in investigating crimes: this article from Nature contains a fascinating story of how the police, desperate to find a criminal, ordered a DNA test in a commercial company, decided on skin color of the suspect and solved the case. Proposals for the analysis of genetic origin have successfully fallen into a wave of people's general interest in their own past. “Roots mania” was the name given to this hobby in an article in Time devoted to “America's latest obsession” - genealogical research.
Experts studying the origin and evolution of peoples actively use genomic methods. For example, in 2013, an international team of researchers used genetic analysis to refute the hypothesis of the origin of Ashkenazi Jews from the Khazars ( 13 ). The set of genomic data used by the authors is publicly available: it contains more than 100 world populations. We propose to model a small study with us: to determine the place of Genotek clients in this sample, and at the same time to understand the technical details of the definition of population affiliation.
Determine the place of Genotek clients among reference populations. Find out if there are representatives of Ashkenazi Jews in our sample. Demonstrate the principles and methods of analyzing the population of the individual person.
To process the genotyping data of 722 subjects using the ADMIXTURE program, using the data set from Behar et al., 2013 as a training sample.
The original work of Behar et al., 2013, used data from 1,774 people: among them were representatives of 88 non-Jewish populations (from Arabia, Central Asia, East Asia, Europe, the Middle East, North Africa, Siberia, South Asia, and sub- Saharan Africa) and 18 Jewish populations. The authors needed an extensive data set to accurately determine the location of Ashkenazi in the context of world populations: the task was to present all three geographical regions from which this group could hypothetically occur - Europe, Middle East and the Khazar Khaganate. The authors emphasized the difference between the approach to sampling, representing modern European, Middle Eastern and Jewish populations - direct descendants of ancestral populations, and samples corresponding to the Khazar kaganate, which ceased to exist about 1000 years ago. The hitch is that none of the currently existing populations is a direct heir of the Kaganate. Authors of the South Caucasus (Abkhazians, Armenians, Azeris, Georgians), North Caucasians (Adygs, Balkarians, Chechens, Kabardians, Ossetians and several other nationalities), Chuvash and Tatars, were chosen by the authors as possible contemporary representatives of the Khazars.
We added samples of 722 people from various regions of Russia to the data set.
For the statistical analysis, the ADMIXTURE program was used, which allows one to estimate the most probable origin of an individual on the basis of data on genotypes. In addition, the authors of the article under discussion used other statistical methods that gave a similar answer to the question posed. We will focus on ADMIXTURE, since it is this algorithm that allows us to estimate the percentage contribution of ancestral populations to the studied genomes.
ADMIXTURE uses Monte Carlo methods in Markov chains (Markov chain Monte Carlo, MCMC). Here is a link to the article of the authors of the algorithm for those who want to understand in more detail the mathematical side of the process.
We have a total of 2,496 specimens / individuals, each of which belongs to one of 106 modern populations. We assume that modern populations are likely to have evolved from a relatively small number of ancestral populations. “Ancestral populations” in such an analysis are some ancient genomic clusters united according to the principle of genetic similarity. ADMIXTURE allows both arbitrarily putting forward assumptions about the number of such clusters in a sample, as well as selecting the optimal number that most correctly describes the actual distribution of genomic data.
After receiving information about the genotypes and the estimated number of “ancestral” populations (K), ADMIXTURE builds a model that evaluates the contribution of each of the “ancestral” populations to each sample. When interpreting data, both the quantitative composition of the genome (the percentage ratio of clusters) and the qualitative one — their presence or absence in specific genomes — is important. Based on these data, it is possible to make assumptions about the evolutionary processes in a population, in particular, about the presence or absence of common “roots” among population groups. However, the conclusions will be legitimate if the model we have built is good: the optimal value of K is chosen.
How to determine how many “ancestral” populations most closely match the true for this sample? In an empirical way!
ADMIXTURE is a smart program: building a model of the genetic structure of populations based on data on individuals' genotypes (evaluating the contribution of each of the ancient genomic clusters to each of the genomes of the sample) for a given number K, it does not forget to compare it with reality at the end. Check how well the input data is described by the constructed model. The measure of comparison is “error” - a value that describes the discrepancy between the model and real data. The greater the error, the worse the assumption about the number of ancestral populations corresponds to reality.
How to choose the optimal value of K? We run the ADMIXTURE algorithm on this sample, substituting different values of K, and we obtain for each K its own error value. We build a graph of the dependence of the magnitude of the error on K. This is the graph that the authors of the article turned out to be:
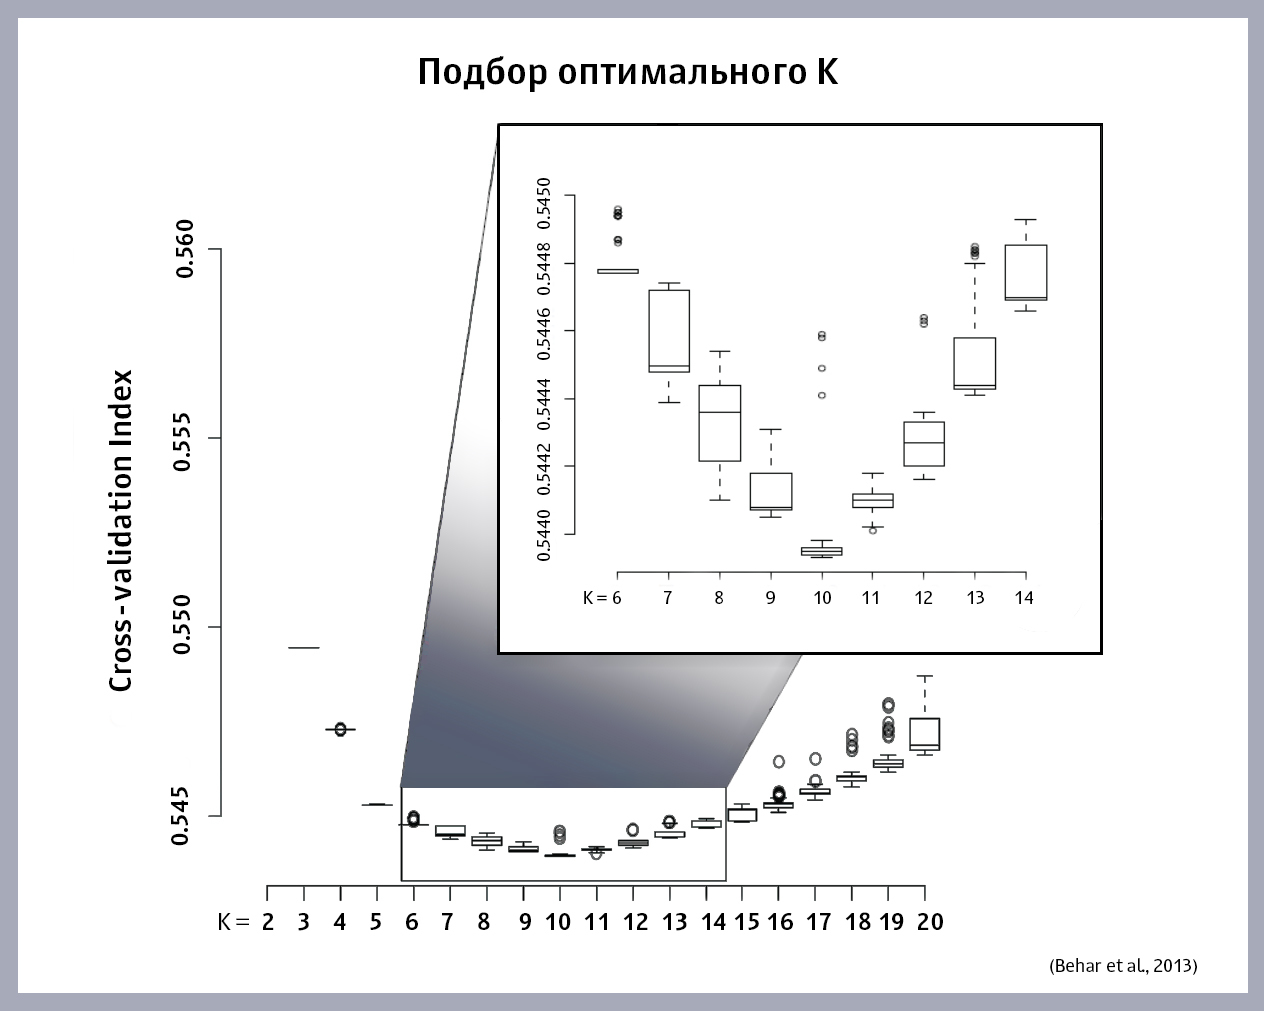
The optimal value of K is at the minimum point of the function. If the minimum on the graph is not detected (the function is constantly increasing or decreasing), you will have to build models, choosing new K, until you find the right one.
Even with optimally selected K, the reliability of the analysis results depends on the correctness of the sample:
1. Individuals should not be related to each other.
2. Single nucleotide polymorphisms (SNP), which are used for genotyping, should be evenly distributed across the genome with a sufficiently high density.
3. SNP alleles must be in equilibrium adhesion, that is, the probability of the presence of a given allele in a particular individual should depend only on the frequency of this allele in the population, but not on other alleles in the genome.
As can be seen from the graph, the optimal K for this sample was 10 “ancestral” populations.
The results of the analysis are presented by ADMIXTURE like this (only part of the data is visible in the figure):
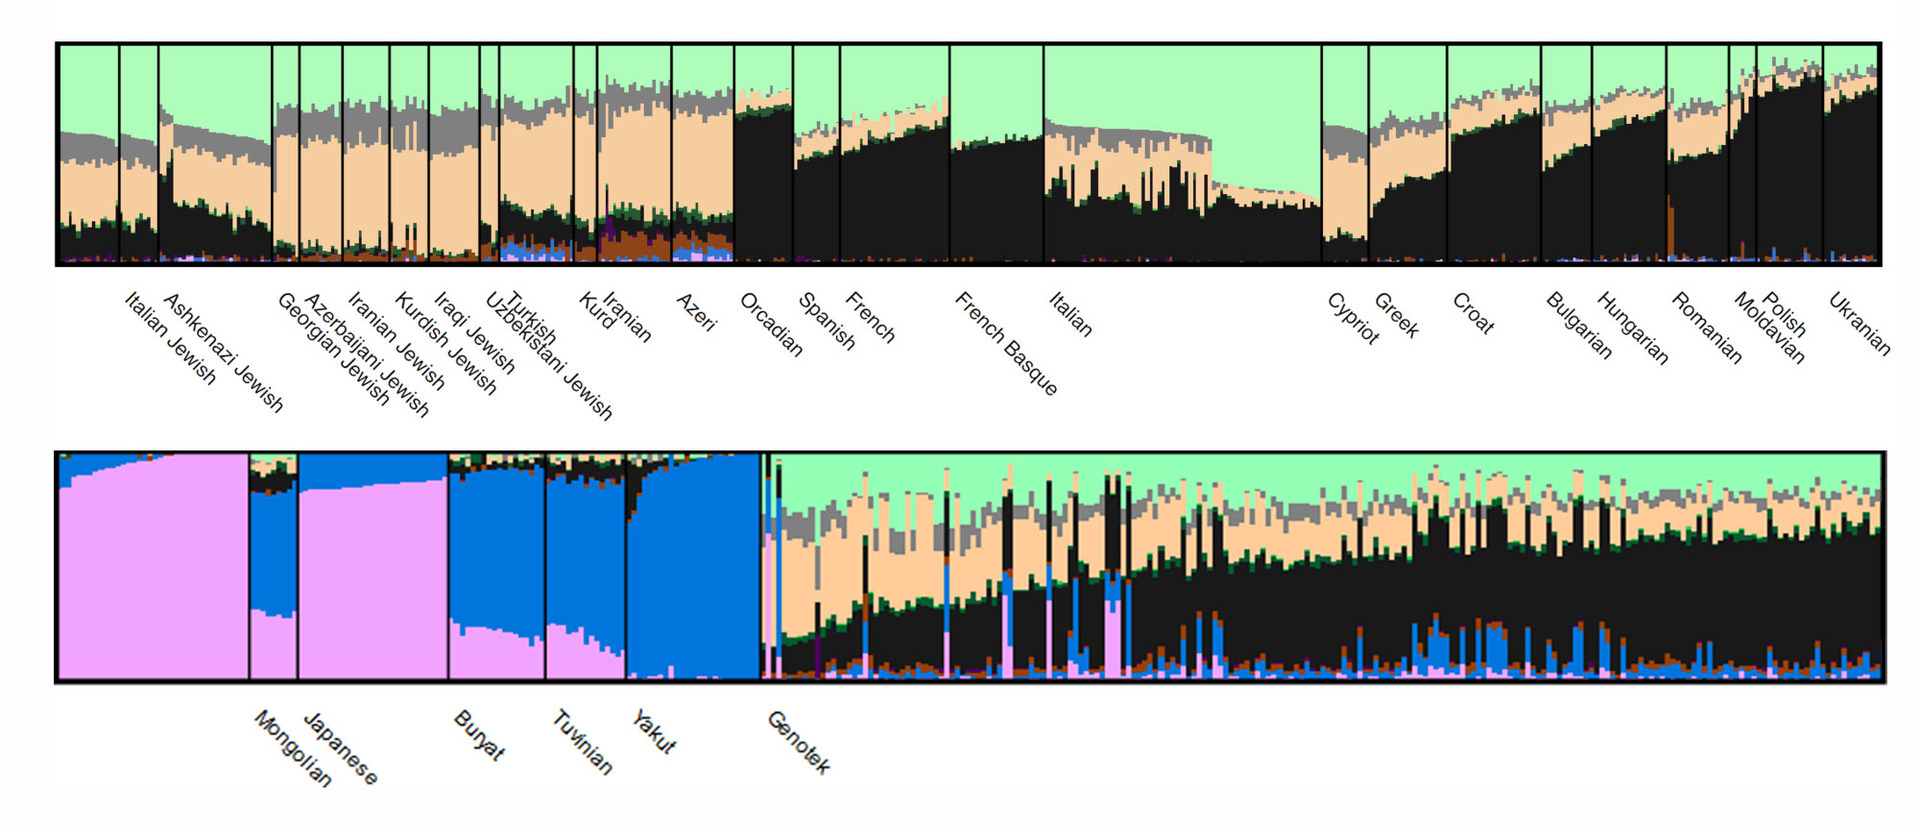
Each cluster has its own color, and populations differ (or do not differ) in the shares of clusters in the genome. Here is an interactive version of the picture for detailed study: move your mouse and scroll to see all populations or to consider some of the groups in more detail.
In general, within the “population” of Genotek, the ratio of clusters expectedly corresponds to a pattern characteristic of populations of Eastern European origin. Interesting starts at the level of individual samples:
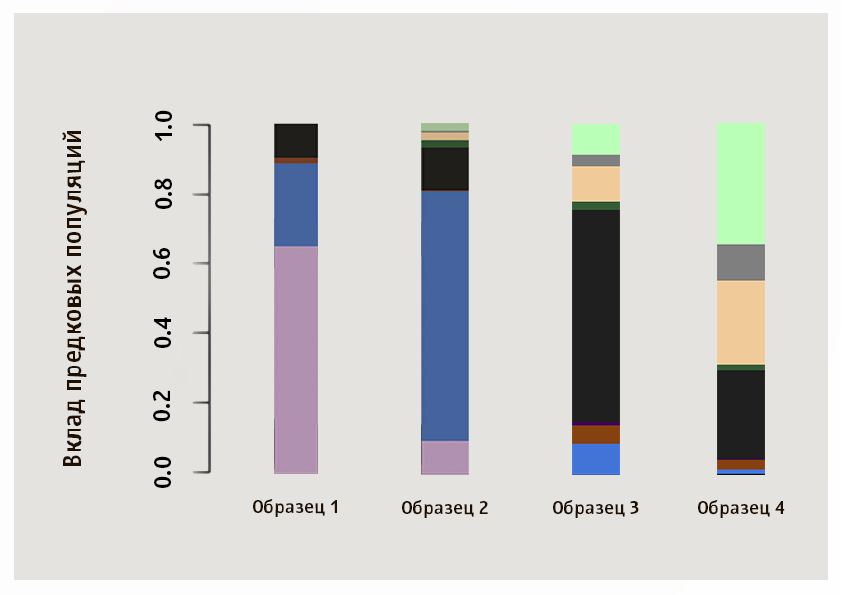
Although exactly the population closest to a given sample is determined by numerical values, a lot of information can be obtained by visual comparison of patterns. We suggest that you independently identify the closest populations for samples of four Genotek clients from the image.
A total of 722 samples, we found 9 Ashkenazi Jews.
Population - is not the only factor determining the ethnic identity of a person. However, it is still possible to identify a correlation between ethnic groups and the structure of the genome of their representatives. Such an analysis is used both for scientific and medical purposes, as well as for the study of one's own roots by everyone. It is important to understand that the models are constantly being improved, and the results for greater accuracy should be considered together with other data, for example, the family genealogical tree.
No evidence of Khazar origin of Ashkenazi was found by the authors of the original article. Genetic tests, of course, "can" identify the Jews - but do not forget that "Jewry" is, above all, a state of mind.
In the near future, the updated Genealogy DNA test with advanced results will be launched in Genotek: we will increase the number of populations to hundreds, add Jewish populations. We will update the information in your account for everyone who has ever handed us your genetic material. If you are still not genotyped, we invite you to join .
In the new material Genotek on Geektimes we will try to answer everything in order. And yes, the Jews also define.
Race aka population groups in biology, medicine, and genetics
Mankind has a bad habit of justifying violence by the “innate” superiority of one race over another - that’s why modern biologists approach the question of genetic differences between populations with the sapper’s caution. (Not) the existence of biological boundaries between racial and ethnic groups was fiercely discussed throughout the 20th century, but no final consensus on this issue has been reached so far ( 1 ).
')
There were hopes that the sequencing of the human genome would reconcile all. The genome, read “from” and “to”, will show that the boundaries between groups are of a social nature, and the genes are the same for all. It turned out differently: a careful study of the human nucleotide code revived and heightened interest in biological differences between racial and ethnic populations. Similar, in general, genes found slightly different allelic variants associated with the risk of disease ( 2 ), drug metabolism ( 3 ), the body’s response to environmental conditions ( 4 ), and these variants were encountered in different populations with different frequencies.
The search for non-existent "Indian" or "African" genes was stopped, but research in the field of medical and population genetics continues to draw parallels between the biological characteristics and the ethnicity of the participants. The use of the terms "race" and "ethnicity" in such works is actively discussed (and often condemned). There have been attempts to introduce rules that make researchers justify the need to use “slippery” categories and clarify what exactly is meant by specific terms. In February last year, in Science, one of the most authoritative natural science journals, an ambiguous article ( 5 ) was published, suggesting that we completely abandon the use of the term “race” in genetic research, replacing it with a more correct and neutral “ancestry” - “origin” .
But even in the face of uncertainty with terms, the division of humankind into population groups is still necessary: in particular, for the correct conduct of clinical trials of drugs and the assessment of the risk of diseases. For example, the three allelic variants of the NOD2 gene - R702W, G908R and 1007fs - are associated with an increased risk of Crohn's disease in European Americans ( 6 , 7 ), however, none of these variants is associated with Crohn's disease in Japanese ( 8 ). Known alleles of the CCR5 gene affecting the rate of development of immunodeficiency in HIV-infected patients ( 9 ): among them was found an option that slows the progression of the disease in European Americans, but accelerates its development in African Americans ( 10 ). In Asians, a correlation was found between the polymorphisms of the p53 protein gene, which regulates the stress response and suppresses the development of tumors, and the average winter temperatures in the populations' habitats - genetic adaptation to frost ( 11 ). And if in the past, only information provided by the participants themselves was used to divide the sample into ethnic groups, in the post-genomic era they are increasingly complemented and specified by genetic evaluation of the subject's origin.
Genetic variations between populations
In everyday life, we divide people into groups by appearance or language of communication. Most Danes resemble each other more than each of them - like an Italian ( here is a cool visualization with averaged portraits of different nationalities). Danes and Italians are much closer to each other than each of them to the inhabitants of sub-Saharan Africa: human phenotypes are clustered according to a geographical pattern. The distribution of genotypes has a similar structure: members of a local group, as a rule, have closer family ties than residents of remote areas, and populations inhabiting one region are closer than those whose habitats are separated by geographic barriers (for example, mountain ranges or water array).
At the same time, the genetic diversity of the human population is lower than in many species. This is explained by the fact that humanity is a kind of young: some groups had relatively little time to accumulate differences. Two randomly selected people differ from each other in each of ~ 1000 nucleotides, whereas two chimpanzees do not coincide every ~ 500 "letters". And yet, in total, there are about 3 million potential “points of divergence” in the human genome. Most of these discrepancies, called single nucleotide polymorphisms (SNPs), are neutral or almost neutral, but some of them are responsible for the phenotypic differences between people.
The distribution of neutral polymorphisms (since they do not have a biological meaning, are not subject to directed evolutionary selection, carried by the wind of migrations) in the world population reflects the demographic history of our species. Genetic and archaeological evidence indicates that the size of the human population has increased significantly over the past 100,000 years. People settled outside Africa, colonizing the rest of the world. The resettlement process influenced the geographical distribution of alleles in two ways: first, the “founder effect” had an effect - in the population of immigrants, as a rule, only part of the genetic variants from the entire pool of their diversity in the ancestral population was represented; secondly, the so-called “assortative crossing” took place, i.e. the pairs were formed mainly within their group, which limited the spread of existing and de novo emerging polymorphisms among individuals inhabiting different geographic areas. These processes led to a gradual accumulation of genetic differences.
In the context of population groups, genomic markers began to be studied in the 70s – 80s, in the 90s they were used to identify the population of a particular person. Researchers have again and again demonstrated that genetic polymorphisms make it possible to successfully isolate population groups and determine the group identity of an individual. At the same time, it was shown that people living on the same continent are, as a rule, closer to each other genetically than people from different continents. Initially, in such studies information about the place of birth, race, ethnic group was known from the very beginning and was used in conjunction with genetic data; if the subjects were distributed blindly to the clusters, solely on the basis of genetic traits, the correspondence between geographical origin, ethnicity and population structure was less pronounced. As further studies have shown, success depended on the genetic markers used and their number (more - better), the correct choice of reference populations and other factors ( 12 ).
By 2004, in the US, the genetic definition of population ownership was used not only in biomedical research, but also in investigating crimes: this article from Nature contains a fascinating story of how the police, desperate to find a criminal, ordered a DNA test in a commercial company, decided on skin color of the suspect and solved the case. Proposals for the analysis of genetic origin have successfully fallen into a wave of people's general interest in their own past. “Roots mania” was the name given to this hobby in an article in Time devoted to “America's latest obsession” - genealogical research.
Experts studying the origin and evolution of peoples actively use genomic methods. For example, in 2013, an international team of researchers used genetic analysis to refute the hypothesis of the origin of Ashkenazi Jews from the Khazars ( 13 ). The set of genomic data used by the authors is publicly available: it contains more than 100 world populations. We propose to model a small study with us: to determine the place of Genotek clients in this sample, and at the same time to understand the technical details of the definition of population affiliation.
Purpose of the study
Determine the place of Genotek clients among reference populations. Find out if there are representatives of Ashkenazi Jews in our sample. Demonstrate the principles and methods of analyzing the population of the individual person.
Research objectives
To process the genotyping data of 722 subjects using the ADMIXTURE program, using the data set from Behar et al., 2013 as a training sample.
Materials and methods
The original work of Behar et al., 2013, used data from 1,774 people: among them were representatives of 88 non-Jewish populations (from Arabia, Central Asia, East Asia, Europe, the Middle East, North Africa, Siberia, South Asia, and sub- Saharan Africa) and 18 Jewish populations. The authors needed an extensive data set to accurately determine the location of Ashkenazi in the context of world populations: the task was to present all three geographical regions from which this group could hypothetically occur - Europe, Middle East and the Khazar Khaganate. The authors emphasized the difference between the approach to sampling, representing modern European, Middle Eastern and Jewish populations - direct descendants of ancestral populations, and samples corresponding to the Khazar kaganate, which ceased to exist about 1000 years ago. The hitch is that none of the currently existing populations is a direct heir of the Kaganate. Authors of the South Caucasus (Abkhazians, Armenians, Azeris, Georgians), North Caucasians (Adygs, Balkarians, Chechens, Kabardians, Ossetians and several other nationalities), Chuvash and Tatars, were chosen by the authors as possible contemporary representatives of the Khazars.
We added samples of 722 people from various regions of Russia to the data set.
For the statistical analysis, the ADMIXTURE program was used, which allows one to estimate the most probable origin of an individual on the basis of data on genotypes. In addition, the authors of the article under discussion used other statistical methods that gave a similar answer to the question posed. We will focus on ADMIXTURE, since it is this algorithm that allows us to estimate the percentage contribution of ancestral populations to the studied genomes.
ADMIXTURE uses Monte Carlo methods in Markov chains (Markov chain Monte Carlo, MCMC). Here is a link to the article of the authors of the algorithm for those who want to understand in more detail the mathematical side of the process.
Consider how ADMIXTURE works on the example of samples and populations from our set
We have a total of 2,496 specimens / individuals, each of which belongs to one of 106 modern populations. We assume that modern populations are likely to have evolved from a relatively small number of ancestral populations. “Ancestral populations” in such an analysis are some ancient genomic clusters united according to the principle of genetic similarity. ADMIXTURE allows both arbitrarily putting forward assumptions about the number of such clusters in a sample, as well as selecting the optimal number that most correctly describes the actual distribution of genomic data.
After receiving information about the genotypes and the estimated number of “ancestral” populations (K), ADMIXTURE builds a model that evaluates the contribution of each of the “ancestral” populations to each sample. When interpreting data, both the quantitative composition of the genome (the percentage ratio of clusters) and the qualitative one — their presence or absence in specific genomes — is important. Based on these data, it is possible to make assumptions about the evolutionary processes in a population, in particular, about the presence or absence of common “roots” among population groups. However, the conclusions will be legitimate if the model we have built is good: the optimal value of K is chosen.
Choose the optimal value of K
How to determine how many “ancestral” populations most closely match the true for this sample? In an empirical way!
ADMIXTURE is a smart program: building a model of the genetic structure of populations based on data on individuals' genotypes (evaluating the contribution of each of the ancient genomic clusters to each of the genomes of the sample) for a given number K, it does not forget to compare it with reality at the end. Check how well the input data is described by the constructed model. The measure of comparison is “error” - a value that describes the discrepancy between the model and real data. The greater the error, the worse the assumption about the number of ancestral populations corresponds to reality.
How to choose the optimal value of K? We run the ADMIXTURE algorithm on this sample, substituting different values of K, and we obtain for each K its own error value. We build a graph of the dependence of the magnitude of the error on K. This is the graph that the authors of the article turned out to be:
The optimal value of K is at the minimum point of the function. If the minimum on the graph is not detected (the function is constantly increasing or decreasing), you will have to build models, choosing new K, until you find the right one.
Even with optimally selected K, the reliability of the analysis results depends on the correctness of the sample:
1. Individuals should not be related to each other.
2. Single nucleotide polymorphisms (SNP), which are used for genotyping, should be evenly distributed across the genome with a sufficiently high density.
3. SNP alleles must be in equilibrium adhesion, that is, the probability of the presence of a given allele in a particular individual should depend only on the frequency of this allele in the population, but not on other alleles in the genome.
As can be seen from the graph, the optimal K for this sample was 10 “ancestral” populations.
results
The results of the analysis are presented by ADMIXTURE like this (only part of the data is visible in the figure):
Each cluster has its own color, and populations differ (or do not differ) in the shares of clusters in the genome. Here is an interactive version of the picture for detailed study: move your mouse and scroll to see all populations or to consider some of the groups in more detail.
In general, within the “population” of Genotek, the ratio of clusters expectedly corresponds to a pattern characteristic of populations of Eastern European origin. Interesting starts at the level of individual samples:
Although exactly the population closest to a given sample is determined by numerical values, a lot of information can be obtained by visual comparison of patterns. We suggest that you independently identify the closest populations for samples of four Genotek clients from the image.
Answer
In this picture, samples 1 and 2 are of Asian origin: the predominance of the pink cluster is typical for the Japanese and the khan people in our sample, blue is for the Yakuts, the third sample shows the ratio of components characteristic of Russians, Belarusians, Ukrainians and Poles, and the fourth is typical Ashkenazi Jew.
A total of 722 samples, we found 9 Ashkenazi Jews.
Conclusion
Population - is not the only factor determining the ethnic identity of a person. However, it is still possible to identify a correlation between ethnic groups and the structure of the genome of their representatives. Such an analysis is used both for scientific and medical purposes, as well as for the study of one's own roots by everyone. It is important to understand that the models are constantly being improved, and the results for greater accuracy should be considered together with other data, for example, the family genealogical tree.
No evidence of Khazar origin of Ashkenazi was found by the authors of the original article. Genetic tests, of course, "can" identify the Jews - but do not forget that "Jewry" is, above all, a state of mind.
In the near future, the updated Genealogy DNA test with advanced results will be launched in Genotek: we will increase the number of populations to hundreds, add Jewish populations. We will update the information in your account for everyone who has ever handed us your genetic material. If you are still not genotyped, we invite you to join .
Bibliography
- Foster M., Sharp R. (2002). Race, Ethnicity, and Genomics: Social Classifications as Proxies of Biological Heterogeneity. Genome Res.
- Collins FS, McKusick VA (2001). Implications of the Human Genome Project for medical science. Jama.
- Nebert DW, Menon AG (2001) Pharmacogenomics, ethnicity, and susceptibility genes. Pharmacogenomics J.
- Olden K., Guthrie J. (2001). Genomics: Implications for toxicology. Mutat. Res.
- Yudell M., Roberts D., DeSalle R., Tishkoff S. (2016). Taking race out of human genetics. Science.
- Ogura, Y. et al. (2001). Ampshift mutation in NOD2 associated with susceptibility to Crohn's disease. Nature.
- Hugot, JP et al. (2001). Association of NOD2 leucine-rich sequences with susceptibility to Crohn's disease. Nature.
- Inoue, N. (2002). Lack of common NOD2 variants in Japanese patients with Crohn's disease. Gastroenterology.
- Martin, MP et al. (1998). Genetic acceleration of AIDS progression by a promoter variant of CCR5. Science.
- Gonzalez, E. et al. (1999). Race-specific HIV-1 disease-modifying effects associated with CCR5 haplotypes. Proc. Natl Acad. Sci. USA.
- Shi, Hong et al. (2009). Tumor Suppressor Pathway in Eastern Asia. American Journal of Human Genetics.
- Bamshad M., Wooding S., Salisbury B. et al. (2004). Deconstructing the relationship between genetics and race. Nat Rev Genet.
- Behar DM et al. (2013). No Evidence from Khazar Origin for the Ashkenazi Jews. Human Biology.
Source: https://habr.com/ru/post/402923/
All Articles