Analyzing data sets from open data portal data.gov.ru
Last time [ Downloading data from the open data site data.gov.ru ] I was able to learn how to download data from the open data portal of Russia. The open data portal should provide the most up-to-date information about open data of federal authorities, regional authorities and other organizations (quoted from data.gov.ru). Let's see what data is on the portal, how relevant they are and how they are placed.
The pie chart below shows the distribution of data sets into categories.
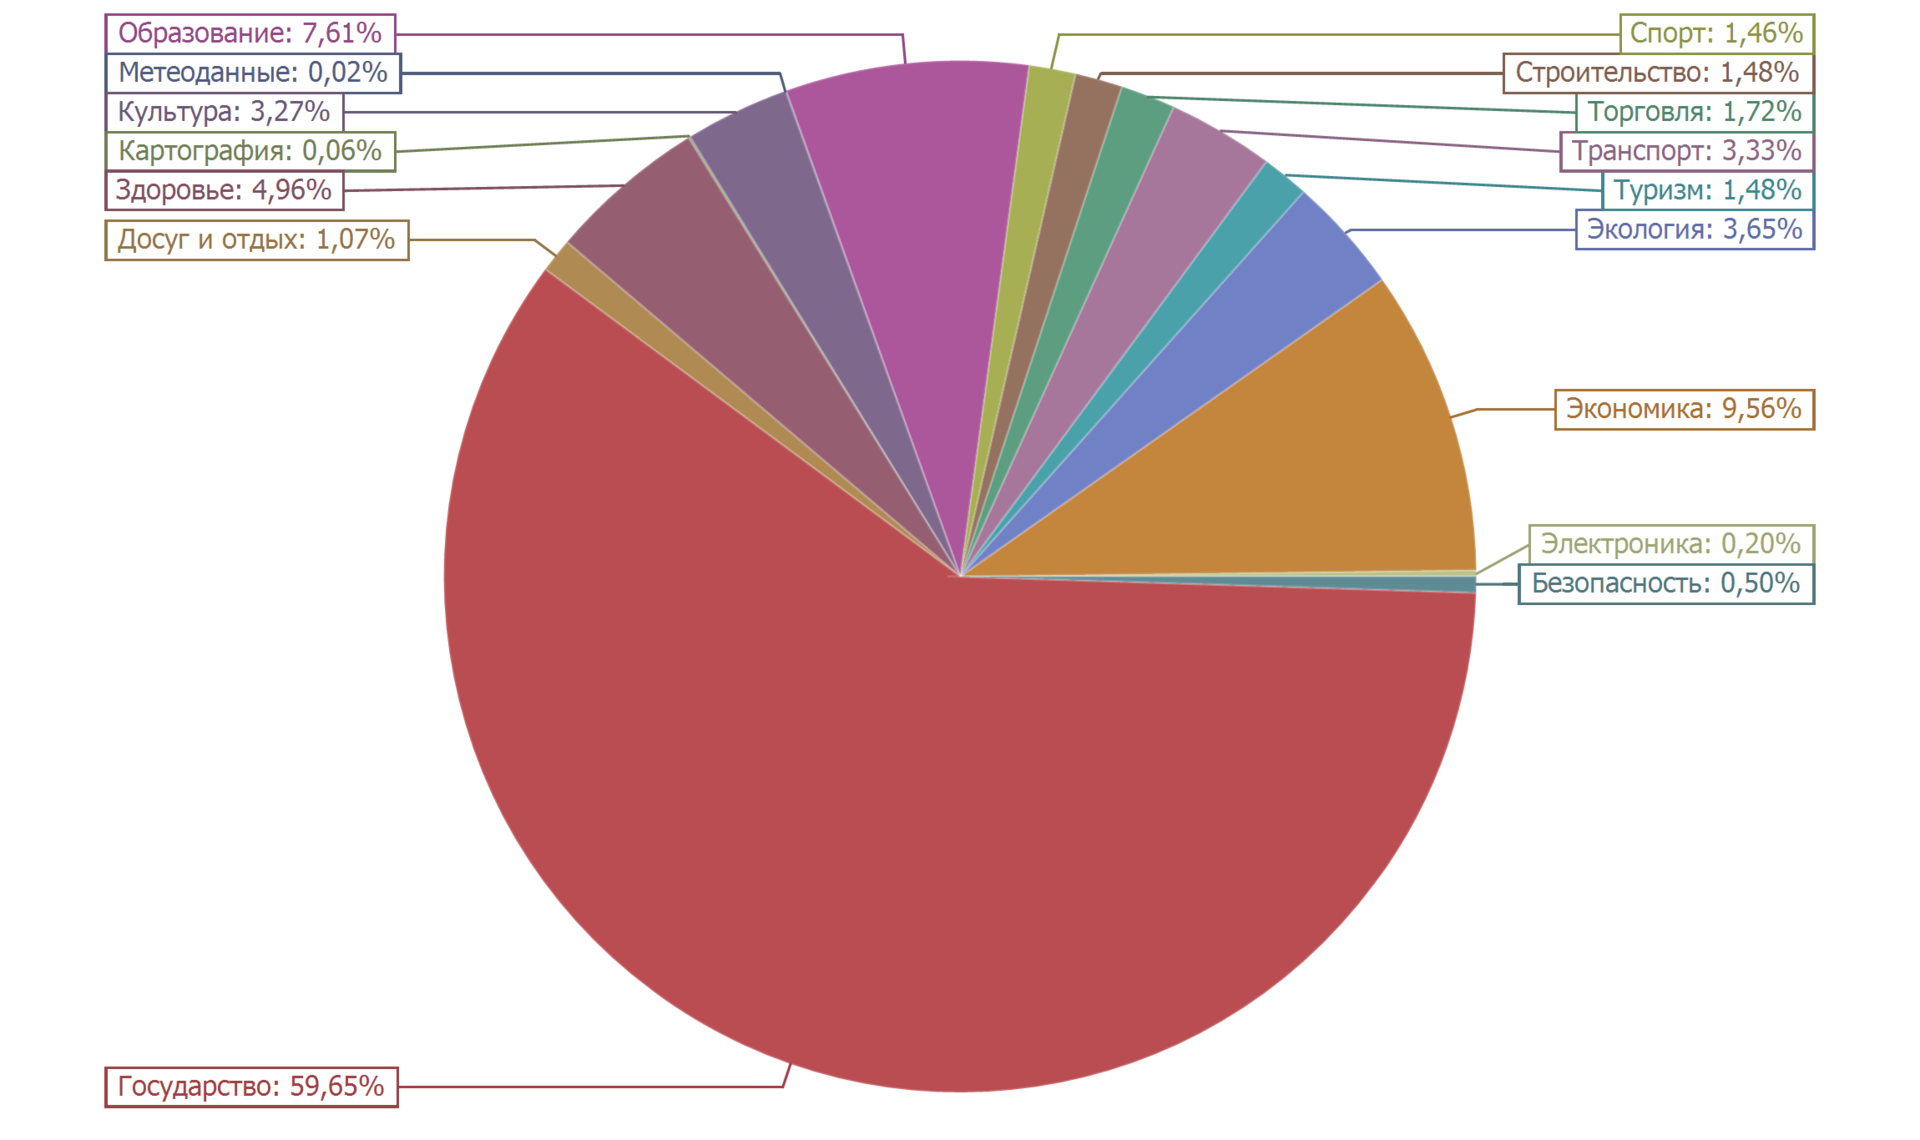
More than half of the data sets (59.65%) belong to the “State” category. About ten percent (9.56%) fall into the category of "Economy". Close to ten percent (7.61%) is the number of data sets in the Education category. The rest is less than five percent. The distribution is quite natural.
')
We will expand familiarity with the data posted on the portal. Let's look at the statistics of placing data on the portal by the date of the first publication of the data set.
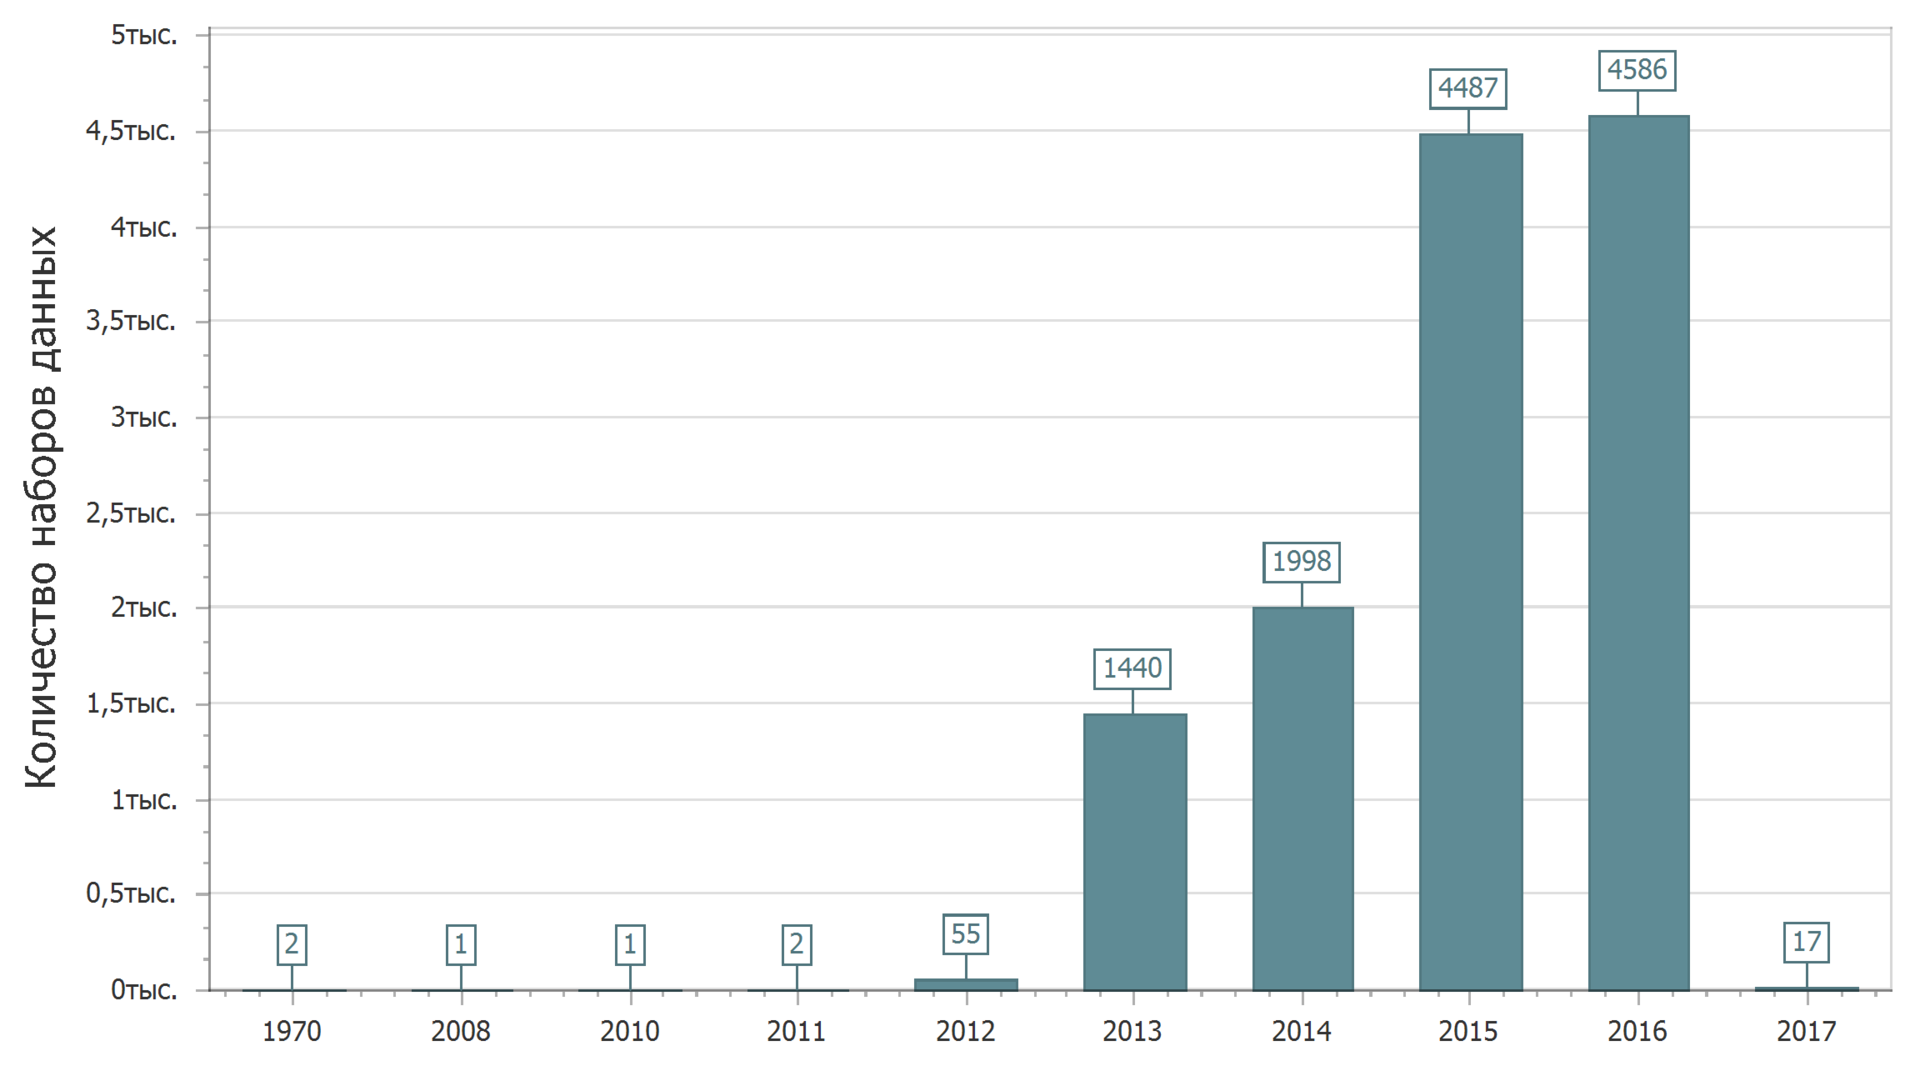
2017 has just begun, and it is only natural that the amount of data placed in 2017 will increase. Yes, while I am writing text, new data sets are uploaded to the portal.
Apparently, someone had back in the past, having managed to place the data back in 1970.
In general, the picture is clear: first, a sharp increase, then - stability. Although it’s probably too early to talk about stability.
An interesting picture can be seen if we consider the distribution of data sets by the date of relevance (the date after which the current version of the data set should be updated).
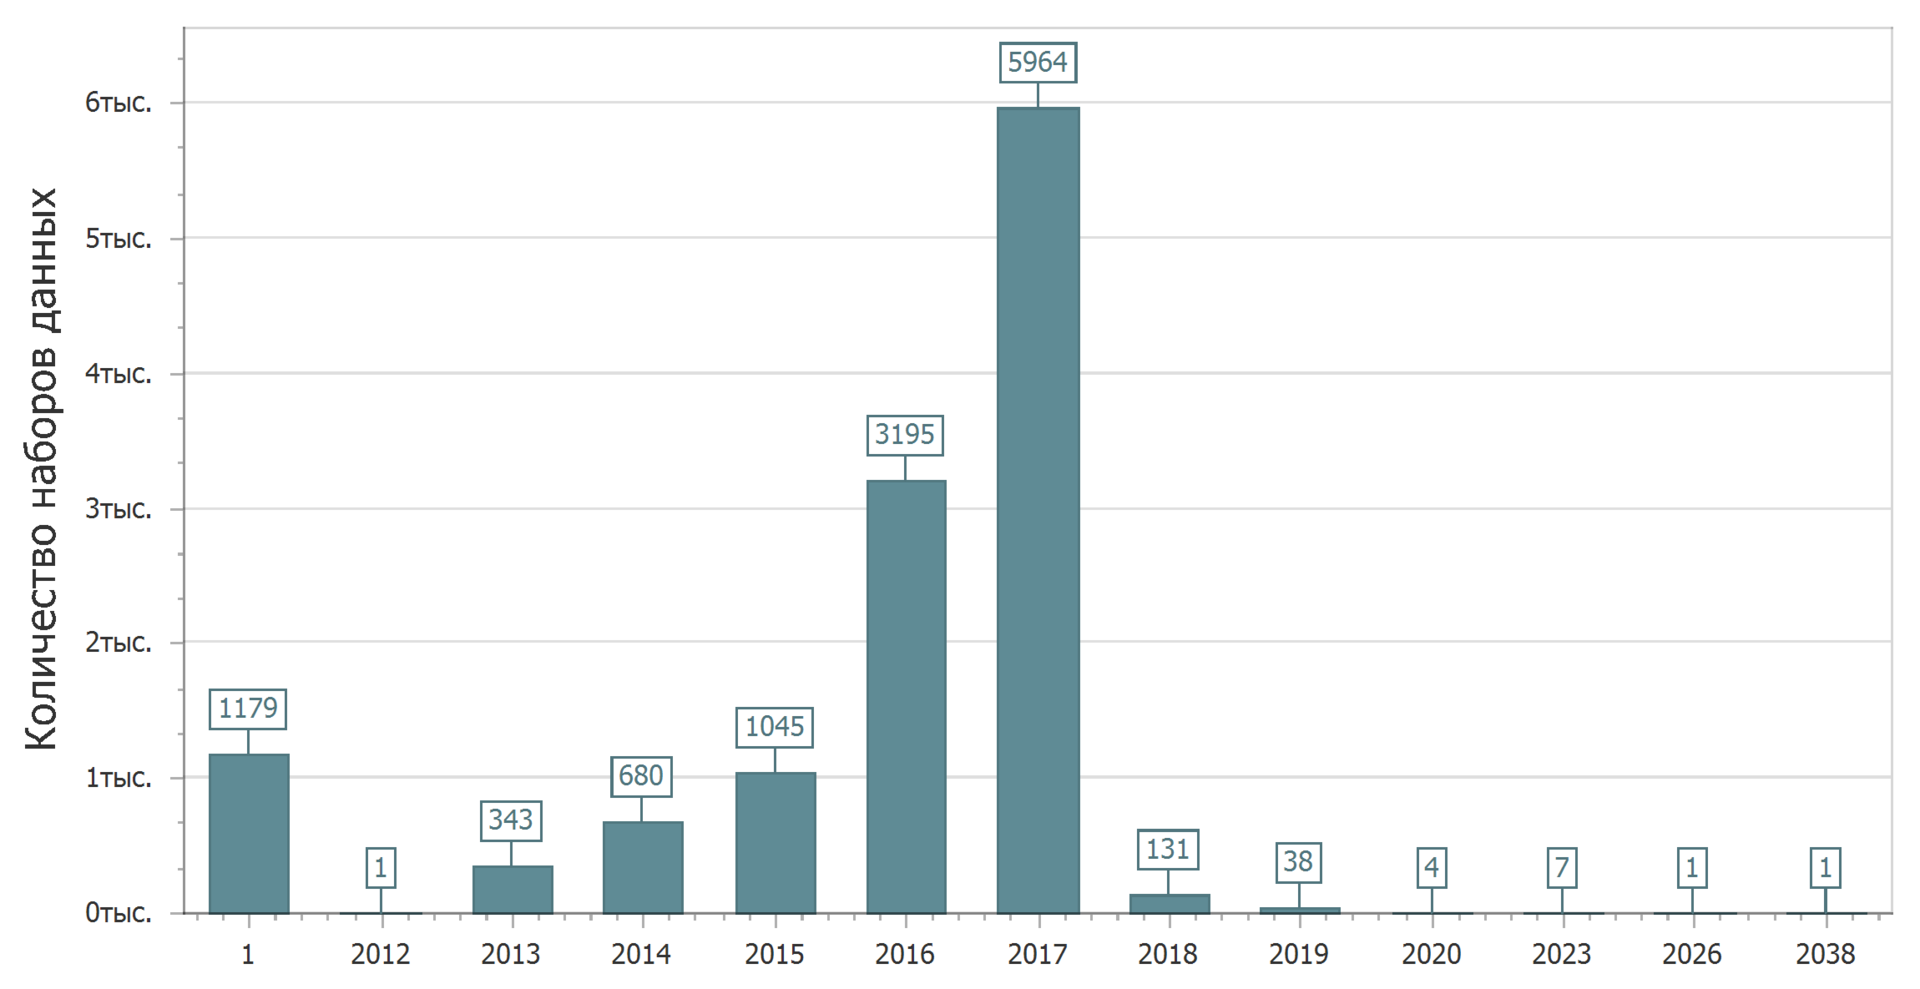
Immediately throws 1 year. Thus, I have designated data sets that have no date of relevance. Based on the definition of the date of relevance, we can conclude that these are data sets that are generally not necessary to update. Naturally, such data sets have the right to exist. There is always archival (historical) data that is unlikely to change (well, if there are no errors in them), and there is current data — actual data that is constantly changing. Both may be of interest. After all, it happens that you need to find out: how was it there in the past (with the king or under the Soviet regime)? But, of course, more interesting are the actual (live) data that is constantly updated.
Even if you do not carefully consider the chart, it is clear that some data should be updated in a sufficiently distant future. We can say that those who placed them have tremendous confidence in the future. The next five, ten, twenty (?) Years, they will not change anything. Or maybe it's just a mistake? And it is possible.
But in general, the picture is quite joyful - almost half of the data plans to be updated in the current year.
And now we will confirm this joyful picture. Consider the distribution of data sets by last modified date.
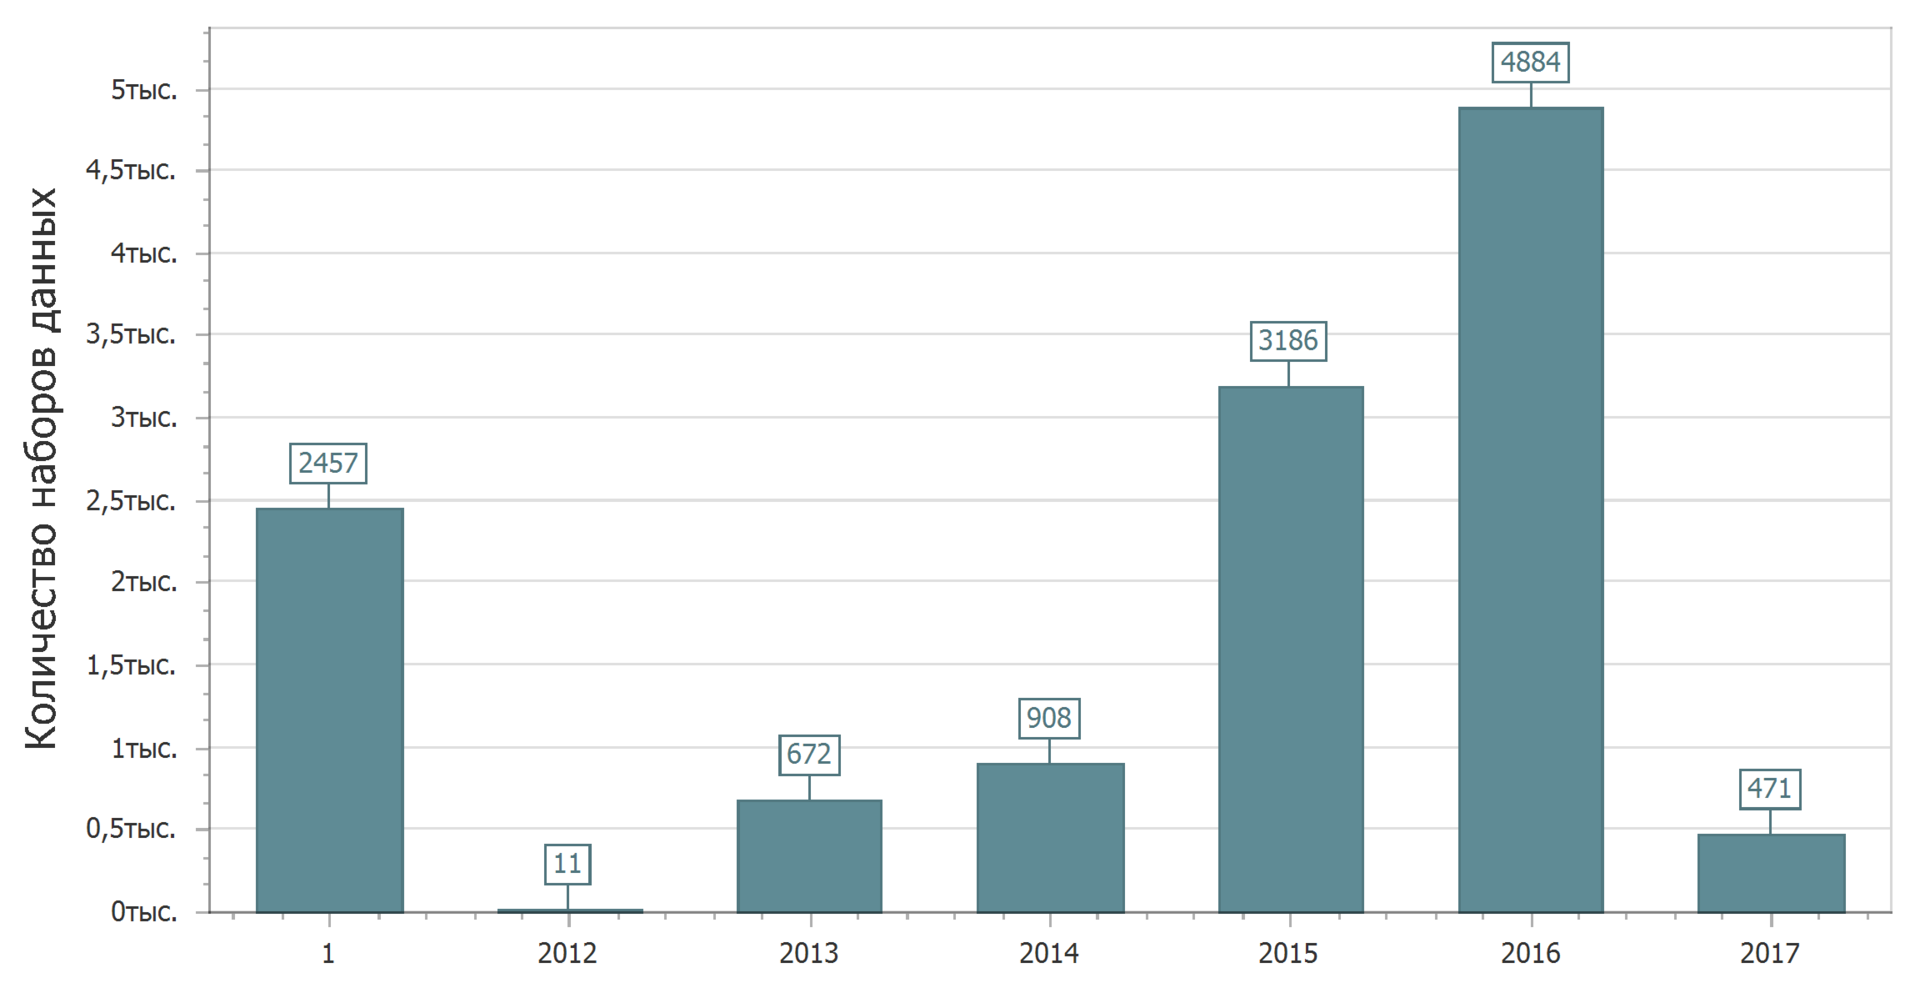
Yes. Again 1 year. These datasets had no changes. Just want to catch someone. Type, promised to update, but did not make changes. Or did not promise to update and updated. But this next time we will look for patterns (or lack thereof).
Combine information about the first publication and the latest update. That is, if there was an update, take the update date, if there was no update, take the date of the first publication. This will result in the date of the last data change.

Beauty. The trend is clearly visible - more than half of the data was last modified or were created in 2016-2017. Perhaps you can consider them relevant.
It is necessary to note one nuance. Some data sets are repeated: the same data set name and owner are found in the registry several times.
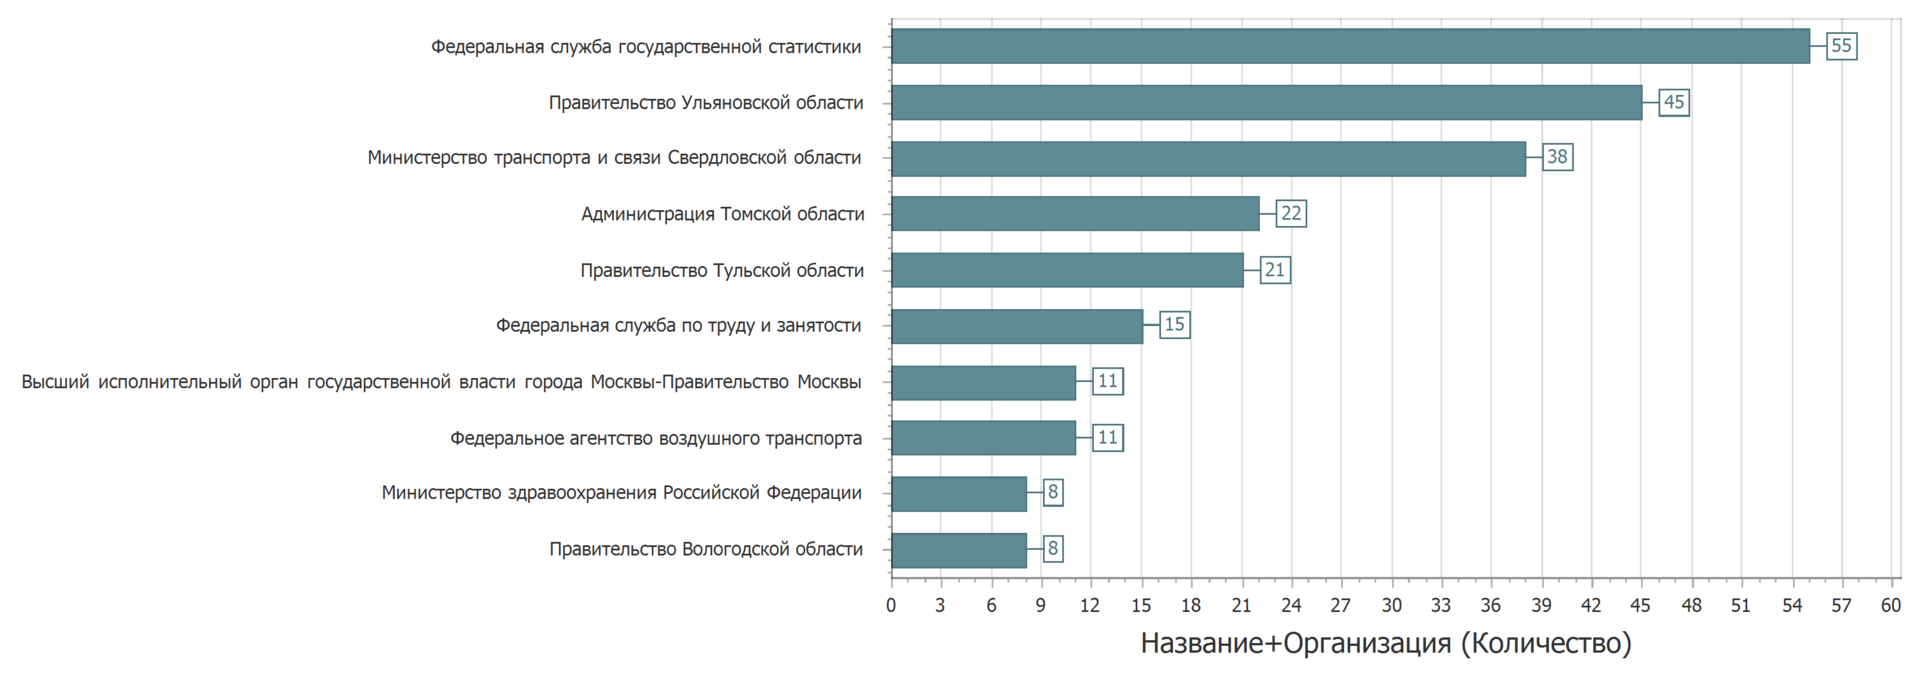
Instead of updating the data set laid out again. Sometimes the sets were laid out in another category. But if we consider data sets with the same name, owner and category, the picture will be as follows.
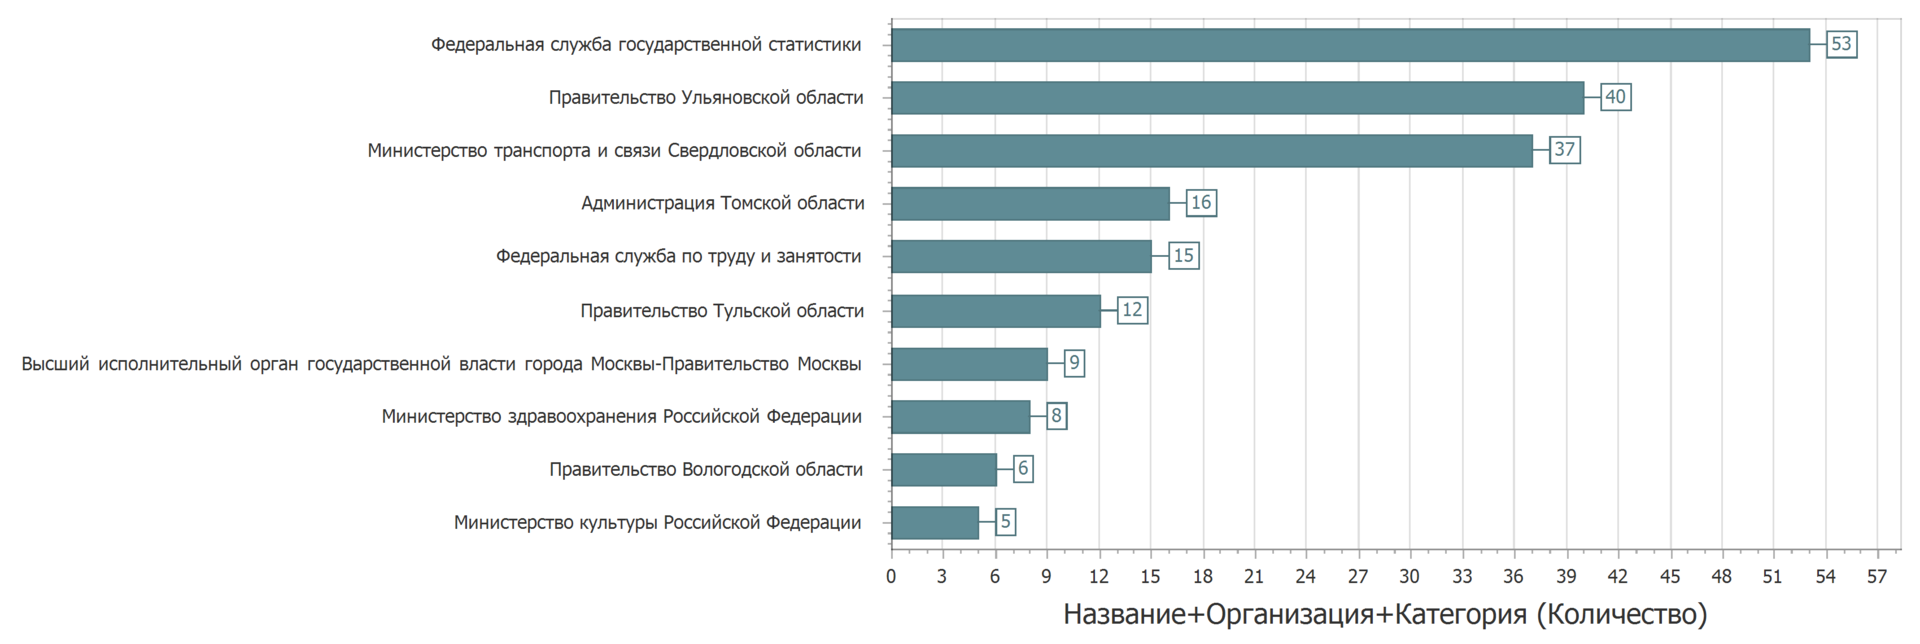
At least, very similar. But it is hardly critical. Some owners of the data, apparently, need to carefully lay out the data.
A small check on the filling of text fields in passports data sets.
The name and category are given everywhere. Almost a fifth of the data sets do not contain a description. Almost everywhere the owner is known and some keywords are given. Responsible person is also almost everywhere present. It is not clear why we need data sets that can not be downloaded (about 3%).
As a result, we divide all data sets into two categories: all fields are set, at least one field is not specified.

Thirty percent (30.3%) have at least one unspecified field. In what format do they post the data?
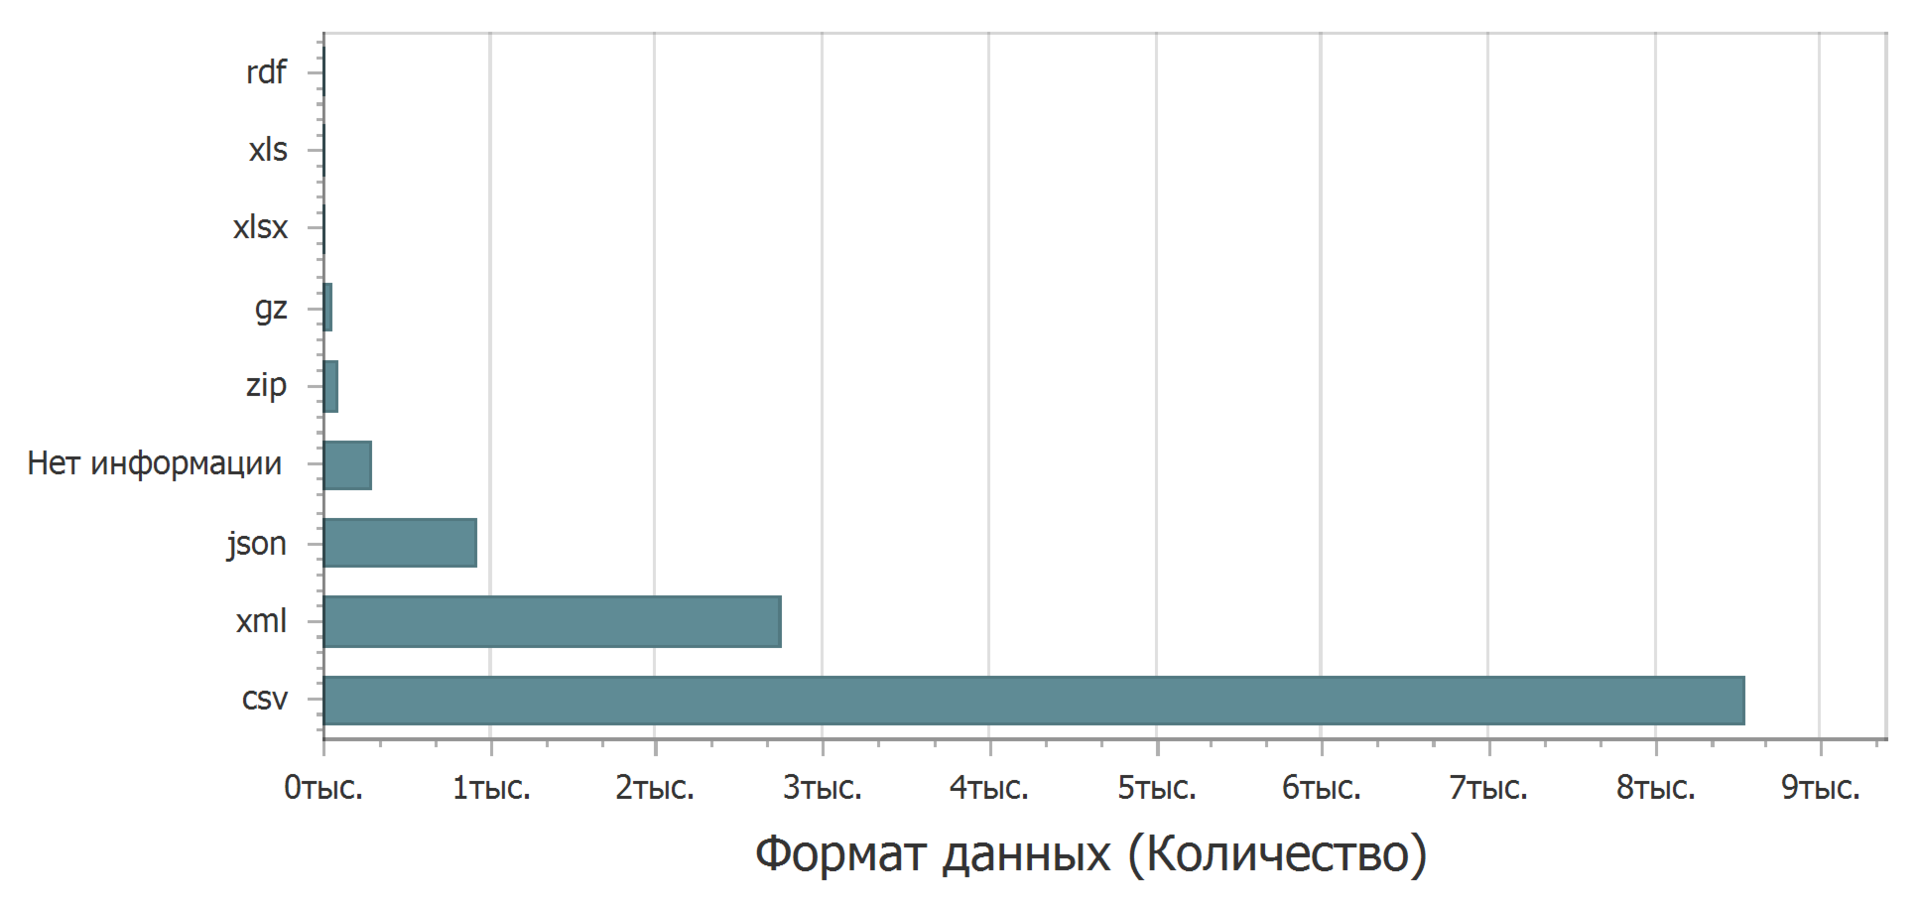
Most in plain text format with a delimiter (csv). In second place is xml. On the third json. The clear leader is the csv format - you can open it in any text editor, import it almost anywhere to be processed, with a little effort to insert it as a table into a text editor. The xml format is also fairly easy to see. But with the json format problems may arise. If you focus on Excel, as the most commonly used spreadsheet editor, then json is already a problem. You can, googling on this topic, find a way to download, but not direct. Excel doesn't have built-in json downloads.
Of course, the problem is not a scary, non-lethal, but unpleasant. Surely, this format will stop or confuse someone.
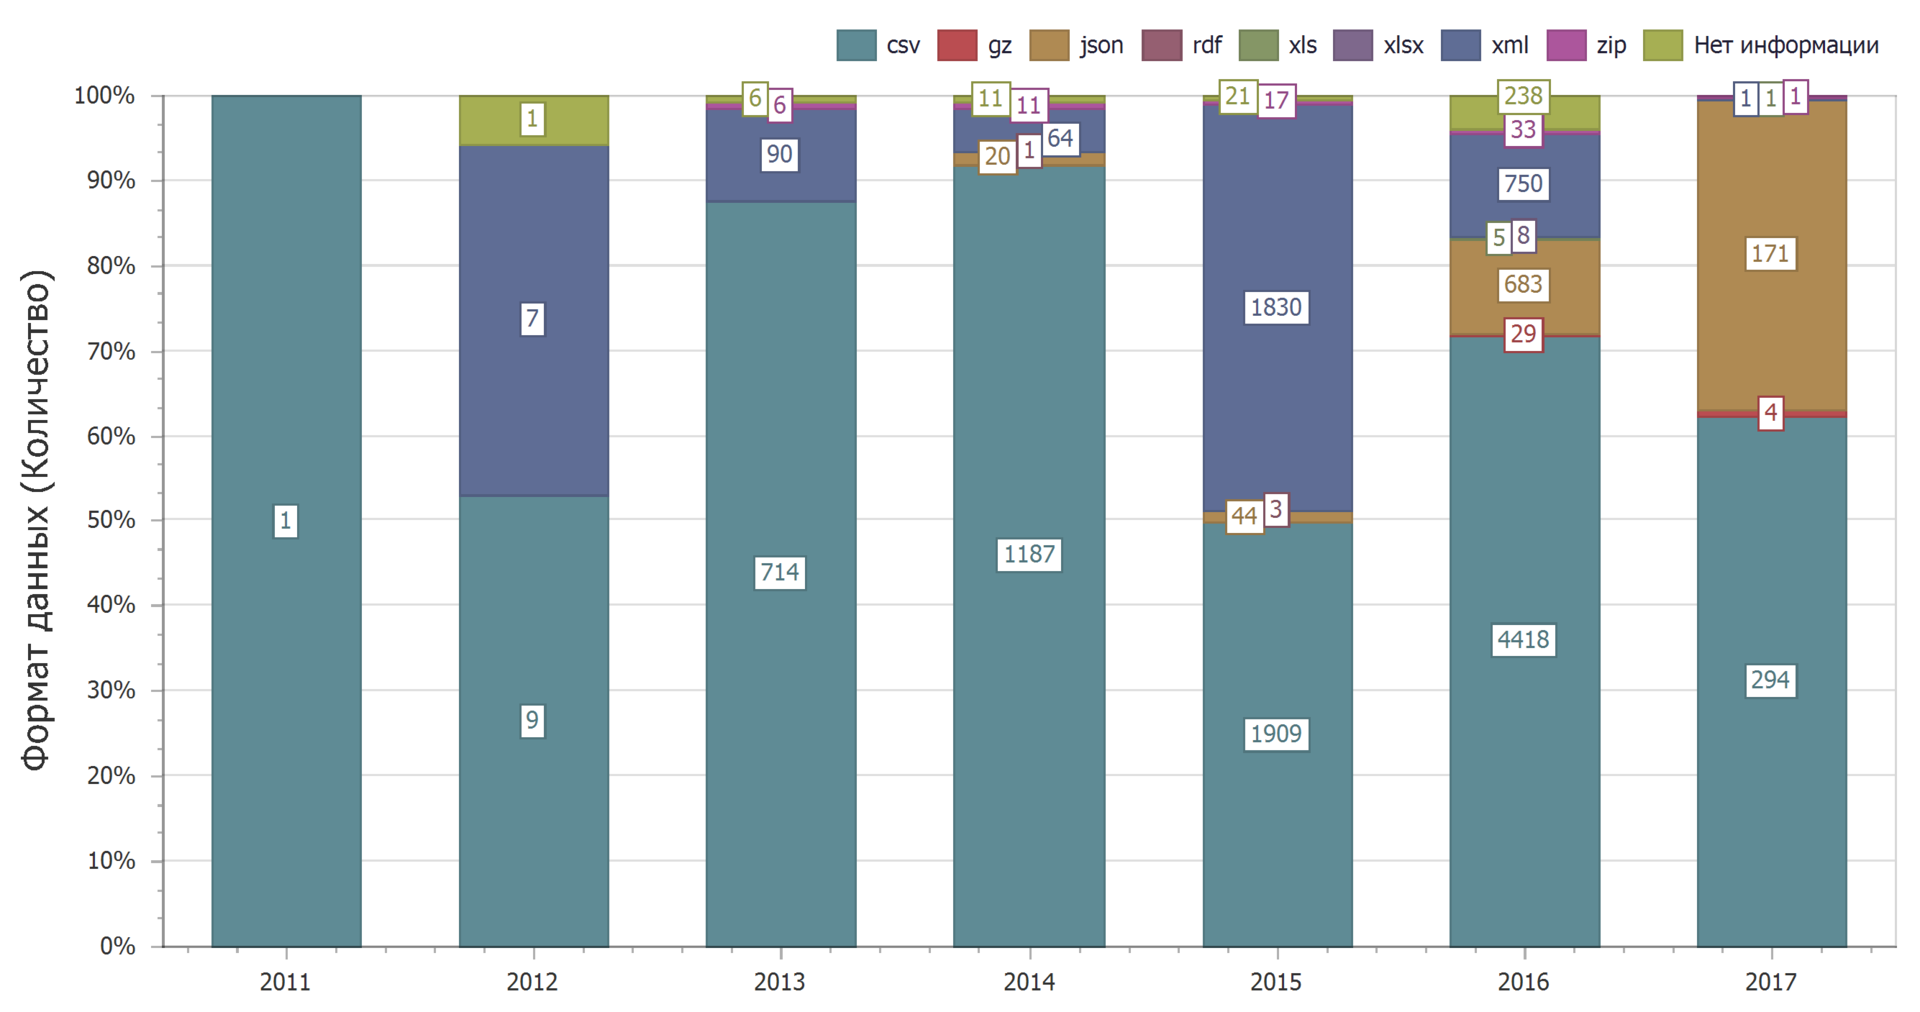
From the distribution by years it can be seen that over time, the dominance of the csv format is preserved.

The use of the json format will increase dramatically. This reduces the use of the xml format.
And this can be found an explanation. The csv format is the easiest, so it is often used. At the same time, web services are now increasingly using the json format and less and less xml.
More than half of the data posted on the open data portal of Russia belong to the “State” category.
More than half of the data was last modified or created in 2016-2017.
Thirty percent of dataset passports have at least one unspecified field.
The most common formats for storing open data are csv, xml, json. At the same time, there is an increase in the number of data sets in json format and a reduction in the number of data sets in xml format.
After analyzing the data sets, let's see how often they are used - viewed, downloaded. What are the ratings given by users of data sets? What data sets are of interest? How often are the datasets updated? What is the size of the data sets? And is there a relationship between everything?
The pie chart below shows the distribution of data sets into categories.
More than half of the data sets (59.65%) belong to the “State” category. About ten percent (9.56%) fall into the category of "Economy". Close to ten percent (7.61%) is the number of data sets in the Education category. The rest is less than five percent. The distribution is quite natural.
')
We will expand familiarity with the data posted on the portal. Let's look at the statistics of placing data on the portal by the date of the first publication of the data set.
2017 has just begun, and it is only natural that the amount of data placed in 2017 will increase. Yes, while I am writing text, new data sets are uploaded to the portal.
Apparently, someone had back in the past, having managed to place the data back in 1970.
In general, the picture is clear: first, a sharp increase, then - stability. Although it’s probably too early to talk about stability.
An interesting picture can be seen if we consider the distribution of data sets by the date of relevance (the date after which the current version of the data set should be updated).
Immediately throws 1 year. Thus, I have designated data sets that have no date of relevance. Based on the definition of the date of relevance, we can conclude that these are data sets that are generally not necessary to update. Naturally, such data sets have the right to exist. There is always archival (historical) data that is unlikely to change (well, if there are no errors in them), and there is current data — actual data that is constantly changing. Both may be of interest. After all, it happens that you need to find out: how was it there in the past (with the king or under the Soviet regime)? But, of course, more interesting are the actual (live) data that is constantly updated.
Even if you do not carefully consider the chart, it is clear that some data should be updated in a sufficiently distant future. We can say that those who placed them have tremendous confidence in the future. The next five, ten, twenty (?) Years, they will not change anything. Or maybe it's just a mistake? And it is possible.
But in general, the picture is quite joyful - almost half of the data plans to be updated in the current year.
And now we will confirm this joyful picture. Consider the distribution of data sets by last modified date.
Yes. Again 1 year. These datasets had no changes. Just want to catch someone. Type, promised to update, but did not make changes. Or did not promise to update and updated. But this next time we will look for patterns (or lack thereof).
Combine information about the first publication and the latest update. That is, if there was an update, take the update date, if there was no update, take the date of the first publication. This will result in the date of the last data change.
Beauty. The trend is clearly visible - more than half of the data was last modified or were created in 2016-2017. Perhaps you can consider them relevant.
It is necessary to note one nuance. Some data sets are repeated: the same data set name and owner are found in the registry several times.
Instead of updating the data set laid out again. Sometimes the sets were laid out in another category. But if we consider data sets with the same name, owner and category, the picture will be as follows.
At least, very similar. But it is hardly critical. Some owners of the data, apparently, need to carefully lay out the data.
A small check on the filling of text fields in passports data sets.
| Field | Set | Not set |
|---|---|---|
| Title | 100% | 0% |
| Description | 80.84% | 19.16% |
| Categories | 100% | 0% |
| Owner | 99.7% | 0.03% |
| Keywords | 99.48% | 0.52% |
| Responsible person | 96.43% | 3.57% |
| Phone number of the responsible person | 96% | four% |
| Responsible person's email address | 92.68% | 7.32% |
| Data format | 97.79% | 2.21% |
| Link to the set | 96.86% | 3.14% |
The name and category are given everywhere. Almost a fifth of the data sets do not contain a description. Almost everywhere the owner is known and some keywords are given. Responsible person is also almost everywhere present. It is not clear why we need data sets that can not be downloaded (about 3%).
As a result, we divide all data sets into two categories: all fields are set, at least one field is not specified.
Thirty percent (30.3%) have at least one unspecified field. In what format do they post the data?
Most in plain text format with a delimiter (csv). In second place is xml. On the third json. The clear leader is the csv format - you can open it in any text editor, import it almost anywhere to be processed, with a little effort to insert it as a table into a text editor. The xml format is also fairly easy to see. But with the json format problems may arise. If you focus on Excel, as the most commonly used spreadsheet editor, then json is already a problem. You can, googling on this topic, find a way to download, but not direct. Excel doesn't have built-in json downloads.
Of course, the problem is not a scary, non-lethal, but unpleasant. Surely, this format will stop or confuse someone.
From the distribution by years it can be seen that over time, the dominance of the csv format is preserved.
The use of the json format will increase dramatically. This reduces the use of the xml format.
And this can be found an explanation. The csv format is the easiest, so it is often used. At the same time, web services are now increasingly using the json format and less and less xml.
findings
More than half of the data posted on the open data portal of Russia belong to the “State” category.
More than half of the data was last modified or created in 2016-2017.
Thirty percent of dataset passports have at least one unspecified field.
The most common formats for storing open data are csv, xml, json. At the same time, there is an increase in the number of data sets in json format and a reduction in the number of data sets in xml format.
What's next?
After analyzing the data sets, let's see how often they are used - viewed, downloaded. What are the ratings given by users of data sets? What data sets are of interest? How often are the datasets updated? What is the size of the data sets? And is there a relationship between everything?
Source: https://habr.com/ru/post/401371/
All Articles