Pinging IPs as a universal social science tool

No matter what point of view, but the Internet - the physical network of fiber optic cables, connecting together billions of routers, servers and computers around the world - is the most outstanding invention of mankind, which has affected all spheres of human activity: health, politics, lifestyle. The presence of the Internet is positively correlated with a change in the sleep mode of a person and his intimate life .
According to ITU estimates , by the end of 2016, 3.5 billion people (47.1% of the population) or almost 1 billion households were connected to the Network. In four countries of the world, penetration reached a conditional 100% by the number of IP addresses per a household of three people: these are Germany, Denmark, South Korea and Estonia. By the way, in the latter even the president was chosen via the Internet.
')
A group of researchers led by Klaus Ackerman (Klaus Ackermann) from the University of Chicago conducted the first ever large-scale study of the impact of the Internet on human society: from 2006 to 2012, they made more than 1 trillion pings of all IPv4 addresses at intervals of 15 minutes - and correlated data with changes in different socio-economic indicators in 1,647 cities of 122 countries of the world. This study is not some kind of solid description of the pattern of change, but shows curious correlations between the penetration of the Internet and some of the changes that are occurring in society.
The authors of the study emphasize that no technology in the history of mankind has spread so quickly in society. According to their estimates, on average, Internet requires 16.1 years to achieve maximum penetration (approximately 1 IP address per household) in each country. For comparison, other revolutionary technologies in the history of mankind required longer periods of time for this: the steam engine is 100 years old, electricity is about 60.

For sociology, this is truly a unique opportunity. For the first time in history, almost half of humanity is connected to a single general-purpose technology , that is, to a technology that affects the entire economy at once. Half of humanity is connected to a single network and numbered in accordance with the rules of IP-addressing. Moreover, from a scientific point of view, it is important that at any given time it is relatively easy to check the online / offline status for each IP address. Thus, it is possible to make instant "cuts" of the entire Internet entirely.
Researchers from the University of Chicago and Monash University (Australia) have developed a technical platform to monitor the entire range of IP addresses every 15 minutes. During 2006-2012, 1.5 × 10 12 activity checks (offline / online) were made. This information was added to the database along with geolocation information about each IP address.
The status of each IP address was checked by ICMP ping. The physical location of the device was determined by triangulating its latitude and longitude by ping time from different points of the globe. Since the geographical location of the IP address is not constant, every few weeks the triangulation of each address was repeated to update the geolocation database.
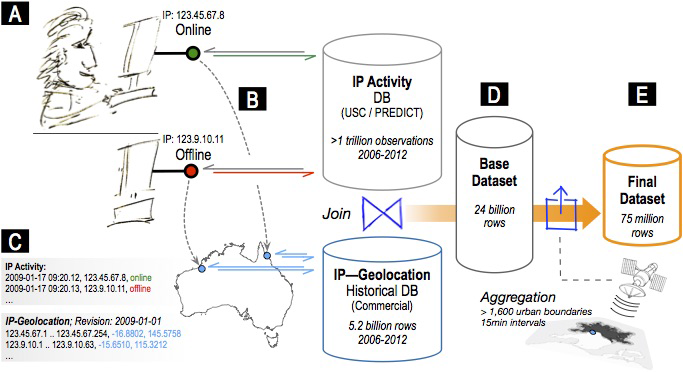
The scientists gathered the collected database of IP-addresses activity with their geographical coordinates with coordinates of 1,647 major cities in 122 countries of the world. Thus, they received long-term statistics of Internet activity in all major cities with 15-minute intervals.
The scientific potential of this database has yet to be discovered by scientists in the future. Surely it is used repeatedly in various studies. In their scientific work, engineers just presented a few examples of how this database can be applied. First, they showed the dynamics of the spread of the Internet itself in each city and each country (as noted above, the average time of maximum saturation with IP addresses is estimated at 16.1 years). Secondly, scientists have tracked changes in the duration of sleep among the population after connecting to the Internet. Third, they examined the correlations between Internet penetration and changes in the region’s economic indicators, including GDP per capita.
Penetration
Scientists have confirmed that the Internet is really distributed in each country in the S-shaped schedule. Slow onset is followed by rapid growth and then slow saturation. Most developed countries, including Russia, Ukraine and Belarus, are in the middle or high stages of the process of saturation with IP addresses.
Exactly according to this S-shaped schedule, other revolutionary technologies were spread among people, which radically advanced the society: steam engines, electricity, personal computers, hybrid corn , etc.
According to researchers, the temporal dynamics of IP-addresses per capita in 1647 cities corresponds to the logistic process, which is described by the formula
Where , and - this is the asymptotic limit, gradient and midpoint, respectively. The EM algorithm processed data from all cities, calculating the maximum likelihood estimate and specifying the expected likelihood at each subsequent iteration. In this way, it was possible to calculate the asymptotic limit, which amounted to 0.32 IP addresses per person, that is, “saturation” with the Internet occurs when approximately one IP address is registered for a three-person household. Time for the passage of the entire path of penetration from the level of 1% to the level of 99% is, on average, 16.1 years.
The table shows the results of the calculation of parameters for the countries for which the study was conducted.

Although many developed countries have already reached the saturation point, some states like Latvia need to wait for the asymptomatic limit for another 13 years. In fact, the schedule of the same Latvia has not even reached the point .
Sleep
Using intraday variations in the status of IP address activity, scientists created a base for estimating bedtime, waking up time and estimating the duration of sleep for residents of 645 cities over a seven-year time interval. This is quite a relevant research direction, because recently the influence of the Internet and gadgets on human behavior and sleep quality (biorhythms, hormonal activity) has been actively studied by researchers.
Scientists have logically assumed that going offline to an internet-connected device may correspond to the time when a person falls asleep. Conversely, the time to connect the device to the Internet at the beginning of the day corresponds to the time when a person wakes up. Using this assumption, for the beginning, the researchers applied a machine learning program to compare the detailed and accurate statistics of the American Time Use Survey (ATUS) with their database. ATUS contains statistics on the sleep time of Americans in 81 major cities with a population of more than 500 thousand people. The comparison showed that the actual statistics of the ATUS sleep time differs from the results of an analysis of the activity of IP addresses by an average of 11 minutes. That is, the information in the database has an acceptable margin of error in order to use the Internet as a global global chronobiological platform. So did the authors work.
It turned out that the sleep patterns in the world are very much statistically different. For example, Mexican people sleep much longer than residents of neighboring US. The same significant difference is observed in residents of neighboring Japan (little sleep) and South Korea (much sleep).
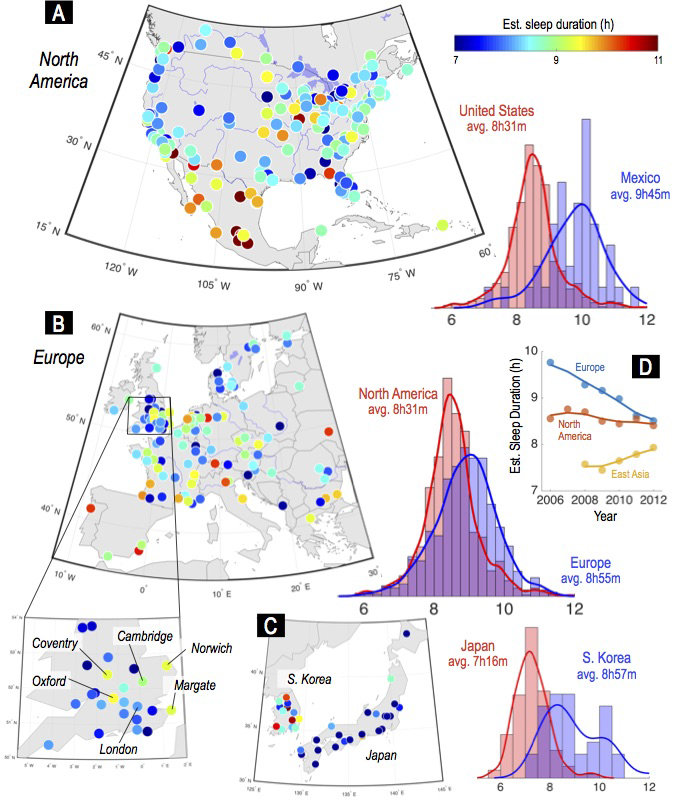
But the most interesting is shown on graph D. Apparently, thanks to the Internet, global convergence of sleep patterns occurs in the world. Regardless of the country, culture and religion, people begin to sleep at about the same amount of time, that is, they unify. The sleep time in Asia is increasing, the sleep time of Europeans is decreasing, and in general, all three curves tend to one common point between 8 and 8.5 hours. The duration of sleep for North Americans throughout the seven years of measurement remained about the same.
Here are data for some other countries.
Ukraine. The average time for a resident to fall asleep is 22.38 (22 h 23 min), waking up - 8.21 (8 h 13 min), sleep duration - 9.83 (9 h 50 min). According to the maximum duration of sleep, the inhabitants of Ukraine are overtaken only by two countries of the world: Spain and Argentina.
Russia. The average sleep time was 22.57 (22 h 34 min), spillage - 7.90 (7 h 54 min), sleep duration - 9.33 (9 h 20 min). Russians sleep about the same as the Greeks, Italians and Portuguese.
Germany. The average time of sleep is 21.86 (21 h 52 min), spillage is 6.94 (6 h 56 min), sleep duration is 9.07 (9 h 4 min).
USA. The average sleep time is 22.11 (22 h 7 min), spillage is 6.62 (6 h 37 min), the duration of sleep is 8.51 (8 h 31 min).
Japan. The average sleep time is 23.06 (23 h 04 min), spillage - 6.33 (6 h 20 min), sleep duration - 7.27 (7 h 16 min). One of the most industrious countries in the world, Japan, has a minimum sleep time.

Scientists note that the analysis of changes in sleep duration is only one parameter in the ATUS database, which can be analyzed using the collected statistics of IP addresses. There are many other parameters that describe the way people live.
Income and labor productivity
Researchers have demonstrated that IP address activity allows forecasting local economic activity in cities, as well as differences in performance across sectors. In this case, data from 411 large regions in countries with medium or high levels of economic development for 2006–2012, including from 71 regions of Russia (for a full list, see the scientific work) were analyzed. It is clear that a simple comparison of economic activity and Internet penetration does not work here. These two processes go at the same time and are accompanied by a number of factors that simultaneously affect both economic activity and the penetration of the Internet. For example, technological development, culture, geography, etc. Instead, scientists compared three specific indicators:
- regional per capita GDP for a particular year;
- GVA (gross value added) - the difference between the cost of goods and services produced (output) and the cost of goods and services fully consumed in the production process - per employee per year by sector of the economy;
- Number of IP addresses per capita.

A clear positive correlation was found between the number of IP addresses per capita and GDP. A simple correlation coefficient without taking into account the region-specific trends and specific differences of a particular year in a particular country and region-specific time trends is 0.38. Taking into account all of the above, the coefficient is reduced to 0.08. This means that a 10% increase in the number of IP addresses corresponds to a 0.8% increase in GDP at the level of a specific city.
It is curious that economic growth due to the spread of the Internet is not evenly distributed across all sectors of the economy. Some industries benefit from it much more than others, and some industries, on the contrary, begin to degrade slightly after the spread of the Internet.
As can be seen in the diagram above, among the winning sectors in labor productivity are real estate, other services, industry, trade, repair, transport and the hotel business.
The productivity of the Internet in the spread of the Internet in such sectors as information and communications, professional, technical and administrative services, public services, education and health care has fallen.
According to the authors, this is the first scientific study of this kind, when the technical information of the Internet is used as a platform for social and economic research. The scientific work was published on January 19, 2017 on the site of preprints arXiv.org (arXiv: 1701.05632).
Source: https://habr.com/ru/post/401359/
All Articles