MTI collected data on lottery spending and poverty in the area, plotting them

It shows the income of various stores in the sale of lottery tickets, the amount of the prize and the number of players who are lucky
The Civic Data Design Lab from the Massachusetts Institute of Technology decided to check in which areas of the city residents spend the most money on lottery tickets. In this case, the authors of the project pursuers aim to link the income level of residents of such regions with spending on lotteries. The project was named " City Digits: Local Lotto ", it was also attended by high school students from a Brooklyn school.
“By participating in the project, high school students were able to use the data they collected to study the impact that the lottery has on their neighbors,” said Sarah Williams, head of the Civic Design Data Lab . “In today's data-driven society, the ability to work with data is an extremely important tool for students when it comes to their career or a field such as social justice . The ability to work with data has become necessary in order to take part in the development of civil policies. ”
Data visualization, surveys of lottery sellers and buyers, and other information collected as part of this project, are now available at the exhibition By the People: Designing a Better America .
')
One of the main objectives of the project is to train high school students in various ways of working with data. Using a variety of sources of such data, students begin to draw conclusions, understanding what factors affect the inhabitants of the areas where they live. Also of interest is the question of the influence of state lotteries on the incomes of New York residents.
The first pilot module of the project was launched in 2013, with 120 students from the Bushwick School for Social Justice taking part in it. As a result of the implementation of this stage, a colorful interactive map was developed, which indicates the level of spending by residents of various regions of the city on lottery tickets.
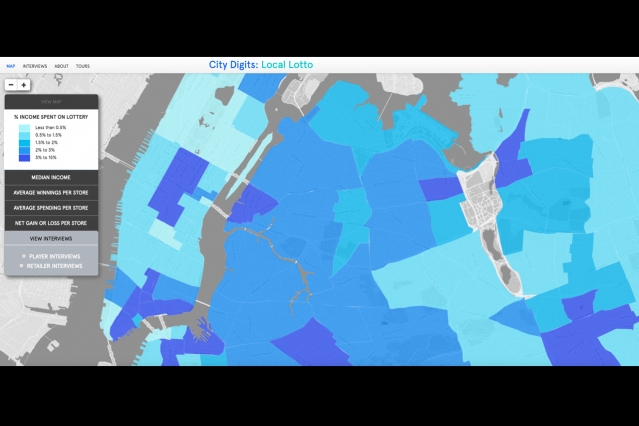
This card shows the percentage of income New Yorkers spend on lotteries.
The card allows you to view various data , including the percentage of household income that goes to the lottery, the average number of winning tickets in relation to the total number of lotteries sold per store, the profit or loss of each store. Depending on the indicators, the card is marked in purple, green, pink and other colors. Research results clearly show that the poorer the region, the more lotteries sold there. The project participants finally concluded that the lottery "is a scam, since the maximum number is sold in regions with low incomes of local residents."
On the map, you can also view the amount of winnings received at any of the city’s shops, as well as the number of lotteries sold. As it turned out, almost any store remains the winner in the sale of lotteries: the amount received from the sale of lottery tickets is always more than the amount paid.
The project taught high school students to think critically, and not only in relation to lotteries. As the participants themselves say, the project sobered them, showing the real scheme of the work of lotteries of different types. “Using information from the real world in the classroom increases the level of students' awareness, teaches them to understand the basic principles of working with information,” says Williams. One thing is purely theoretical calculations and reflection, and quite another is learning based on information gathered in one’s environment.
The map, created during the project, helps students calculate the probability of receiving a jackpot in lotteries. After that, high school students can ask about the results of the game from friends of lottery players, as well as from sellers.
The main thing, according to the authors of the project, is that now students who have not participated in the work can, looking at the map, understand what a lottery is, see the reverse side of the process. Also, high school students quickly begin to understand the value of such a tool as the collection of primary data, their analysis - this is what allowed us to create a detailed and correct map.
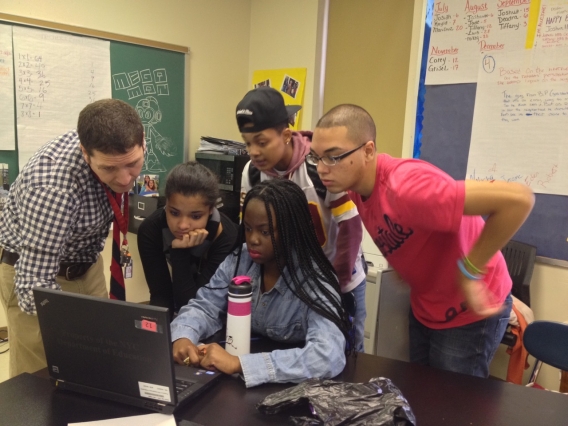
Students of the Bushwick School of Social Justice at work on data
“City Digits: Local Lotto made it possible to achieve several goals at once. During the project, valuable data on the local lottery were collected and analyzed, plus students began to consciously use data processing tools, as well as better understand the principles of social justice, ”said Williams.
Source: https://habr.com/ru/post/401029/
All Articles