The beauty of the rendering of game frames: A brief overview of the tools + Interesting video
Inquisitiveness of the mind and the desire to know how everything works from the inside distinguishes the technician from the mass of users. In this small post I would like to share with the inquisitive community small videos and a brief recipe for using profiling software for 3D applications.
Watch the video, and then read
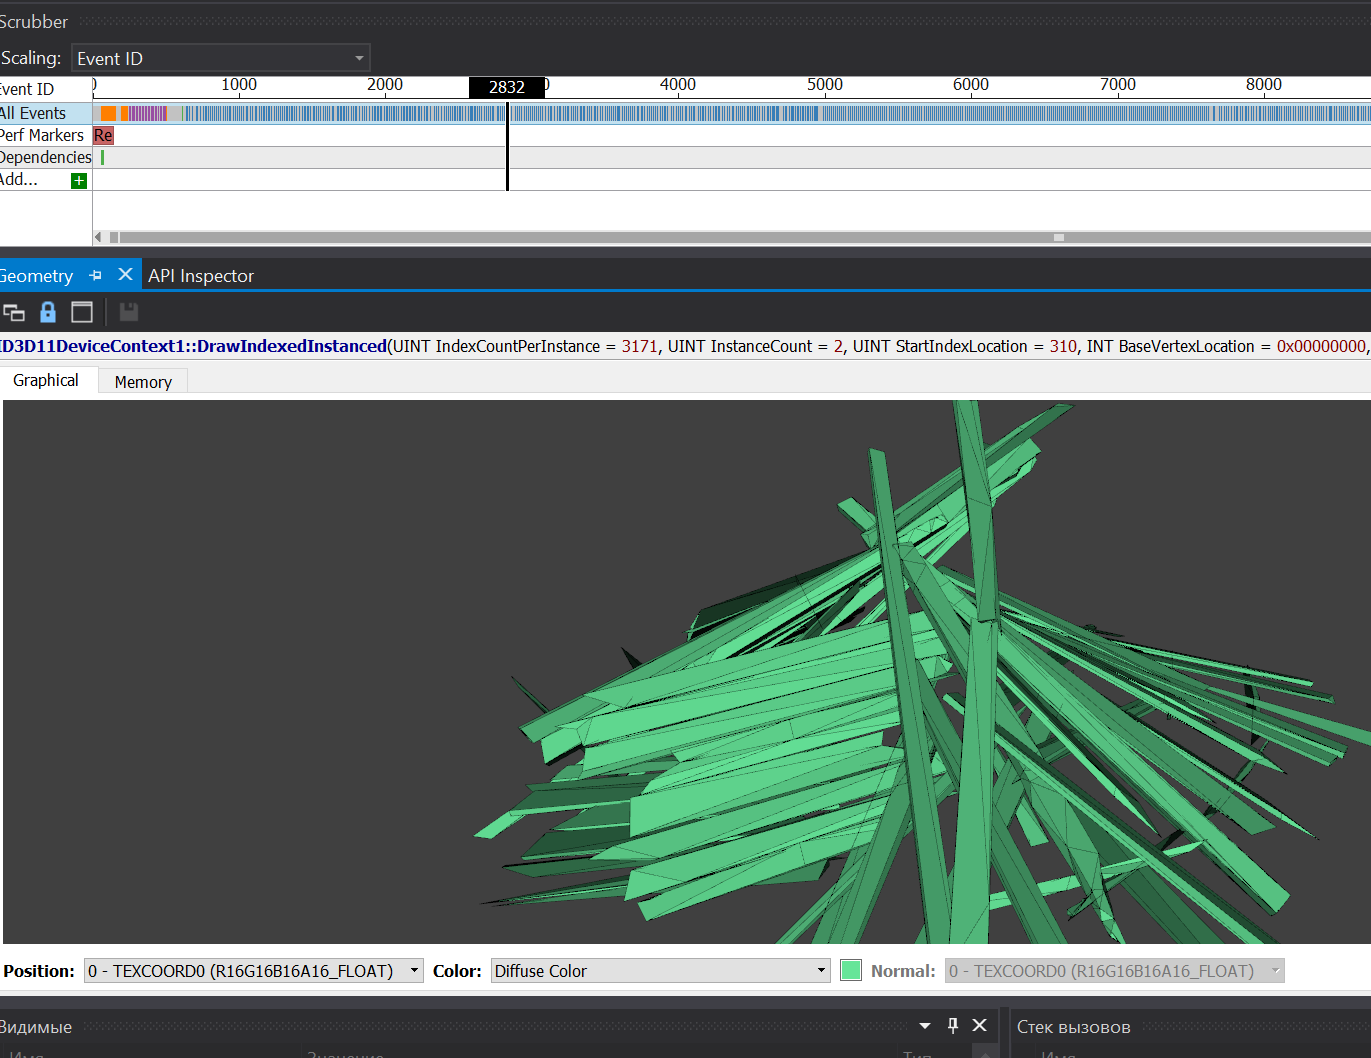
So, if we want to evaluate how the game frame is being prepared. What geometry, textures, how many calls to draw, where there is a drawdown in performance? You can use specialized software to debug these processes.
I will list the main ones:
')
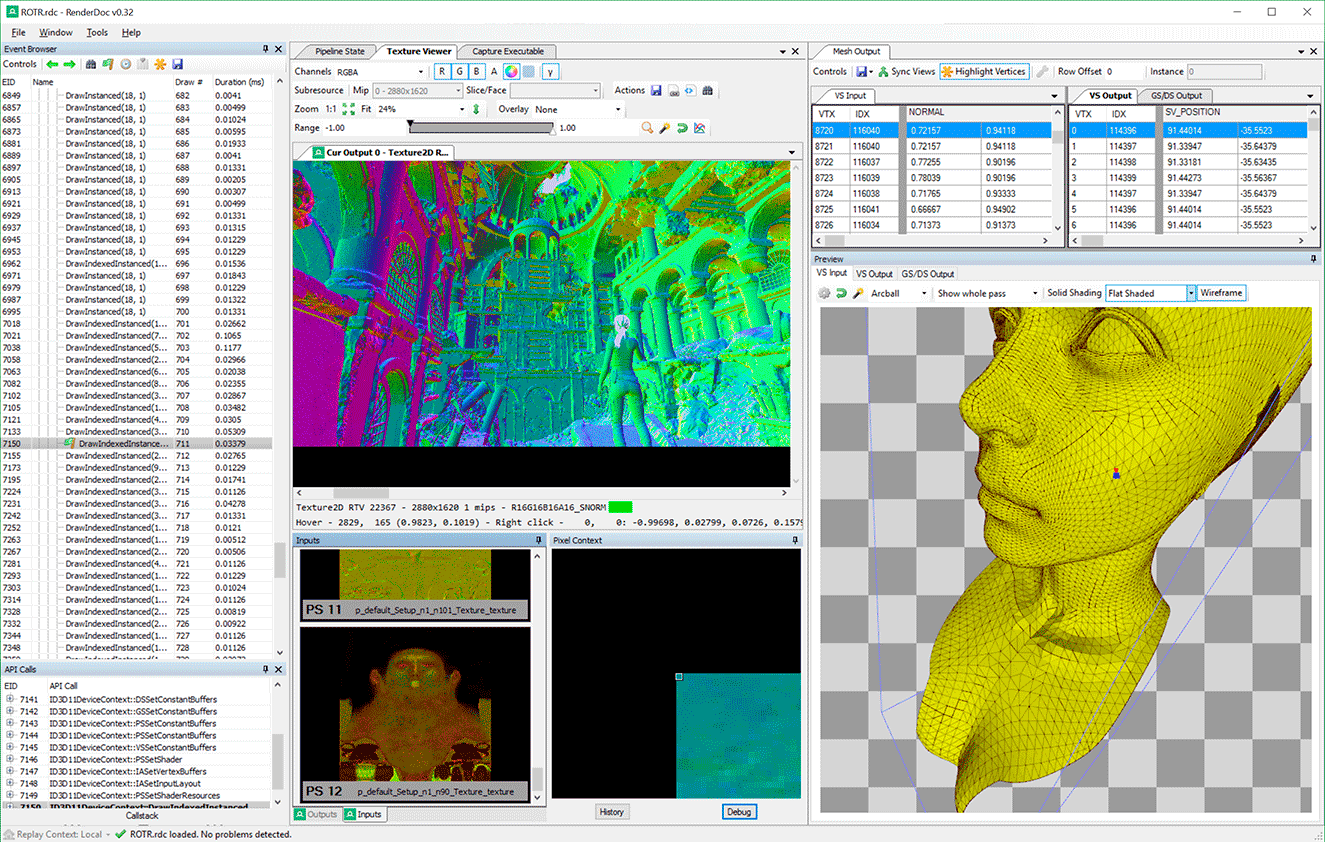
(In the screenshot of the bust of Lara Croft from the last part: Rise of the Tomb Rider)
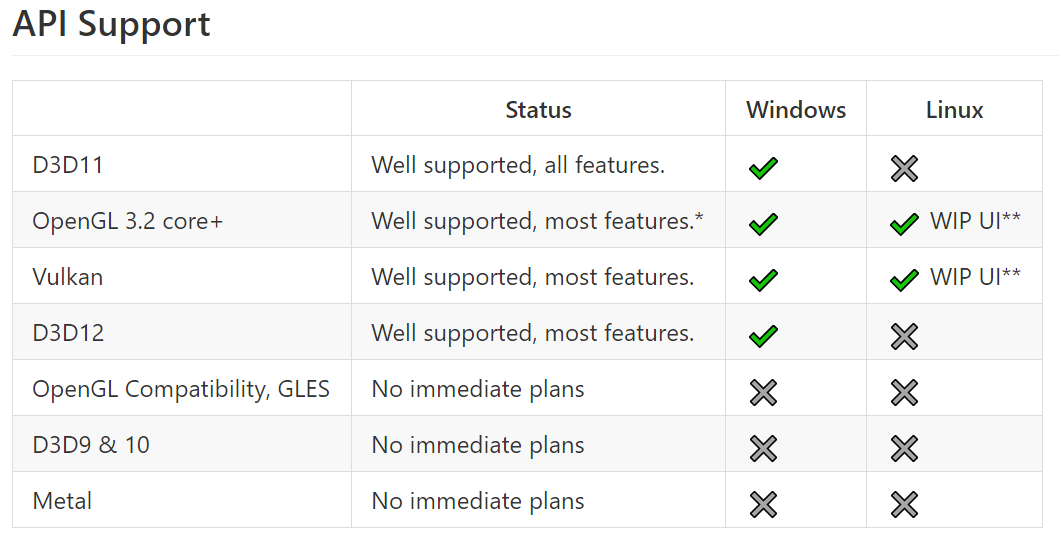
Support DirectX 11/12, Vulkan, OpenGL 3.2+
This opensource project. Regularly supported by fresh commits.
→ Link to repository and documentation
The interface is quite flexible and intuitive. It will not be difficult for an inquiring soul to figure out in 5 minutes how to launch any game or application and walk through the entire rendering process. Third-party applications do not need to start.
Specify the path to the exe, additional parameters and run. Further in the application at the right time, press F12 or PrintScrn, RenderDoc saves a frame that can be saved, and return to it even without starting the game or share it with a partner.
Also, for example, you can export geometry and textures.

A great and very powerful debugger tool. This is not the only tool in the Nvidia arsenal. There are tools for mobile applications, Linux, Mac devices and so on. In all their diversity, I did not understand. Nsight assumes sharing with Visual Studio, but for a quick start you can try without an installed IDE from Microsoft.
We register for free at the Nvidia Developer Program and calmly download the necessary tools. The Nvidia website has documentation and explanatory videos on the use of tools.
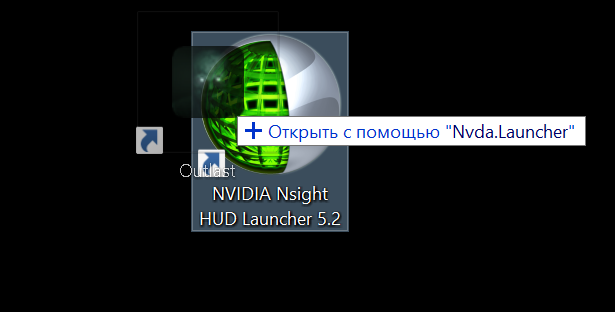
To launch, just drag the application shortcut to the Nvidia Nsight shortcut. And if everything is correct, you will see the HUDs and graphics from Nsight.
The frame is made simply: press CTRL + Z, then press the space bar or the button with the magnifying glass icon. The process stops and the Nsight Replay window opens, at the bottom of which there is a timeline with a slider. Nsight has hints and the interface is quite simple. It is also possible to save all frame rendering to a file, but to open it you will still have to install Visual Studio.
To get deeper into the process, it is necessary to make all the manipulations from VS. Either run a 3D application from VS, or launch a saved frame (function of saving access and without VS installed)
Create an empty project:
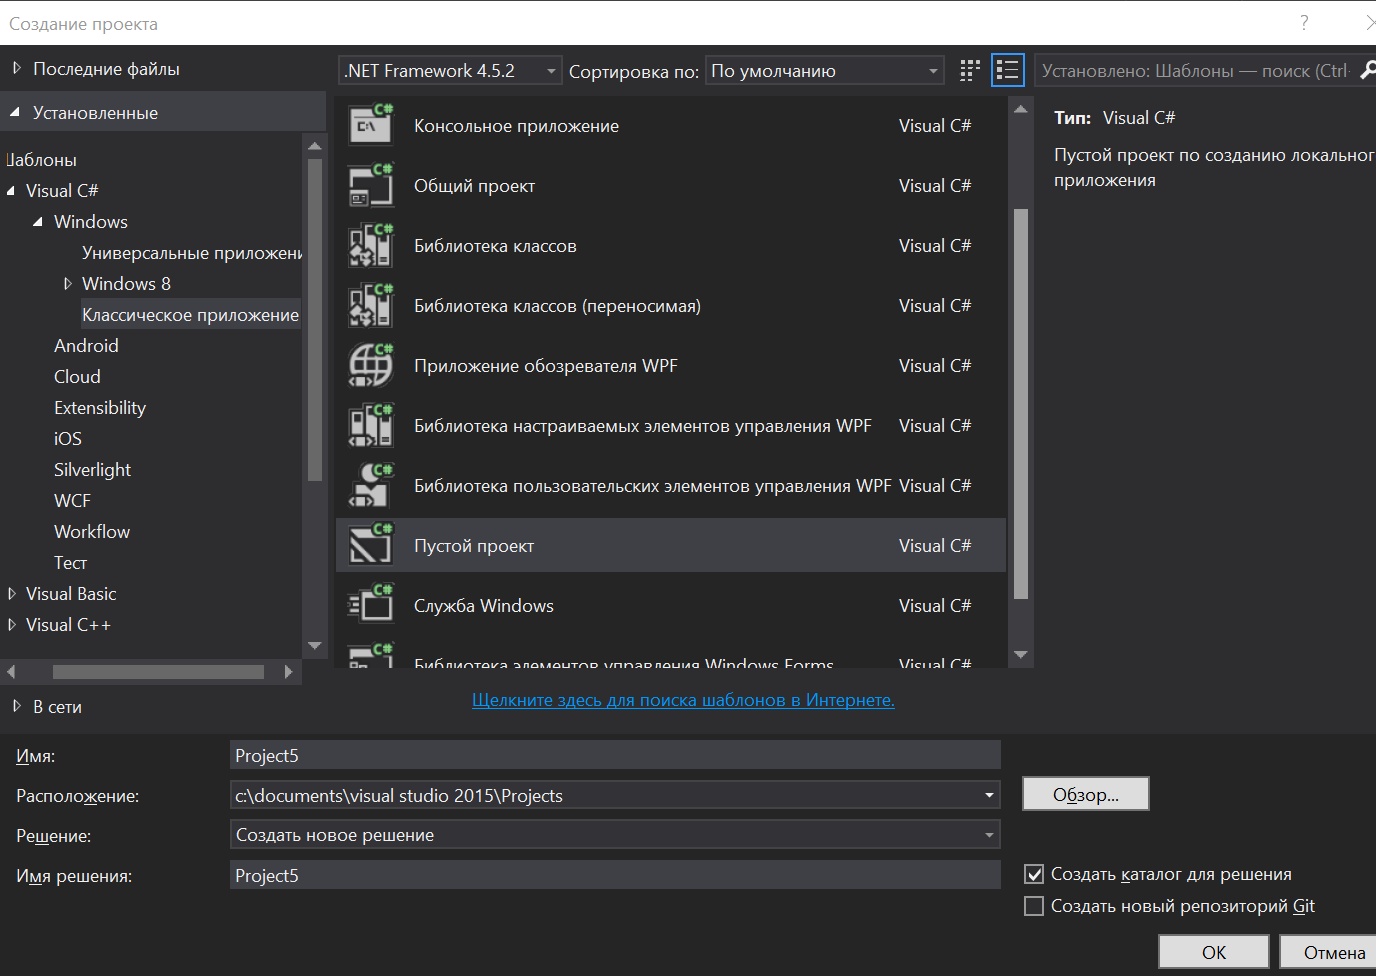
Let's find such a button in which we will enter the path to the application and some necessary settings.

And after that we start debugging. The application opens. If you use a loader, you may have to simply select the desired process in the window.

The process is the same as I described above. But now VS opens up additional debugging features, which are not available when debugging without VS. And geometry and textures, and shaders. You can analyze the processes from different angles.
Nsight also has a useful killer feature: you can start the application with the server on the selected machine, and from VS connect to it. So everyone does not need to deploy the same environment with the application, which simplifies the life of the developer or the development team.
To work with saved frames, just open the saved project for your version of Visual Studio, compile the release build and enable Nsight debugging. Further, all as described above.
By the way. Could you figure out if you could look at the entire geometry of the run in Nsight, as is done in RenderDoc? Very handy when displaying a specific draw call with grids from previous calls.
Plus, I could not verify the operation of the software on the AMD video card, for lack of the latter. But it seems that Nvidia has no strict requirements on this issue.
Excellent and powerful tool. It also has the ability to remotely debug.
→ Link to download and document

The use is simple. There are 2 server versions (64 and 32 bits) to launch, simply drag the required application to the server. What he will ask when you try to start it.

Next, just turn on the client. We connect to the server, at the right moment we pause and now we can do all that we did before in RenderDoc or Nvidia Nsight.
Broad support for various APIs and devices. Despite its origin, it supports my Nvidia video card. So no conspiracies and poles in the wheels ...
UPD In the comments suggested another open source tool.
apitrace
Multiplatform and supporting various APIs. I have not yet felt it, but according to lieff is a useful and simple tool.


Which tool is the best of them, I can not say. Everyone has some mini features, tables, graphics, which may contain information that is very necessary in a specific task. On the user side, a curious person, I somehow more “worked out” with RenderDoc. But sometimes not all processes can be started in it.
And by the way about running processes. Everything is very easy and simple when you have application A and tool B. Then tool B launches application A and everyone is happy. But if there are intermediaries in this scheme: launchers, anti-cheat software and other wrappers, then you have to “dance a little”.
Consider the example of starting the game from Steam or Origin and other services.
In this case, you need to follow a specific procedure in any toolkit:
Promised videos for a snack. I record a sort of time-lapse video of the process of drawing the frame of the game. I find it very entertaining, informative and beautiful. Not all events are displayed on the video, because in that case it would be too twitched.
Pub
Battlefield 1
GTA V
Rise of Tomb Rider
Witcher 3
Watch Dogs 2
Fallout 4
About draw calls
And that's all. I hope this material will impress, suggest, help or even have a positive effect on the reader. Edit, advice, thanks and kicks send to the LAN or comments.
And lastly, I would like to add some Youtube channel: www.youtube.com/KakoytoItIshnik
This is, of course, a bad tone for Giktaims, but all these social things: subscriptions, likes and comments, increase the motivation to release new and better content.
Disclaimer
I am not a 3D developer, I do not develop engines, games and do not model. This is just a hobby. I have always had a great interest in 3D. And I learn everything gradually and independently. If the text will (and they will be) some technical inaccuracies - write in the LAN or comments. I will correct everything and always do not mind hapanut feedback to enhance the experience.
Immediately I apologize if I posted this article in the wrong hub. Most likely I did.
But in my opinion such material is not powerful enough to go to the “Development” or “Debug” section.
Immediately I apologize if I posted this article in the wrong hub. Most likely I did.
But in my opinion such material is not powerful enough to go to the “Development” or “Debug” section.
Watch the video, and then read
So, if we want to evaluate how the game frame is being prepared. What geometry, textures, how many calls to draw, where there is a drawdown in performance? You can use specialized software to debug these processes.
I will list the main ones:
')
- RenderDoc
- Nvidia nsight
- GPUperfStudio
RenderDoc is a graphical debugger from Crytek.
(In the screenshot of the bust of Lara Croft from the last part: Rise of the Tomb Rider)
Support DirectX 11/12, Vulkan, OpenGL 3.2+
This opensource project. Regularly supported by fresh commits.
→ Link to repository and documentation
The interface is quite flexible and intuitive. It will not be difficult for an inquiring soul to figure out in 5 minutes how to launch any game or application and walk through the entire rendering process. Third-party applications do not need to start.
Specify the path to the exe, additional parameters and run. Further in the application at the right time, press F12 or PrintScrn, RenderDoc saves a frame that can be saved, and return to it even without starting the game or share it with a partner.
Also, for example, you can export geometry and textures.
Nvidia Nsight is NVIDIA's debugging tool.
A great and very powerful debugger tool. This is not the only tool in the Nvidia arsenal. There are tools for mobile applications, Linux, Mac devices and so on. In all their diversity, I did not understand. Nsight assumes sharing with Visual Studio, but for a quick start you can try without an installed IDE from Microsoft.
We register for free at the Nvidia Developer Program and calmly download the necessary tools. The Nvidia website has documentation and explanatory videos on the use of tools.
To launch, just drag the application shortcut to the Nvidia Nsight shortcut. And if everything is correct, you will see the HUDs and graphics from Nsight.
The frame is made simply: press CTRL + Z, then press the space bar or the button with the magnifying glass icon. The process stops and the Nsight Replay window opens, at the bottom of which there is a timeline with a slider. Nsight has hints and the interface is quite simple. It is also possible to save all frame rendering to a file, but to open it you will still have to install Visual Studio.
To get deeper into the process, it is necessary to make all the manipulations from VS. Either run a 3D application from VS, or launch a saved frame (function of saving access and without VS installed)
Create an empty project:
Let's find such a button in which we will enter the path to the application and some necessary settings.
And after that we start debugging. The application opens. If you use a loader, you may have to simply select the desired process in the window.
The process is the same as I described above. But now VS opens up additional debugging features, which are not available when debugging without VS. And geometry and textures, and shaders. You can analyze the processes from different angles.
Nsight also has a useful killer feature: you can start the application with the server on the selected machine, and from VS connect to it. So everyone does not need to deploy the same environment with the application, which simplifies the life of the developer or the development team.
To work with saved frames, just open the saved project for your version of Visual Studio, compile the release build and enable Nsight debugging. Further, all as described above.
By the way. Could you figure out if you could look at the entire geometry of the run in Nsight, as is done in RenderDoc? Very handy when displaying a specific draw call with grids from previous calls.
Plus, I could not verify the operation of the software on the AMD video card, for lack of the latter. But it seems that Nvidia has no strict requirements on this issue.
PerfStudio GPU - Advanced Micro Devices (AMD) development
Excellent and powerful tool. It also has the ability to remotely debug.
→ Link to download and document
The use is simple. There are 2 server versions (64 and 32 bits) to launch, simply drag the required application to the server. What he will ask when you try to start it.
Next, just turn on the client. We connect to the server, at the right moment we pause and now we can do all that we did before in RenderDoc or Nvidia Nsight.
Broad support for various APIs and devices. Despite its origin, it supports my Nvidia video card. So no conspiracies and poles in the wheels ...
UPD In the comments suggested another open source tool.
apitrace
Multiplatform and supporting various APIs. I have not yet felt it, but according to lieff is a useful and simple tool.
Which tool is the best of them, I can not say. Everyone has some mini features, tables, graphics, which may contain information that is very necessary in a specific task. On the user side, a curious person, I somehow more “worked out” with RenderDoc. But sometimes not all processes can be started in it.
And by the way about running processes. Everything is very easy and simple when you have application A and tool B. Then tool B launches application A and everyone is happy. But if there are intermediaries in this scheme: launchers, anti-cheat software and other wrappers, then you have to “dance a little”.
Consider the example of starting the game from Steam or Origin and other services.
In this case, you need to follow a specific procedure in any toolkit:
- Disable all kinds of overlays In-Game features on Steam, Origin, Uplay, and so on.
- These applications must be turned off before running.
- You need to run not a game file, but a wrapper (Steam, Origin, Uplay, etc.)
- After that, you can run the game directly from the launched "wrapper"
- Often, additional startup options are needed. For example, for Watch Dogs 2, the -eac_launcher parameter would disable anti-cheat. Here you need to read readme, configs for a hint. Plus, additional parameters help speed up the application launch process. Example for Steam: -applaunch 99999 (application id)
- Always check the version of the API in the application. It is possible that DX12 is turned on in the settings, but it is not supported by you, and so on. Do presets, close the game, and only then start debugging.
- Some applications are not stable on multi-graphics systems (for example: embedded video + discrete card). Disable excess in Device Manager. Plus, in this case, it is better to debug a snapshot of the frame, and not a running game. Since You are tortured to restart when collapses.
Promised videos for a snack. I record a sort of time-lapse video of the process of drawing the frame of the game. I find it very entertaining, informative and beautiful. Not all events are displayed on the video, because in that case it would be too twitched.
Pub
Battlefield 1
GTA V
Rise of Tomb Rider
Witcher 3
Watch Dogs 2
Fallout 4
About draw calls
And that's all. I hope this material will impress, suggest, help or even have a positive effect on the reader. Edit, advice, thanks and kicks send to the LAN or comments.
And lastly, I would like to add some Youtube channel: www.youtube.com/KakoytoItIshnik
This is, of course, a bad tone for Giktaims, but all these social things: subscriptions, likes and comments, increase the motivation to release new and better content.
Source: https://habr.com/ru/post/400963/
All Articles