Himself a weatherman
 I think many people have felt the vicissitudes of the weather this winter, which beats all sorts of records. Greece was covered with snow, and many Russian cities were in general overwhelmed with them, public utilities were furious, scientists were surprised. Proponents of conspiracy theories claim that the weather anomalies are an action of mysterious climate weapons that can change the climate on the Planet anywhere in the world through electromagnetic effects and even determined that such an impact comes from the HAARP station in Alaska. But this is only a theory. In practice, the control of the climate for humanity is likely not available. It is possible only to observe and predict. Today I want to talk about an interesting project of a climate GIS system implemented by a group of enthusiasts from different countries who are building this system using the most advanced information technologies, and the source code of the project is available to everyone absolutely free.
Beware, many beautiful, but heavy princely!
What kind of project?
It's about the Earth project. Not to be confused with Google Earth. The project is a visualization of global weather conditions, predicted using supercomputers, updated every three hours. Data for the operation of supercomputers comes from thousands of meteorological observation stations, space satellites, environmental monitoring stations from around the world. Data visualization is possible from 9 projections. The dynamics of changes in air flow, sea and ocean currents, fronts, etc. can be observed almost in real time.

')
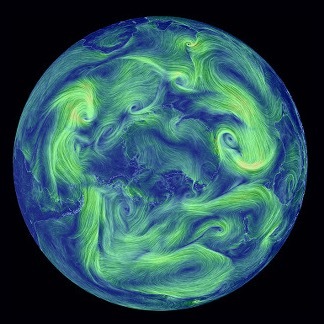
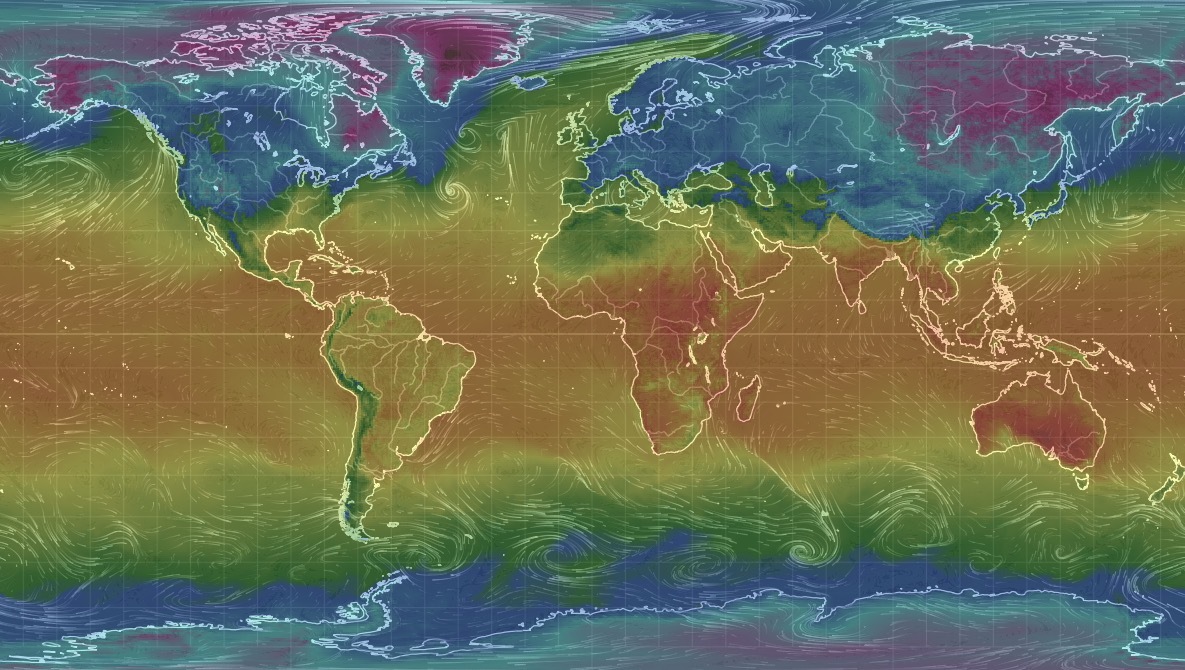
These are examples of visualization in some projections. And this is what the Planet looks like in temperatures.
And so in the fields of humidity.
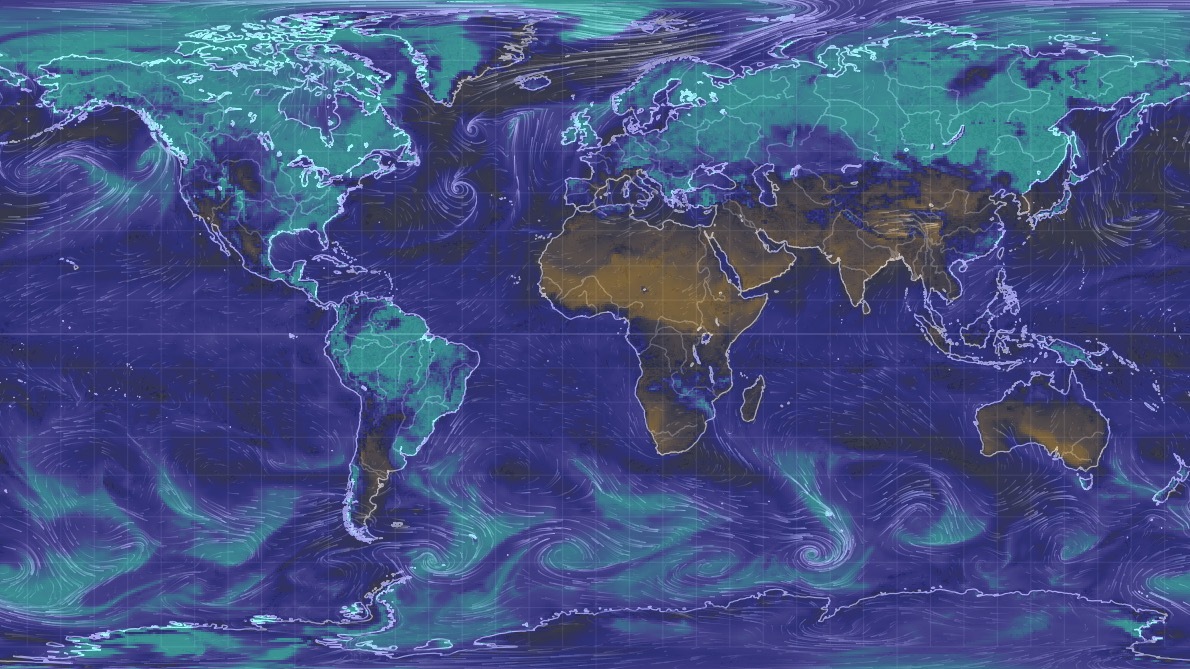
So do the currents

And a lot of other visualizations. Dozens!

Who works on the planet?
Given that the activity of industrial production is associated with emissions of industrial gases, such CO, extra over background CO2, etc., we will look at the situation on the planet for these gases.
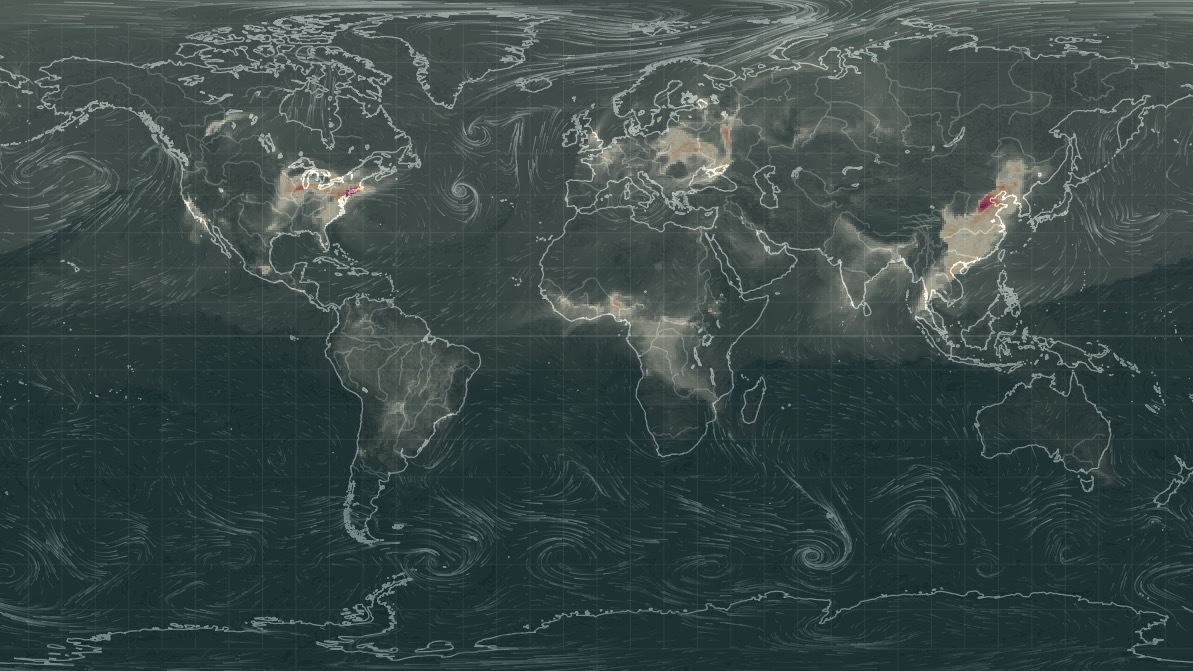
Injects China, India, the United States, in Europe, too, are doing something. True, it is not clear a significant excess of polluting gases in equatorial Africa. But in Australia, quiet and grace!
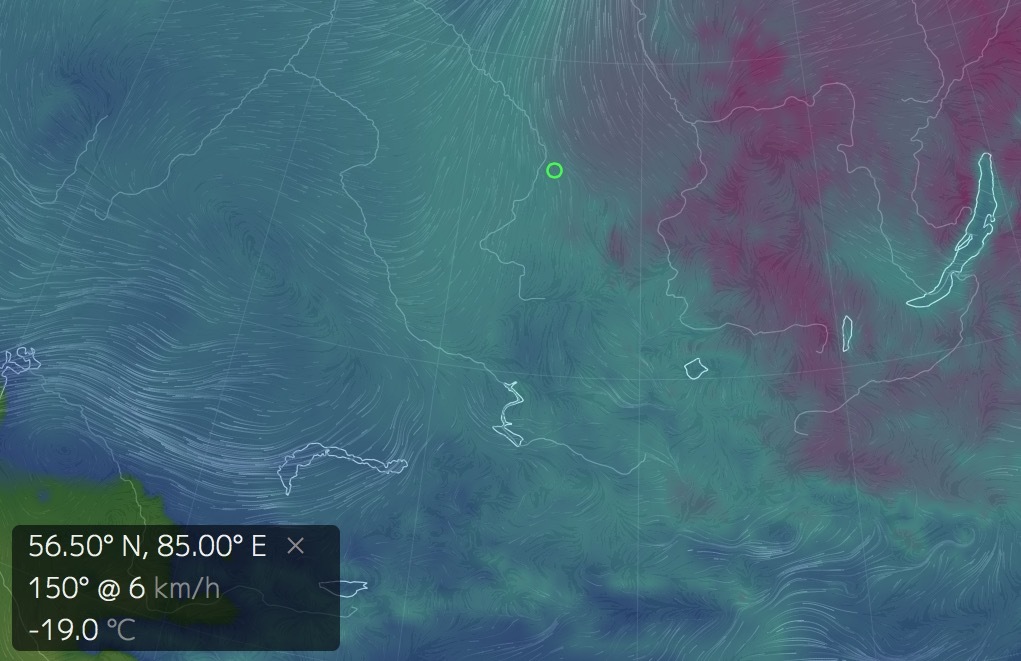
Of course, GIS can be scaled and viewed at a specific point on the planet. True, I did not find a place where you can clearly indicate the coordinate on the planet - the system offers me to enable geolocation. However, I do it easier. I manually specify the coordinate at the end of the link and paste it into the browser. So, for example, a link to the city of Tomsk (where I live) will look like with coordinates 85.0, 56.5 and a GIS answer to this link . Look at its structure and everything will become clear.
For Moscow, the link will be like this - at the end we will put the coordinates 55.75 and 37.62. This is the GIS answer in terms of temperature and wind speed. As of 15-00 Moscow time on January 17th.
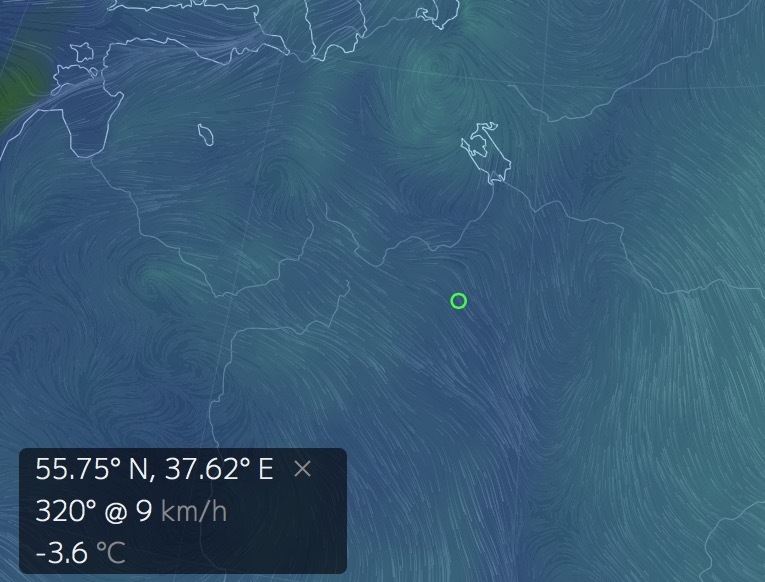
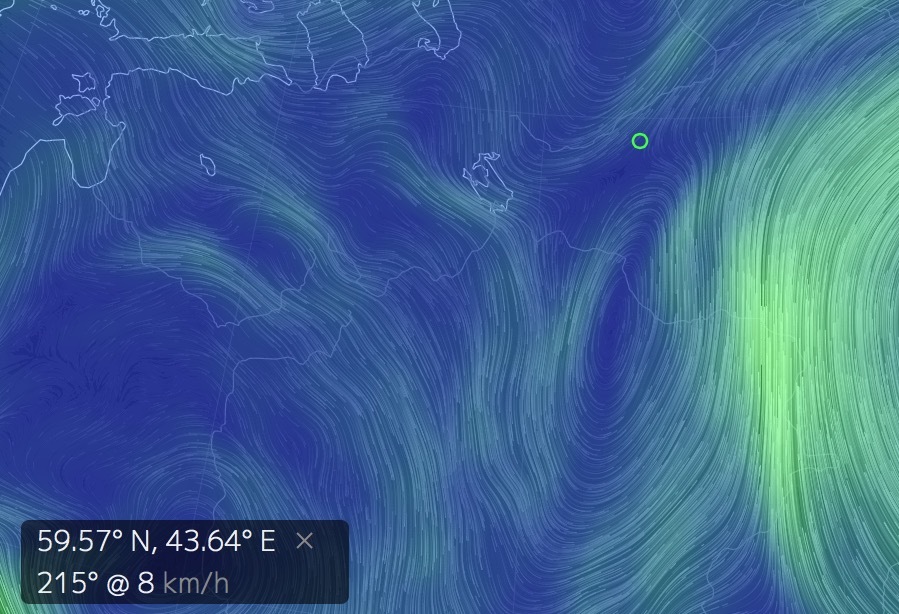
It seems everything is calm. But at an altitude of 500 meters the breeze is already decent! From the southeast, the edge of the cyclone is visible. The weather will change.
Of course, this system will be of interest to specialized specialists in the field of climate research and meteorologists. Although the authors of the project position the system as informational and intended solely for research and the work of programmers, I had a good time studying this project. The technologies that it uses are listed here , the project is hosted on Github . Now, listening to the weather on the radio, I definitely look into this system and, through captivity, I make myself a synoptic)
Have a nice day!
Source: https://habr.com/ru/post/400807/
All Articles