Ratio of real temperature and forecast Yandex. Weather
In the morning, when I have breakfast, I look at Yandex.Pogoda almost every day, and I periodically have a feeling of deja vu, but only vice versa. You look - one temperature for the weekend is indicated, and the next day you look - already our other temperature indicators are promised. Slowly you begin to doubt your memory (30 years old - this is already the fourth decade started). But in order not to be completely discouraged - I decided to check how the forecast correlates with the actual temperature.
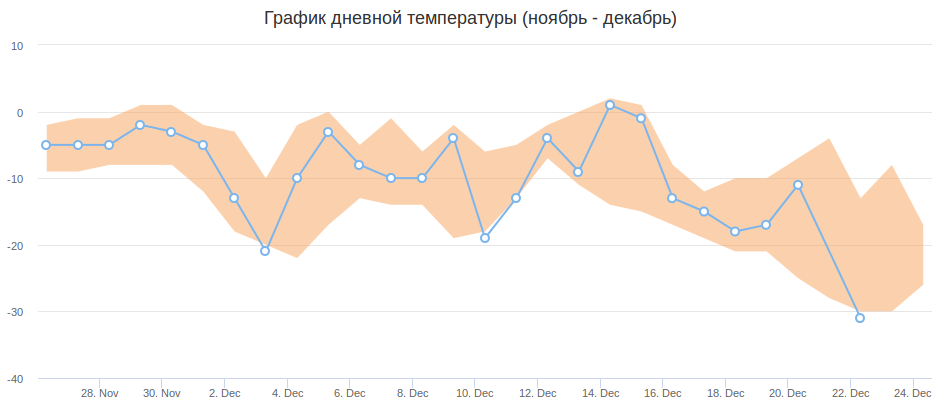
The blue line is the real temperature. The orange area is a range of predictions.
Some technical details
First of all, I put a script in cron, which every hour saves the Yandex.Pogoda page as an html file and left it to work for a while.
curl https://yandex.ru/pogoda/novosibirsk > test/`date +%Y-%m-%d-%H-%M` The next step was to write a small php script , striking in its simplicity and conciseness, for parsing the saved files and generating json files, which, in turn, are used to display graphs. An example of processing a saved day:
function parseFile($day) { global $mega, $csv, $realT; $predicts = []; $html = file_get_html(__DIR__ . '/test/' . $day); foreach($html->find('.forecast-brief_cols_10') as $element) { foreach ($element->find('.forecast-brief__item-temp-day') as $s) { $predicts[] = str_replace('−', '-', $s->plaintext); } } $dayDate = date_create_from_format("YmdHi", $day); $dayDateString = date_format($dayDate, 'Ymd H:i:s'); $dayArr = explode('-', $day); if ($dayArr[3] == 14) { foreach($html->find('.current-weather__thermometer_type_now') as $s) { $realT[] = [ intval(date_format($dayDate, 'U') . '000'), intval(str_replace('−', '-', $s->plaintext)) ]; } } for ($i = 1; $i < count($predicts); $i++) { $nextDay = date('Ym-d', strtotime('+' . $i . ' day', strtotime($dayDateString))); $nextDayArr = explode('-', $nextDay); $line = [ 'Y' => $dayArr[0], 'm' => $dayArr[1], 'd' => $dayArr[2], 'H' => $dayArr[3], 'i' => $dayArr[4], '_m' => $nextDayArr[1], '_d' => $nextDayArr[2], '_C' => $predicts[$i] ]; $mega[] = $line; $csv .= join(';', array_values($line)) . "\n"; } } For clarity
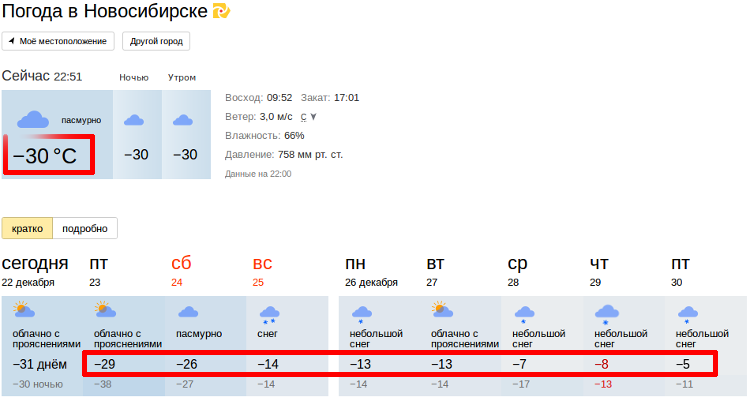
- I considered the forecast to be daytime temperatures of the day, not shown for the current day (in the picture below, a long, highlighted rectangle);
- I took the real temperature from the upper selected rectangle at 14:25
You could see the result at the beginning of the article, where the real temperature tries to creep through the range of predictions, but that it does not always succeed. See more and poke on different dates here .
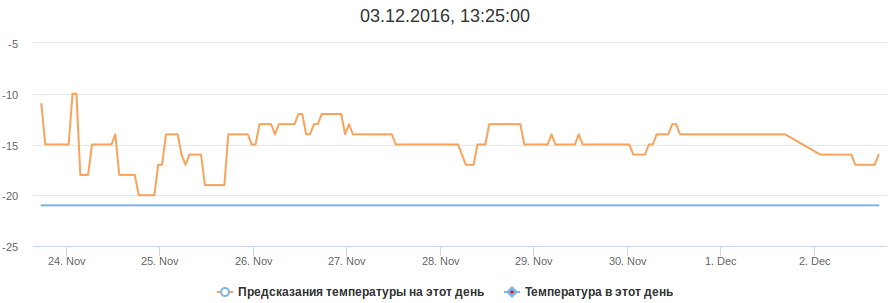
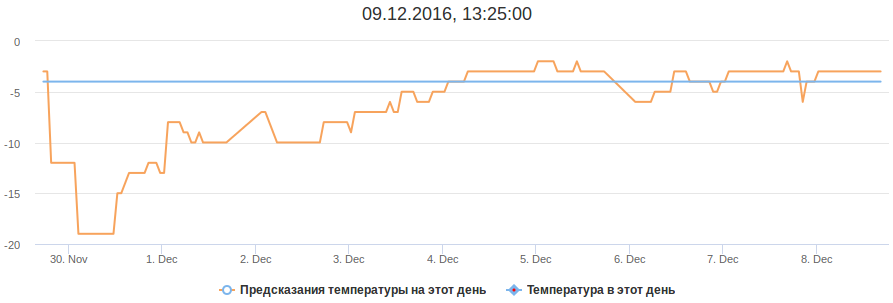
Examples of temperature prediction graphs for a particular day:
Conclusion
My memory is fine, you can not worry.
')
Source: https://habr.com/ru/post/400245/
All Articles