The main parameters of amplifiers low frequency and acoustics. What you need to know in order not to fall for marketers

Thanks to retail chains and online stores, the variety of audio equipment offered for sale goes beyond all reasonable limits. How to choose the device that meets your needs for quality, without significantly overpaying?
If you are not an audiophile and the selection of equipment is not your life's purpose, then the easiest way is to confidently navigate the technical characteristics of sound amplifying equipment and learn to extract useful information between the lines of passports and instructions, critical of generous promises. If you do not feel the difference between dB and dBm, you do not distinguish the rated power from PMPO and you want to finally know what THD is, you can also find interesting under the cut.
')
Loudness sound. What is the difference between dB and dBm?
Divide and conquer - we spread the signal into the spectrum.
Linear distortion and bandwidth.
Nonlinear distortion. CED, KGI, THD.
Amplitude response. Very briefly on noise and interference.
ULF output power and acoustics standards.
Practice is the best criterion of truth. Disassembly with audio center.
Kettle tar in a jar of honey.
I hope that the materials of this article will be useful for understanding the next one, which has a much more complicated topic - “Cross-distortions and feedback, as one of their sources”.
Gain. Why do we need logarithms and what are decibels?
One of the main parameters of the amplifier is the gain - the ratio of the output parameter of the amplifier to the input. Depending on the functional purpose of the amplifier, voltage, current or power gains are distinguished:
Voltage gain
Current gain
Power gain
The ULF gain can be very large, the amplification of operational amplifiers and radio channels of various equipment is expressed by even larger values. Figures with a large number of zeros are not very convenient to operate, it is even more difficult to display on the chart various types of dependencies that have values that differ a thousand times or more. A convenient way out is to represent quantities on a logarithmic scale. In acoustics, this is doubly convenient, since the ear has a sensitivity close to the logarithmic one.
Therefore, the gain is often expressed in logarithmic units - decibels (Russian designation: dB; international: dB)
Initially, dB was used to estimate the power ratio, so the value expressed in dB assumes the logarithm of the ratio of the two powers, and the gain in power is calculated using the formula:
The situation with “non-energy” quantities is a bit different. For example, take the current and express power through it, using Ohm's law:
then the value expressed in decibels through the current will be equal to the following expression:
Similarly for voltage. As a result, we obtain the following formulas for calculating the gain factors:
Current Gain in dB:
Voltage Gain in dB:
Loudness sound. What is the difference between dB and dBm?
 In acoustics, the “intensity level”
 Where not the current, but the intensity of the sound pressure of a sound with a frequency of 1 kHz, which approximately corresponds to the human hearing threshold of sound.
Thus, when it is said that the sound volume is 20 dB, this means that the intensity of the sound wave is 100 times higher than the human hearing threshold.
In addition, in radio engineering, the absolute magnitude of power measurement dBm (Russian dBm), which is measured relative to a power of 1 mW, is extremely common. Power is determined at the nominal load (for professional equipment - usually 10 kΩ for frequencies less than 10 MHz, for radio frequency technology - 50 Ohms or 75 Ohms). For example, “the output power of the amplifier stage is 13 dBm” (that is, the power released at the nominal load for this amplifier stage is approximately 20 mW).
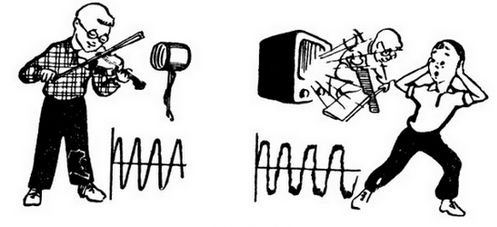
Divide and conquer - we spread the signal into the spectrum.
 It is time to move to a more complex topic - the assessment of signal distortion. First you have to do a little intro and talk about the spectra. The fact is that in audio engineering
 Any sinusoidal oscillation can be described by the formula:
Where vector length, amplitude of oscillation,
- the initial angle (phase) of the vector at time zero,
- angular velocity, which is equal to:
It is important that using the sum of sinusoidal signals with different amplitudes, frequencies and phases, one can describe periodically repeating signals of any shape. Signals whose frequencies differ from the main one an integer number of times are called harmonics of the original frequency. For a signal with a base frequency f, signals with frequencies
will be even harmonics and signals
odd harmonics
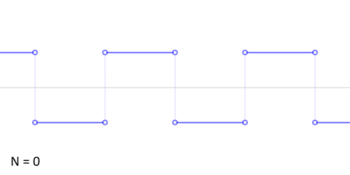
Let us, for clarity, draw a graph of the sawtooth signal.
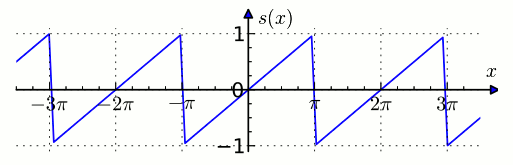
For an exact representation of it through harmonics, an infinite number of members is required. In practice, a limited number of harmonics with the highest amplitude are used to analyze the signals. Visually see the process of building a sawtooth signal from the harmonics in the figure below.
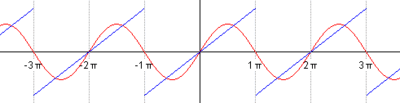
And here is how the meander is formed, with an accuracy of the fiftieth harmonic ...
You can read more about harmonics in the wonderful article by user dlinyj , and it's time for us to finally move on to distortions.
The simplest method for estimating signal distortion is to apply one or a sum of several harmonic signals to the amplifier input and analyze the observed harmonic signals at the output.
If the amplifier output signals are the same harmonics as the input, the distortion is considered linear, because they are reduced to a change in amplitude and phase of the input signal.
Nonlinear distortions add new harmonics to the signal, which distorts the shape of the input signals.
Linear distortion and bandwidth.
The gain K of an ideal amplifier does not depend on the frequency, but in real life this is far from the case. The dependence of the amplitude on the frequency is called the amplitude-frequency characteristic - the frequency response and is often depicted as a graph, where the voltage gain is plotted vertically, and the frequency horizontally. Draw on the frequency response graph of a typical amplifier.
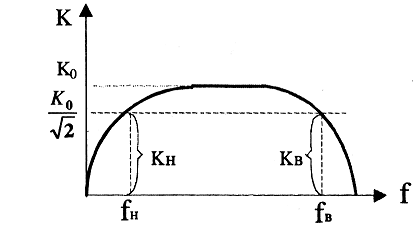
They remove the frequency response, sequentially applying to the input of the amplifier signals of different frequencies of a certain level and measuring the signal level at the output.
The frequency range ΔF , within which the power of the amplifier decreases no more than twice the maximum value, is called the bandwidth of the amplifier .
However, on the graph, the gain is usually plotted in terms of voltage, not power . If we denote the maximum voltage gain, as then within the passband the coefficient should not fall lower than:
The values of the frequency and level of the signals with which the ULF operates can vary greatly, therefore, the frequency response is usually built in logarithmic coordinates, sometimes called LAFC.
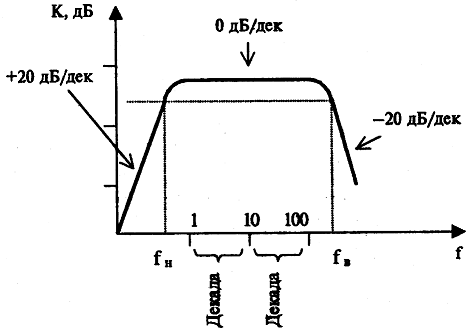
The gain of the amplifier is expressed in decibels, and on the abscissa axis, the frequencies are laid off after a decade (the interval of frequencies that differ tenfold). Isn’t it so true that the schedule looks not only prettier, but also more informative?
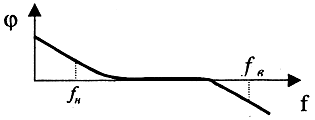
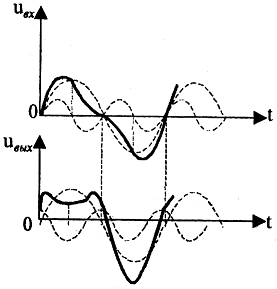
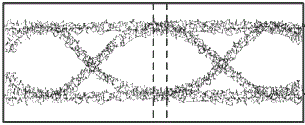
The amplifier not only unevenly amplifies signals of different frequencies, but also shifts the phase of the signal by different values, depending on its frequency. This dependence reflects the phase characteristic of the amplifier.
When amplifying oscillations of only one frequency, it seems to be not terrible, but for more complex signals it leads to significant shape distortions, although it does not generate new harmonics. The picture below shows how the two-frequency signal is distorted.
Nonlinear distortion. CED, KGI, THD.
Nonlinear distortions add previously non-existent harmonics to the signal and, as a result, change the original waveform. Perhaps the most graphic example of such distortion can be the limitation of a sinusoidal signal in amplitude, shown below.
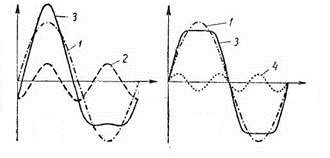
The left graph shows the distortions caused by the presence of an additional even harmonic signal - limiting the amplitude of one of the half-wave signals. The original sinusoidal signal has the number 1, the oscillation of the second harmonic 2, and the received distorted signal 3. The right figure shows the result of the third harmonic - the signal is cut off from two sides.
In Soviet times, the non-linear distortion of the amplifier was taken to be expressed using the harmonic distortion coefficient of the OIG. It was determined as follows - a signal of a certain frequency, usually 1000 Hz, was fed to the input of the amplifier. Then, the level of all harmonics at the output was calculated. The ratio of the rms voltage of the sum of the higher harmonics of the signal, except for the first, to the voltage of the first harmonic — the one whose frequency is equal to the frequency of the input sinusoidal signal, was taken for OIG.
A similar foreign parameter is referred to as - total harmonic distortion for fundamental frequency.
Harmonic Distortion Coefficient (OIG or )
This technique will work only if the input signal is perfect and contains only the main harmonic. This condition is not always possible to fulfill, therefore, in modern international practice, another parameter for estimating the degree of nonlinear distortion - SOI - has become much more common.
Foreign analog - total harmonic distortion for root mean square.
Nonlinear distortion factor (SOI or )
A SOI is a value equal to the ratio of the mean-square sum of the spectral components of the output signal, which are absent in the spectrum of the input signal, to the root-mean-square sum of all the spectral components of the input signal.
Both CED and OIG are relative values, which are measured in percentages.
The values of these parameters are related by the relation:
For simple waveforms, the magnitude of the distortion can be calculated analytically. Below are the SOI values for the most common signals in audio equipment (the OIG value is indicated in parentheses).
0% (0%) - the waveform is an ideal sine wave.
3% (3%) - the waveform is different from sinusoidal, but the distortions are invisible to the eye.
5% (5%) - deviation of the waveform from the sinusoidal visible by eye on the oscillogram.
10% (10%) - the standard level of distortion, at which the real power (RMS) of the UMZCH is considered, is audible.
12% (12%) is a perfectly symmetrical triangular signal.
21% (22%) - “typical” signal of trapezoidal or step shape. [3]
43% (48%) is a perfectly symmetrical square wave (square wave).
63% (80%) is the ideal sawtooth signal.
Twenty years ago, complex, expensive instruments were used to measure the harmonic distortion of the low-frequency path. One of them, SK6-13, is shown in the figure below.
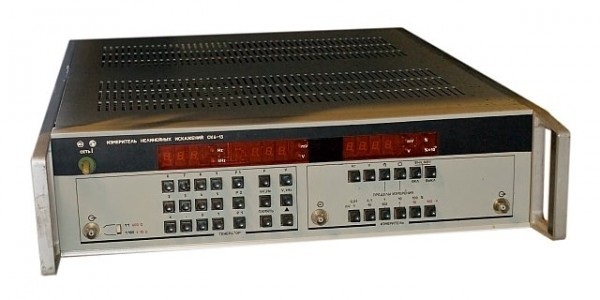
Today, this task is much better done by an external computer sound card with a set of specialized software, with a total cost not exceeding 500USD.
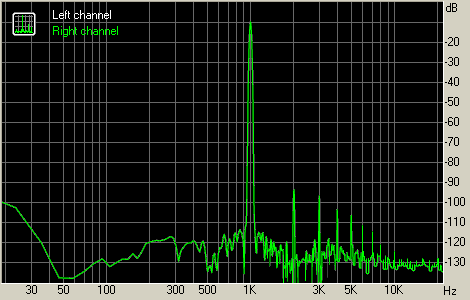
The spectrum of the signal at the input of the sound card when testing a low-frequency amplifier.
Amplitude response. Very briefly on noise and interference.
The dependence of the output voltage of the amplifier on its input, at a fixed signal frequency (usually 1000 Hz), is called the amplitude response.
The amplitude characteristic of an ideal amplifier is a straight line passing through the origin, since its gain is constant at any input voltages.
On the amplitude characteristic of a real amplifier there are at least three different sections. In the lower part, it does not reach zero, since the amplifier has its own noises, which become at low volume levels commensurate with the amplitude of the useful signal.
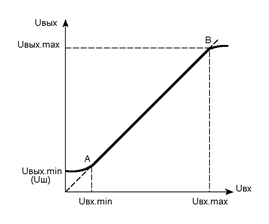
In the middle part (AB), the amplitude response is close to linear. This is the working area, in its range of distortion of the waveform will be minimal.
In the upper part of the graph, the amplitude characteristic also has a bend, which is caused by a limitation on the output power of the amplifier.
If the amplitude of the input signal is such that the operation of the amplifier goes on curved sections, then nonlinear distortions appear in the output signal. The greater the nonlinearity, the more distorted the sinusoidal voltage of the signal, i.e. At the output of the amplifier, new oscillations appear (higher harmonics).
Noises in amplifiers are of different types and are caused by different reasons.
White noise
White noise is a signal with a uniform spectral density at all frequencies. Within the operating frequency range of low-frequency amplifiers, an example of such noise can be considered thermal, caused by the chaotic motion of electrons. The spectrum of this noise is uniform over a very wide frequency range.
Pink noise
Pink noise is also known as flicker (flicker noise). The spectral power density of pink noise is proportional to the ratio 1 / f (the density is inversely proportional to frequency), that is, it is uniformly decreasing on a logarithmic frequency scale. Pink noise is generated by both passive and active electronic components, scientists still argue about the nature of its origin.
Background from external sources
One of the main causes of noise is background induced from unauthorized sources, for example, from an AC network of 50 Hz. It has a fundamental harmonic of 50 Hz and multiples of it.
Self excitation
Self-excitation of individual amplifier stages can generate noises, usually of a certain frequency.
ULF output and acoustics standards
Rated power
Western analogue of RMS (Root Mean Squared - RMS) In the USSR, GOST 23262-88 was defined as the average value of the input electric power of a sinusoidal signal with a frequency of 1000 Hz, which causes nonlinear distortions of the signal not exceeding a predetermined SOI value (THD). Indicated by both speakers and amplifiers. Typically, this power was adjusted to the requirements of GOST to the class of complexity of execution, with the best combination of measured characteristics. For different classes of devices SOI can vary very significantly, from 1 to 10 percent. It may be that the system is declared at 20 watts per channel, but the measurements were carried out at 10% SOI. As a result, listening to the acoustics at a given power is impossible. Speakers are able to reproduce the signal on RMS-power for a long time.
Passive noise power
Sometimes also called sinusoidal. The closest western analogue of DIN is electrical power limited solely by thermal and mechanical damage (for example: slipping of the coil of the voice coil from overheating, burnout of conductors at the points of bend or soldering, breakage of flexible wires, etc.) when summing up pink noise through a correction circuit during 100 hours. DIN is usually 2-3 times higher than RMS.
Maximum short-term power
Western analog PMPO (Peak Music Power Output - peak output music power). - the electrical power that the loudspeakers of the speakers sustain without damage (checked by the absence of chatter) for a short period of time. Pink noise is used as a test signal. The signal is fed to the speaker for 2 seconds. Tests are carried out 60 times with an interval of 1 minute. This type of power makes it possible to judge the short-term overloads that the loudspeaker can withstand in situations arising during operation. Usually 10-20 times higher than DIN. What is the use of knowing if a person knows that his system
Maximum long-term power
This is the electrical power that the loudspeakers can withstand without damage for 1 minute. The tests are repeated 10 times with an interval of 2 minutes. The test signal is the same.
The maximum long-term power is determined by the thermal stability of the loudspeakers of the AU (creep of the coil of the voice coil, etc.).
Practice is the best criterion of truth. Disassembly with audio center
Let's try to apply our knowledge in practice. Let's look at one very famous online store and look for a product of an even more famous company from the Land of the Rising Sun.
Yeah - that's the music center of futuristic design is sold for only 10,000 rubles. for the next promotion:
From the description we learn that the device is equipped not only with powerful speakers, but also with a subwoofer.
“It provides excellent clarity when choosing any volume level. In addition, this configuration helps to make the sound rich and surround. ”
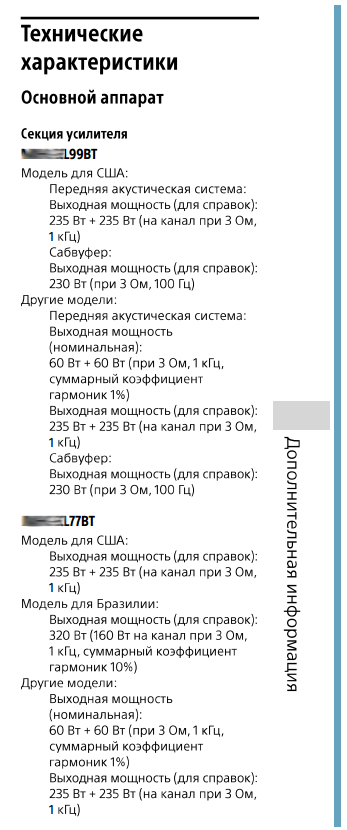 Fascinating, perhaps worth a look at the options. “The center contains two front speakers, each with a capacity of 235 watts, and an active subwoofer with a capacity of 230 watts.” The dimensions of the first are only 31 * 23 * 21 cm.
Yes, this is a Nightingale the robber of some kind, and by the strength of his voice and in size. Back in 96, I would stop my research on this, and later, looking at my S90 and listening to the self-made Ageev amplifier, I would have a lot of discussion with friends about how far our Soviet industry has lagged behind the Japanese or about 50 years or not. But today the situation is much better with the availability of Japanese technology and many myths associated with it have collapsed, so before buying we will try to find more objective data on the sound quality. On the site about this is not a word. Who would doubt that! But there is an instruction manual in pdf format.
Download and continue the search. Among the extremely valuable information that "the license for the audio coding technology was obtained from Thompson" and how to insert the batteries with difficulty, but still it is possible to find something resembling technical parameters. Very scarce information is hidden in the depths of the document, near the end.
I quote it verbatim, in the form of a screenshot, since, from this moment on, I began to have serious questions, both to the given figures,
The fact is that just below it was written that the power consumed from the AC network of the first system is 90 watts, and the second is generally 75. Hmm.
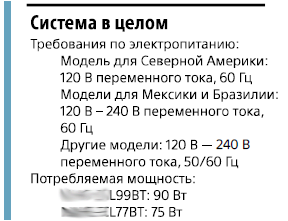 Invented the eternal engine of the third kind? And maybe in the case of the music center batteries are hidden? Yes, it does not seem - the declared weight of the device without acoustics is only three kilos. Then, as consuming 90 watts from the network, you can get at the output of 700 mysterious watts (for reference) or at least a miserable, but quite tangible 120 nominal. After all, while the amplifier should have an efficiency of about 150 percent, even with the subwoofer off! But in practice, this parameter rarely exceeds the bar in 75.
Let's try to apply the information obtained from the article in practice.
The stated power for reference is 235 + 235 + 230 = 700 - this is clearly PMPO. With nominal clarity a lot less. Judging by definition, this is the nominal power , but it can not be 60 + 60 only for the two main channels, excluding the subwoofer, with a nominal power consumption of 90 watts. This is more and more like a marketing ploy, and outright lies. Judging by the size and the unspoken rule, the ratio of RMS and PMPO, the real nominal power of this center should be 12-15 watts per channel, and the total should not exceed 45. A natural question arises - how can you trust the passport data of Taiwanese and Chinese manufacturers when even the well-known Japanese Does the company allow itself?
To buy such a device or not - the decision is up to you. If in order to put the neighbors in the country in the morning, yes. Otherwise, I would not recommend it without first listening to several songs in different genres.
Kettle tar in a jar of honey.
It would seem that we have an almost exhaustive list of parameters necessary for estimating the power and quality of sound. But, with closer attention, this is far from being the case, for a number of reasons:
- Many parameters are more suitable not so much for an objective reflection of signal quality, but for convenience of measurement. Most are conducted at a frequency of 1000 Hz, which is very convenient for obtaining the best numerical results. It is located far from the frequency of the background of the electrical network of 50 Hz and in the linear section of the frequency range of the amplifier.
- Manufacturers often sin outright adjustment of the characteristics of the amplifier under the tests. For example, even in the times of the Soviet Union, ULFs were often designed in such a way as to provide the best indicator of OIG, with a maximum output power rating. At the same time, at half the power level in push-pull amplifiers, a step-type distortion often manifested itself, due to which the harmonic distortion coefficient with an average position of the volume knob could go off scale by 10%!
- In passports and operating instructions, non-standard fake, absolutely useless characteristics like PMPO are often given. At the same time, it is not always possible to find even such basic parameters as the frequency range or nominal power. About the frequency response and phase response and say nothing!
- Measurement of parameters is often carried out according to deliberately distorted techniques.
It is not surprising that in such conditions many buyers fall into subjectivism and are guided when buying, at best, solely on the results of a short listening, at worst on price.
It's time to wrap up, the article and so turned out to be excessively long!
. !
parpalak - . .
Source: https://habr.com/ru/post/399793/
All Articles