Scientists have recorded a record low sea ice level for November
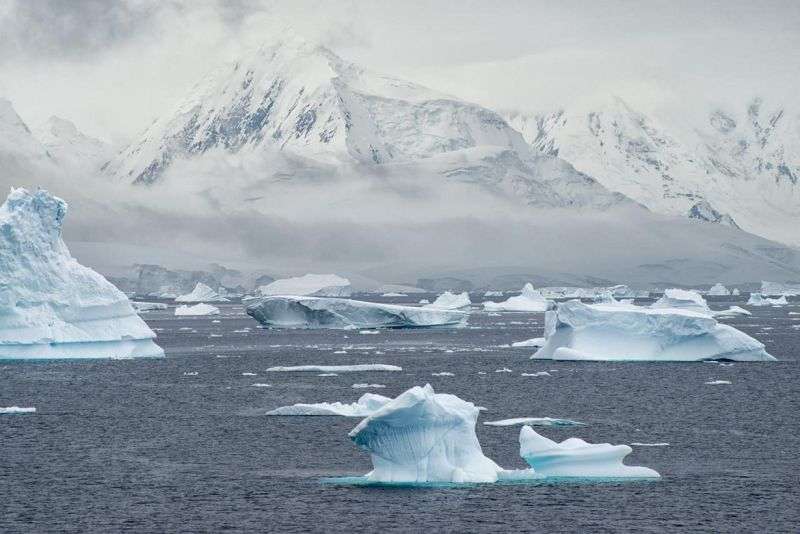
Sea ice off the coast of Antarctica and in the Arctic is at a record low level for this time of year: the length of the ice cover as of December 4 was lower than the average level of 1981-2010 by 3.84 million km 2 , which is comparable to the size of India or two Alaskas . Climatologists believe that the reason lies in the increase in global temperatures.
In recent years, contrary to the trend of global warming and the steady retreat of ice in the Northern Hemisphere, the ice that floated in the Southern Ocean off the coast of Antarctica has only increased. But now the ice area is decreasing in both hemispheres, which is reasonably worrying scientists: the accumulation of technogenic greenhouse gas emissions in the atmosphere, the natural El Niño phenomenon, which this year shook the habitual temperature of the Pacific waters and the vagaries of nature clearly contributed to the situation.
')
According to scientists from the National Data Center for snow and ice , due to the record high air temperature and the warming of the world's oceans, the level of Arctic ice decreased in November. The same situation is observed in the Southern Hemisphere, where the level of sea ice dropped to a record minimum for the month.
The area of Arctic sea ice on average in November was 9.08 million km 2 , which is 1.95 million km 2 lower than the monthly figures recorded from 1981 to 2010. And although at the beginning of the month the rate of increase in Arctic ice was slightly above the average, the total length actually decreased over a short period in mid-November. A change in the length of 50 thousand km 2 is observed mainly in the Barents Sea, in the region of the Arctic Ocean north of Norway, Finland, and also in the eastern part of Russia.
Scientists said that such a reduction in length is almost unprecedented for November. A less obvious and brief deviation from the norm could be observed in 2013, when the melting of the Arctic ice went beyond the limits of the norm and amounted to 14 thousand km 2 .

The graph in blue highlights the daily change in the level of Arctic ice to December 5, 2016, inclusive. In addition, indicators for the previous 4 years are indicated: in the graph they are represented by lines of green, orange, brown and purple. The dark gray line indicates the average for 1981-2010. The light gray area is the tolerance range.
In November 2016, a record low for 38 years of satellite monitoring was recorded. This indicator dropped 3.2 points below the margin of tolerance. Going beyond was even more than in September 2012, when the minimum amount of ice in the Arctic reached a record low.
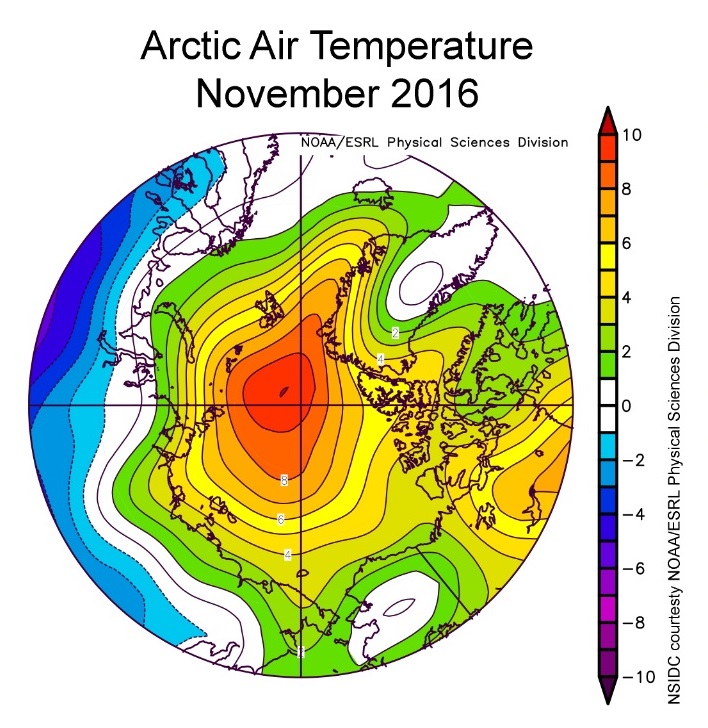
This temperature chart shows the difference between the November temperatures of 2016 in the Arctic from the average. At the level of 925 hPa, the temperature in the atmosphere was above the average 1981–2010 throughout the Arctic Ocean.
Scientists said that high temperatures over the Arctic Ocean, persistent wind from the south and warm ocean waters together led to a reduction in the length of Arctic ice. Stretching from the north-east of Greenland to Shpitsbergen and Severnaya Zemlya, the air temperature at the level of 925 hPa was up to 10 ° above the average of 1981-2010 during the month. These values contrast sharply with those in northern Eurasia, where temperatures ranged from 4 ° to 8 ° below average. Snow records were recorded in Sweden and throughout Siberia at the beginning of the month.
Scientists have named the possible reasons for such changes. In the autumn-winter period, we can observe a cyclone passing from Iceland through the Norwegian Sea and further to the Barents Sea. In November of this year, he changed the trajectory and instead of the usual path went to the Arctic Ocean through the Fram Strait, which separates the Spitsbergen archipelago and Greenland. Thus, the southern winds hit the Fram Strait, the Eurasian Arctic and the Barents Sea, which explains the unusual warming over the Arctic Ocean. The wind also pushed the ice to the north: this explains why the sea ice in the Barents Sea retreated in November.
The temperature on the surface of the Barents and Kara Seas remained unusually high for this time of year, which also interfered with the normal formation of ice - contributed to the circulation of warm Atlantic water in the Arctic shelf .

The ratio between sea ice area in September 1953-2015 and carbon dioxide emissions. Gray rhombuses are individual data values from satellites, circles are values of the pre-satellite era. The red dotted line indicates a linear relationship, the solid one is a 30-year moving average .
In addition to high temperatures and warm currents, the loss of sea ice is associated with anthropogenic emissions of carbon dioxide. Scientists investigated this linear relationship based on satellite data and pre-satellite observations, climate models. The observed ratio is equivalent to a loss of 3 m 2 of ice for every metric ton of carbon dioxide released into the atmosphere, compared to the average of 1.75 m 2 of all climate models. This result demonstrates that the models are generally conservative with respect to observations of how the Arctic loses its ice cover. The ability to monitor the rate of ice loss per metric ton of CO 2 allows people to feel their own contribution to reducing the area of ice.
Source: https://habr.com/ru/post/399761/
All Articles