A story about how to be a quantitative analyst
After I passed the Level 1 CFA exam, I was often written by those who wanted to learn how to become a quantitative analyst. To some extent, this material answers this question. However, here I’ll tell you not about how to become an analyst, but about how to be in any branch of the financial services industry in which you work. “To be an analyst,” in my understanding, means more likely to follow a certain ideology, rather than focusing on a certain formal set of knowledge, skills and rules.

I believe that financial mathematics should be considered as a science, and not as a profession. This means that knowing how to become an analyst is less important than knowing how to be . In the latter case, we are dealing with the principles and ideology of financial mathematics (which, I think, can be successfully applied in any field of finance), while the former is rather related to certain actions that need to be performed in order to get a job, in whose title There is “finance” and “analysis.”
At a fundamental level, to be a quantitative analyst is not only aware of how to find a closed formula for estimating the value of a rare option, having a certain stochastic model, and not the ability to develop, train and test systematic trading strategies that use statistical regression models. To be an analyst is to adhere to the scientific method and apply it when studying financial markets.
')
This ideology has gained popularity among quantitative analysts in the field of valuation of derivatives. However, risk analysts in the field of risk management began to use it. The same can be said about asset management and trading using quantitative methods and models. I believe that in the coming decades the scientific method will continue to extend to other areas, such as corporate finance, investment banking, direct and even venture capital investment. In each area, it can take various forms, slightly modified, and perhaps even be called differently, say, “data science,” but the basis will always be the same.
Today I will try to talk about what, in my opinion, is to be a quantitative analyst. I must note that I have been an analyst for only a few years, so my views are still forming. If you meet something that you disagree with, or you want to add something, write to me.
The material consists of three parts. In the first we will talk about the philosophy of science. In the second - about the scientific method. In the third - about models and thinking.
When I worked hard, trying to get a diploma with honors in the field of computer science, our group had to perform an annual module, which was called “research methods”. To work on the assignment we were offered to use a pair of books on the philosophy of science: Philosophy of Science: From Explanation to Justification . Despite the fact that the teacher really tried to make the lessons boring, I literally enjoyed the fact that I was able to learn about the philosophy of science. Moreover, it turned out that a lot of what we did was very useful to me while working as a quantitative analyst.
The philosophy of science is a section of philosophy that deals with the logical foundations, methods and results of the application of science. In general, the philosophy of science is trying to find an answer to questions about what science is, why science works, and what the limitations of science are. Gradually, within the framework of the philosophy of science, various, sometimes quite completely opposite, teachings were formed. Among them are such as scientific realism, constructive empiricism and instrumentalism. Induction, deduction and abduction are in perpetual dispute, there is a confrontation between the concepts of logical positivism and the principle of the falsification of theories.
Here is an interesting diagram illustrating the interrelationships of various currents of the philosophy of science.
Realism is called the direction in the philosophy of science, which claims that the world described by science is the real world, and not how it is perceived by an observer. In turn, empiricism asserts that, since knowledge is based on experience, all knowledge is conditional and probabilistic, and therefore can be revised or falsified. There are various forms of realism and empiricism, differing in the severity of formulations. For example, scientific realism and structural realism.
When people talk about the advantages of realism over empiricism, they first of all recall the accuracy of scientific theories. If the theory is accurate, then it is suitable for predicting what can happen in the real world. Thus, it must adequately describe the world. This may be true in physics, but not in finance. If we take into account the imperfection of financial theories, I think that we should regard them as, by nature, conditional, amenable to improvement and falsifiable.
The philosophy of science distinguishes several forms of logical thinking.
Deductive reasoning , or simply deduction, involves a chain of reasoning from the general to the particular, based on one or several statements, as a result of which a logical conclusion is drawn. Deduction is a form of thinking that can be found in mathematics and in the formal methods of computer science. Deduction allows us to relate hypotheses and their consequences, while, if the hypotheses are true, the consequences also.
Abductive reasoning , or abduction, is a less severe form of deduction, which states that deductive logical conclusions are not always true, but at the same time, they are always the best possible given the available data and hypotheses.
Inductive reasoning , or induction, involves a sequence of reasoning from the particular to the general, when there are one or several reliable hypotheses based on observations, and on their basis a conclusion is drawn that is probabilistically true with regard to the truth of the original data. It is impossible to prove the truth of inductive conclusions, they can only be falsified if observations are made that contradict those on which the conclusions are based.
The problem with induction is that the knowledge gained in this way is unreliable. In short, this problem is illustrated by the story of the black swan. If all the swans we have seen so far are white, we can use these observations to conclude that "all swans are white." However, in order to refute our theory, it is enough just one observation of a black swan. The knowledge gained by induction can be called unreliable. This is the basis of the study of Nassim Nicholas Taleb .
Quantitative theories concerning the market are built on the results of inductive conclusions based on empirical observations. As a result, such theories do not differ in reliability. They may be found to be inappropriate to the real state of affairs or falsified if observations are made that contradict them (outliers in the data, black swans, not predicted by the model). However, this statement is true only in theory; in practice, most theories characterized by some “unconditionally true” or internally contradictory evidence are often simply ignored.

Perhaps here you have a question about how the philosophy of science can help you to be a quantitative analyst. I am sure that this is important, because philosophy forces us to recognize our own limitations, makes us more objective. In addition, and this is very, very important, the philosophical view makes it possible to see the following: despite the fact that some financial theories are so deeply rooted in the profession that it seems that they are unable to damage empirical observations proving their inconsistency, such theories are easily destroyed. Here I am reminded of some economic models and popular assumptions of quantitative models , namely: uncovered interest rate parity, normally distributed values of financial instruments yields, linearity, stationarity, random walk hypothesis, efficient market hypothesis.
The scientific method is a continuous process, which usually includes the stages of systematic observations, quantitative measurements, experiments, formulation of hypotheses, testing of hypotheses and their correction. Now we consider this process on the example of the random walk hypothesis.
Here you can see a presentation devoted to the scientific method. From the same figure is taken below. He schematically illustrates the stages of the scientific method.
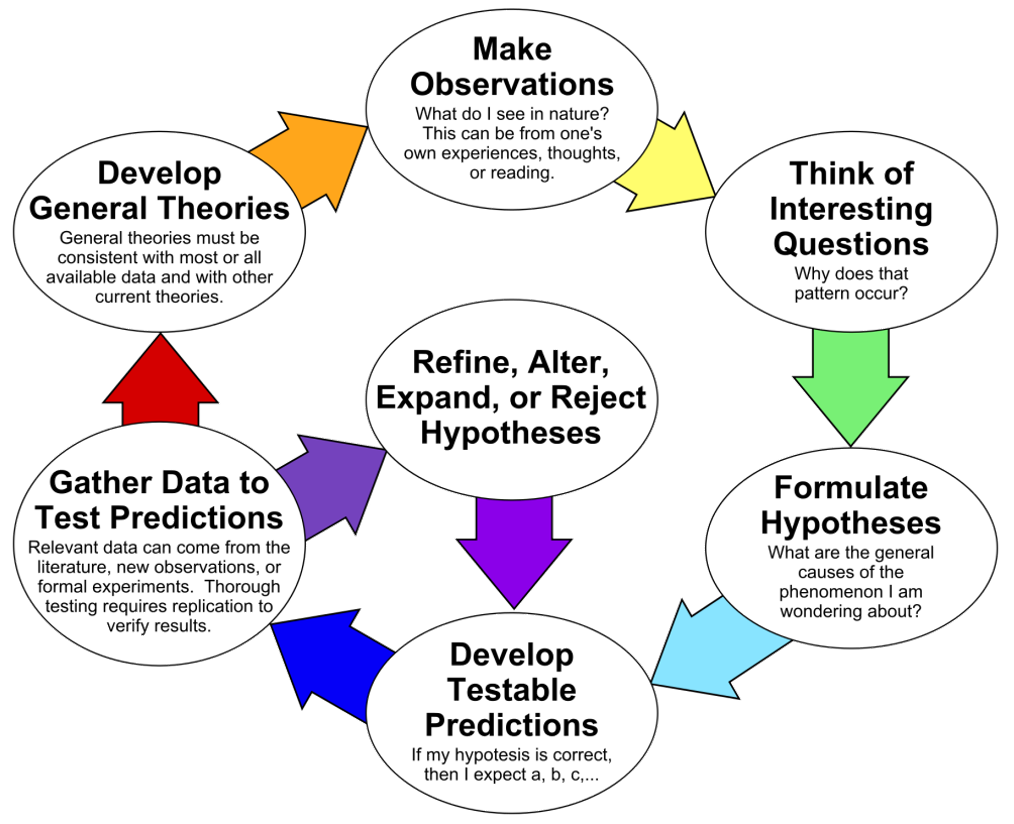
The stages of the scientific method
Observation is a purposeful process of perception of reality. In the context of financial markets, this concept can be expanded to the observation of ideas that can be found in books, television programs, or, perhaps, even reading good (or bad) articles on the Internet.
Following our example, one can observe that many scientific articles and popular books claim that market prices are developing in accordance with the model of a random walk or stochastic process.
The one who usually asks questions, at least a little, is a skeptic. Here you can read more about this. You can start with the simplest questions: “What? How? Where? When? Why? How?". Even if we confine ourselves only to them, new promising areas can be found for further research. We will ask these questions as applied to the random walk hypothesis.
As you can see, the process of asking questions, this is irony, rather chaotic, and many questions, in whole or in part, have already been answered by those who have previously done similar research. That is why in the course of the work it is important to get acquainted with the profile literature. As soon as you ask enough questions and read enough relevant materials, ideas will start to form in your head. It is these ideas that we are going to formulate, turning it into scientific hypotheses that can be tested.
Hypotheses are statements that establish a certain relationship between a set of certain quantities. Good hypotheses should be concise, declarative, easily verifiable. They have to take into account what has already been done in the area under study, in order not to push to search for what has long been found. Take, for example, the following valuable idea, which was put forward by one of my readers, very passionate about his work.
Despite the fact that before us is a great idea, the hypothesis is extremely difficult. So, many conditions are not defined here, it is difficult to verify it, as well as to refute, and, in fact, the above statement consists of a whole set of hypotheses mixed with each other. Let us single out individual hypotheses from our idea.
By the way, I somehow worked with a similar hypothesis . Like most studies, mine led to a probabilistic conclusion: “markets are not chaotic, at least in accordance with the above definition,” and became the source of many questions. Such questions usually lead to new hypotheses and research. As you can see, research, especially those that are conducted using a scientific approach, is a continuous process that, in general, never stops.
We now single out two more hypotheses from our idea.
In the next section we will talk about how this hypothesis can be tested. However, I want to draw your attention to two materials: Risk aversion and the Asset Prices in an Exchange Economy . Here is an excerpt from the second work.
In the aforementioned studies, the goal is to check whether the actions of rational agents in a market economy with timely access to all necessary information entail random movements of market prices.
The conclusions of these works are that while you can create a market model that develops in accordance with the theory of random walk, you can create a model that does not follow this theory. Thus, market efficiency does not necessarily mean that it should be chaotic.
And, finally, we will single out another hypothesis from the initial idea, which, despite being the most promising, is at the same time and least studied. This is so, mainly due to the fact that this hypothesis is very difficult to verify.
By the way, the most interesting idea.
If we limit this hypothesis to a certain period of time, let it be 5 years, and define the concept of “profit” (here we can speak, for example, of the alpha coefficient, which characterizes the riskiness of a financial instrument in relation to the market), perhaps this hypothesis can be checked . In view of the above, this hypothesis is definitely slightly less concise and declarative in comparison with others. It will be harder to refute it, that is, it is not an ideal hypothesis, it can be divided into smaller parts for further work.
In order to develop a forecast on the basis of a hypothesis, we must begin with the assumption that our hypothesis is correct, or consider it incorrect. Next, you need to understand what quantitative indicators we expect or do not expect to see. For example, if the first formulated hypothesis is true, we can expect that market returns (price moves up or down) will look like a random sequence from the NIST cryptographic test suite, also known as the Martin-Löf sequence. In the past, exploring this hypothesis, I, for comparison, used a random number generator based on the Mersenne vortex. Then it turned out that the sequences are different. This, in turn, means that the hypothesis was false.
Here is the mistake that many are subject to. They believe that the hypothesis being studied must be true. In fact, whether it is false or true. What is important is the contribution of the researcher to science, that thanks to his work, existing knowledge on a specific problem has been expanded.
If I tested our second hypothesis, perhaps I would go further and develop an agent-based model in which market efficiency is guaranteed. From this model, I would extract the returned sequences, and test them in order to find out if they are random. Below we will talk about how to include models in the thought process.
Here everything, I suppose, is clear. The only thing I would like to add is that the data that can be used to verify the predictions can either be collected in the real world (empirical data) or, alternatively, generated using a model that matches the hypothesis.
Each of these two approaches has its pros and cons. Empirical data are subject to extraneous influences, the cause of which is how exactly the measurements were made, how the data were collected and processed. In turn, the data obtained from the model make sense only if the model is correctly implemented.
Based on the collected data, we can either say: “yes, our forecasts turned out to be correct, this evidence supports the hypothesis”, or: “no, the forecasts are wrong, and the hypothesis also”. Note that in the first case the evidence only supports the hypothesis, while in the second evidence it is falsified. This brings us back to the philosophy of science. The hypothesis (or theory) can be falsified, but it is impossible to prove its absolute truth.
When a sufficient number of hypotheses will be developed and carefully tested, they can be combined to form more general theories. For example, it took decades to research the relationship between risk and profit before the modern Markowitz portfolio theory was widely accepted.
In fact, in time for the defense of the thesis in which this theory was presented, it was almost recognized as completely unscientific. Here is what he writes about this Harry Markovits himself:
I think each of us can learn something useful from this story. Just because the idea that you have is unpopular or not widely accepted does not mean that you are wrong. The financial community, in my opinion, is very conservative, it prefers to adhere to certain ideals with almost religious fanaticism. The role of a quantitative analyst is to objectively look at the world of finance and gradually extract the truth about financial markets. Seek truth, not agreement.
Here I would like to mention a wonderful book, A Non Random Walk down Wall Street , thanks to which I was able to learn about a couple of the aforementioned works devoted to chaos, and share Markowitz's quote with you.
In the third part of the material, as I promised, let's talk about thinking with models. A model is a simplified representation of an object or process in the real world. The tools that analysts use to build models are mathematics and computers. For example, an analyst might work with a risk model associated with a portfolio of assets. But why use models at all? Especially after they made a very serious contribution to the financial crisis of 2008.
In the process of creating a model, whether it is a program or a system of equations, it is necessary to clearly define the idea on which the model is based. Models make us think about small, but very important details, what to send to the input of the system, how to process the data, what to send to the output. This process in itself helps to find white spots in the idea and correct what was wrong.
Once the model is implemented, for example, in the code, it can be tested. The most important test for any model is to check how well it relates to the real world. Take, for example, the geometric model of the Brownian movement of assets. How does the model relate to the real world?
Does it provide for a market crash? And periods of low and high volatility? Of course, the answers to all these questions asked about the simple model will be negative. These differences of models from the real world force us to create more complex systems. For example, among such developments is the diffusion-hopping Merton model, or the Heston model with stochastic volatility.
Another more general test for the model is to check it for historical data. Take, for example, a simple strategy for investing in value. , , , . , ( ) . , – , .
, : Alpha Architect Flirting with Models . , .
, , . , .
, , . , 80%? , , 30% . – , , . , , Coursera: Model Thinking . – . , , .
, « », . -, , . .
– , – , . – , . , , : , .
, , , , . , « » « - » .
, , , , , . . – .
I believe that financial mathematics should be considered as a science, and not as a profession. This means that knowing how to become an analyst is less important than knowing how to be . In the latter case, we are dealing with the principles and ideology of financial mathematics (which, I think, can be successfully applied in any field of finance), while the former is rather related to certain actions that need to be performed in order to get a job, in whose title There is “finance” and “analysis.”
At a fundamental level, to be a quantitative analyst is not only aware of how to find a closed formula for estimating the value of a rare option, having a certain stochastic model, and not the ability to develop, train and test systematic trading strategies that use statistical regression models. To be an analyst is to adhere to the scientific method and apply it when studying financial markets.
')
This ideology has gained popularity among quantitative analysts in the field of valuation of derivatives. However, risk analysts in the field of risk management began to use it. The same can be said about asset management and trading using quantitative methods and models. I believe that in the coming decades the scientific method will continue to extend to other areas, such as corporate finance, investment banking, direct and even venture capital investment. In each area, it can take various forms, slightly modified, and perhaps even be called differently, say, “data science,” but the basis will always be the same.
Today I will try to talk about what, in my opinion, is to be a quantitative analyst. I must note that I have been an analyst for only a few years, so my views are still forming. If you meet something that you disagree with, or you want to add something, write to me.
The material consists of three parts. In the first we will talk about the philosophy of science. In the second - about the scientific method. In the third - about models and thinking.
Philosophy of science
What does it mean to be a financial analyst? This means knowing the limitations of empirical science and inductive thinking. Understand that all financial theories are error prone, and all quantitative models can be easily destroyed.
When I worked hard, trying to get a diploma with honors in the field of computer science, our group had to perform an annual module, which was called “research methods”. To work on the assignment we were offered to use a pair of books on the philosophy of science: Philosophy of Science: From Explanation to Justification . Despite the fact that the teacher really tried to make the lessons boring, I literally enjoyed the fact that I was able to learn about the philosophy of science. Moreover, it turned out that a lot of what we did was very useful to me while working as a quantitative analyst.
The philosophy of science is a section of philosophy that deals with the logical foundations, methods and results of the application of science. In general, the philosophy of science is trying to find an answer to questions about what science is, why science works, and what the limitations of science are. Gradually, within the framework of the philosophy of science, various, sometimes quite completely opposite, teachings were formed. Among them are such as scientific realism, constructive empiricism and instrumentalism. Induction, deduction and abduction are in perpetual dispute, there is a confrontation between the concepts of logical positivism and the principle of the falsification of theories.
Here is an interesting diagram illustrating the interrelationships of various currents of the philosophy of science.
Realism and Empiricism
Realism is called the direction in the philosophy of science, which claims that the world described by science is the real world, and not how it is perceived by an observer. In turn, empiricism asserts that, since knowledge is based on experience, all knowledge is conditional and probabilistic, and therefore can be revised or falsified. There are various forms of realism and empiricism, differing in the severity of formulations. For example, scientific realism and structural realism.
When people talk about the advantages of realism over empiricism, they first of all recall the accuracy of scientific theories. If the theory is accurate, then it is suitable for predicting what can happen in the real world. Thus, it must adequately describe the world. This may be true in physics, but not in finance. If we take into account the imperfection of financial theories, I think that we should regard them as, by nature, conditional, amenable to improvement and falsifiable.
Deduction, induction, abduction
The philosophy of science distinguishes several forms of logical thinking.
Deductive reasoning , or simply deduction, involves a chain of reasoning from the general to the particular, based on one or several statements, as a result of which a logical conclusion is drawn. Deduction is a form of thinking that can be found in mathematics and in the formal methods of computer science. Deduction allows us to relate hypotheses and their consequences, while, if the hypotheses are true, the consequences also.
Abductive reasoning , or abduction, is a less severe form of deduction, which states that deductive logical conclusions are not always true, but at the same time, they are always the best possible given the available data and hypotheses.
Inductive reasoning , or induction, involves a sequence of reasoning from the particular to the general, when there are one or several reliable hypotheses based on observations, and on their basis a conclusion is drawn that is probabilistically true with regard to the truth of the original data. It is impossible to prove the truth of inductive conclusions, they can only be falsified if observations are made that contradict those on which the conclusions are based.
The problem with induction is that the knowledge gained in this way is unreliable. In short, this problem is illustrated by the story of the black swan. If all the swans we have seen so far are white, we can use these observations to conclude that "all swans are white." However, in order to refute our theory, it is enough just one observation of a black swan. The knowledge gained by induction can be called unreliable. This is the basis of the study of Nassim Nicholas Taleb .
Quantitative theories concerning the market are built on the results of inductive conclusions based on empirical observations. As a result, such theories do not differ in reliability. They may be found to be inappropriate to the real state of affairs or falsified if observations are made that contradict them (outliers in the data, black swans, not predicted by the model). However, this statement is true only in theory; in practice, most theories characterized by some “unconditionally true” or internally contradictory evidence are often simply ignored.
Perhaps here you have a question about how the philosophy of science can help you to be a quantitative analyst. I am sure that this is important, because philosophy forces us to recognize our own limitations, makes us more objective. In addition, and this is very, very important, the philosophical view makes it possible to see the following: despite the fact that some financial theories are so deeply rooted in the profession that it seems that they are unable to damage empirical observations proving their inconsistency, such theories are easily destroyed. Here I am reminded of some economic models and popular assumptions of quantitative models , namely: uncovered interest rate parity, normally distributed values of financial instruments yields, linearity, stationarity, random walk hypothesis, efficient market hypothesis.
Scientific method
What does it mean to be a financial analyst? Use the scientific method. It helps to develop scientific thinking and improves the testability of the models and hypotheses on which the models are based.
The scientific method is a continuous process, which usually includes the stages of systematic observations, quantitative measurements, experiments, formulation of hypotheses, testing of hypotheses and their correction. Now we consider this process on the example of the random walk hypothesis.
Here you can see a presentation devoted to the scientific method. From the same figure is taken below. He schematically illustrates the stages of the scientific method.
The stages of the scientific method
Observation
Observation is a purposeful process of perception of reality. In the context of financial markets, this concept can be expanded to the observation of ideas that can be found in books, television programs, or, perhaps, even reading good (or bad) articles on the Internet.
Following our example, one can observe that many scientific articles and popular books claim that market prices are developing in accordance with the model of a random walk or stochastic process.
Questions
The one who usually asks questions, at least a little, is a skeptic. Here you can read more about this. You can start with the simplest questions: “What? How? Where? When? Why? How?". Even if we confine ourselves only to them, new promising areas can be found for further research. We will ask these questions as applied to the random walk hypothesis.
- To which markets is this applicable? Are all markets equally chaotic? How does liquidity and other relative indicators of economic efficiency relate to the measure of market randomness?
- What are the underlying forces that make markets chaotic? Is it true that increasing the efficiency of the market leads to randomness? If the market is chaotic, market participants would have no reason to compete with each other, therefore, doesn’t it mean that if this happens and the market ceases to be effective, then it will not be more chaotic?
- Where are the chaotic markets located? This question brings us back to the first question. Are there places in the world where markets are less chaotic, for example, maybe these are emerging markets? And, if so, why? Maybe the case in different dynamics of development?
- When are the markets chaotic? Do they always behave like this, or is chaos sometimes interrupted by periods of some order? If markets are not always chaotic, does this mean that transitions from chaos to order can mean a profit?
- Why are markets chaotic? This question has something in common with the second question. What market forces support this state? Suppose that the main force is market efficiency, then ... Here, by the way, is an example of the beginning of the reasoning caused by an interesting question.
- How can one measure market efficiency and test the random walk hypothesis? Can we build a simulation model of the economy using an agent-based approach and test whether the pricing mechanism will be chaotic?
As you can see, the process of asking questions, this is irony, rather chaotic, and many questions, in whole or in part, have already been answered by those who have previously done similar research. That is why in the course of the work it is important to get acquainted with the profile literature. As soon as you ask enough questions and read enough relevant materials, ideas will start to form in your head. It is these ideas that we are going to formulate, turning it into scientific hypotheses that can be tested.
Hypotheses
Hypotheses are statements that establish a certain relationship between a set of certain quantities. Good hypotheses should be concise, declarative, easily verifiable. They have to take into account what has already been done in the area under study, in order not to push to search for what has long been found. Take, for example, the following valuable idea, which was put forward by one of my readers, very passionate about his work.
Market returns demonstrate chaotic behavior due to the fact that markets are quickly adapting to changes, getting rid of weaknesses.
Despite the fact that before us is a great idea, the hypothesis is extremely difficult. So, many conditions are not defined here, it is difficult to verify it, as well as to refute, and, in fact, the above statement consists of a whole set of hypotheses mixed with each other. Let us single out individual hypotheses from our idea.
Hypothesis №1. Market movements (lowering or raising prices) are indistinguishable from the random sequence of Martin-Löf.
By the way, I somehow worked with a similar hypothesis . Like most studies, mine led to a probabilistic conclusion: “markets are not chaotic, at least in accordance with the above definition,” and became the source of many questions. Such questions usually lead to new hypotheses and research. As you can see, research, especially those that are conducted using a scientific approach, is a continuous process that, in general, never stops.
We now single out two more hypotheses from our idea.
Hypothesis №2. Market efficiency, the timely availability of all information, leads to the fact that the markets are developing chaotically.
In the next section we will talk about how this hypothesis can be tested. However, I want to draw your attention to two materials: Risk aversion and the Asset Prices in an Exchange Economy . Here is an excerpt from the second work.
Given the chaotic nature of market prices, it is obvious that it is possible to construct accurate economic models in which price series have these characteristics, as well as such models with equally rational and informed agents, in which prices will not behave this way. This indicates that the results of tests aimed at investigating whether real price series are martingale properties by themselves do not shed light on the usual question of market "efficiency".
In the aforementioned studies, the goal is to check whether the actions of rational agents in a market economy with timely access to all necessary information entail random movements of market prices.
The conclusions of these works are that while you can create a market model that develops in accordance with the theory of random walk, you can create a model that does not follow this theory. Thus, market efficiency does not necessarily mean that it should be chaotic.
And, finally, we will single out another hypothesis from the initial idea, which, despite being the most promising, is at the same time and least studied. This is so, mainly due to the fact that this hypothesis is very difficult to verify.
Hypothesis №3. Regardless of whether markets develop erratically, all profitable opportunities attract too much attention too quickly, which does not allow investors to generate permanent profits.
By the way, the most interesting idea.
If we limit this hypothesis to a certain period of time, let it be 5 years, and define the concept of “profit” (here we can speak, for example, of the alpha coefficient, which characterizes the riskiness of a financial instrument in relation to the market), perhaps this hypothesis can be checked . In view of the above, this hypothesis is definitely slightly less concise and declarative in comparison with others. It will be harder to refute it, that is, it is not an ideal hypothesis, it can be divided into smaller parts for further work.
Predictable Predictions
In order to develop a forecast on the basis of a hypothesis, we must begin with the assumption that our hypothesis is correct, or consider it incorrect. Next, you need to understand what quantitative indicators we expect or do not expect to see. For example, if the first formulated hypothesis is true, we can expect that market returns (price moves up or down) will look like a random sequence from the NIST cryptographic test suite, also known as the Martin-Löf sequence. In the past, exploring this hypothesis, I, for comparison, used a random number generator based on the Mersenne vortex. Then it turned out that the sequences are different. This, in turn, means that the hypothesis was false.
Here is the mistake that many are subject to. They believe that the hypothesis being studied must be true. In fact, whether it is false or true. What is important is the contribution of the researcher to science, that thanks to his work, existing knowledge on a specific problem has been expanded.
If I tested our second hypothesis, perhaps I would go further and develop an agent-based model in which market efficiency is guaranteed. From this model, I would extract the returned sequences, and test them in order to find out if they are random. Below we will talk about how to include models in the thought process.
Data collection for checking forecasts
Here everything, I suppose, is clear. The only thing I would like to add is that the data that can be used to verify the predictions can either be collected in the real world (empirical data) or, alternatively, generated using a model that matches the hypothesis.
Each of these two approaches has its pros and cons. Empirical data are subject to extraneous influences, the cause of which is how exactly the measurements were made, how the data were collected and processed. In turn, the data obtained from the model make sense only if the model is correctly implemented.
Working with hypotheses
Based on the collected data, we can either say: “yes, our forecasts turned out to be correct, this evidence supports the hypothesis”, or: “no, the forecasts are wrong, and the hypothesis also”. Note that in the first case the evidence only supports the hypothesis, while in the second evidence it is falsified. This brings us back to the philosophy of science. The hypothesis (or theory) can be falsified, but it is impossible to prove its absolute truth.
General theories
When a sufficient number of hypotheses will be developed and carefully tested, they can be combined to form more general theories. For example, it took decades to research the relationship between risk and profit before the modern Markowitz portfolio theory was widely accepted.
In fact, in time for the defense of the thesis in which this theory was presented, it was almost recognized as completely unscientific. Here is what he writes about this Harry Markovits himself:
... When I defended my thesis, as a student at the Faculty of Economics at the University of Chicago, Professor Milton Friedman stated that portfolio theory is not something from the field of economics, and that the commission cannot award me a degree in economics for a thesis that has nothing in common with this science . I decided then that he was joking, because the commission, without long debates, recognized the defense to be held. As for the validity of his arguments, I fully admit that when I defended my thesis, portfolio theory was not part of economics. But now this is no longer the case.
I think each of us can learn something useful from this story. Just because the idea that you have is unpopular or not widely accepted does not mean that you are wrong. The financial community, in my opinion, is very conservative, it prefers to adhere to certain ideals with almost religious fanaticism. The role of a quantitative analyst is to objectively look at the world of finance and gradually extract the truth about financial markets. Seek truth, not agreement.
Here I would like to mention a wonderful book, A Non Random Walk down Wall Street , thanks to which I was able to learn about a couple of the aforementioned works devoted to chaos, and share Markowitz's quote with you.
Thinking models
What does it mean to be a financial analyst? Formalize ideas as models. Then use these models in order to more clearly comprehend ideas, check them for correctness, and discover hidden patterns in them.
In the third part of the material, as I promised, let's talk about thinking with models. A model is a simplified representation of an object or process in the real world. The tools that analysts use to build models are mathematics and computers. For example, an analyst might work with a risk model associated with a portfolio of assets. But why use models at all? Especially after they made a very serious contribution to the financial crisis of 2008.
Models - the path to clarity of thinking
In the process of creating a model, whether it is a program or a system of equations, it is necessary to clearly define the idea on which the model is based. Models make us think about small, but very important details, what to send to the input of the system, how to process the data, what to send to the output. This process in itself helps to find white spots in the idea and correct what was wrong.
About model checking
Once the model is implemented, for example, in the code, it can be tested. The most important test for any model is to check how well it relates to the real world. Take, for example, the geometric model of the Brownian movement of assets. How does the model relate to the real world?
Does it provide for a market crash? And periods of low and high volatility? Of course, the answers to all these questions asked about the simple model will be negative. These differences of models from the real world force us to create more complex systems. For example, among such developments is the diffusion-hopping Merton model, or the Heston model with stochastic volatility.
Another more general test for the model is to check it for historical data. Take, for example, a simple strategy for investing in value. , , , . , ( ) . , – , .
, : Alpha Architect Flirting with Models . , .
, , . , .
, , . , 80%? , , 30% . – , , . , , Coursera: Model Thinking . – . , , .
, « », . -, , . .
– , – , . – , . , , : , .
, , , , . , « » « - » .
, , , , , . . – .
Source: https://habr.com/ru/post/398337/
All Articles