How to make scientific predictions
Predictions, Not Accident
How to make predictions of any events so that serious scientists believe you, you became famous and got the Nobel Prize? It's very simple: you have to convince scientists that your predictions are just predictions, not an accident. For this, a school course in probability theory is enough. So, you need to complete only three points.
Item 1. We describe the predicted event, limiting its time and space interval. For example, we argue that a certain event will occur in the next day (time interval) within 100 km (spatial interval).
')
Next, we need to calculate the probability of the accidental occurrence of this event in the specified interval. There are various methods for this, depending on the type of events, their distribution, etc. But this must be done, and it is for this that we indicate a clear temporal and spatial interval of the event. Denote this probability by Pc.
Temptation: At this point, I really want to cheat, declaring an interval equal to infinity. That is, this event at the other end of the Earth - we were a bit wrong in the coordinates, and the fact that it is in a year is an error in time. But alas, it is for this that we need an estimate of the random appearance. In the case of an infinite interval, it will be too close to 1.
Paragraph 2. Next, we will look at how many of the predicted events happened. And based on this, we calculate the probability of our predictions. That is, if an event actually happened in the specified interval, we put plus one, did not happen — zero, and so for all our predictions. We denote this probability P before.
Temptation: Sometimes an event misses our range just a bit. Plus an hour, minus kilometer. And I really want to count it as a coincidence. Many unscrupulous researchers do this. But no - we need to either initially expand the range of predictions, or throw out our event from the calculation as unsuccessful.
Dilemma: And there is such an interesting dilemma - if we increase the range, more predicted events will fall into it. But - the probability of coincidence will also increase. Decreasing the range - reduce the accuracy of their predictions.
Evaluation Analysis Further, an evaluation analysis can be carried out . and P prev If the probability of a random event is much greater than predicted, or they are approximately equal, then we are doing something wrong. By deception, by fitting the facts - but not by predictions. If P case. much less than 1, and P before. more than at least 0.5 - then we can say that the study was successful. Then it is necessary to build more accurate probabilistic estimates, then write articles and run after the Nobel Prize. The evaluation analysis on this will be completed.
It seems to you that this article is about nothing, and all this is obvious to the researcher things? But alas, the research I did below shows a complete lack of understanding of these things by people who are officially engaged in science.
Part Two: Earthquake Prediction
Let us turn to the study of the reliability of predictions of earthquakes. Write this article I was inspired by the discussion, which began in the comments to this post . The point is this: a certain team of scientists believes that it can predict earthquakes, and one of the authors even puts these predictions on the site . I undertook to check the reliability from a statistical point of view.
For a start, complexity arose with the boundaries of predictions - the author does not directly indicate anywhere in what range it is made. That is, how to understand that this event is exactly what we predicted? There is no answer in scientific articles. Moreover, from the graph of the accuracy of predictions can be seen - the authors consider as successful predictions of events that happened over 1000 km. from the predicted point.

But we can define boundaries ourselves. To do this, take these quotes from their scientific papers :
The epicenter of the earthquake, so far, includes an area with a radius of about 50 km.We see that the error in degrees (this is about 100 km) is an acceptable accuracy in coordinates. This is confirmed by the above schedule. For the time interval, take a day, based on the following quote:
The time of occurrence of the alleged earthquake could vary within ± 13 hours from the estimated period. Of the 1118 predictions, 978 cases came true on the day they were predicted;According to the authors, the stated accuracy of such a forecast:
The success of these forecasts is about 70 - 80%.
Independent forecast evaluation
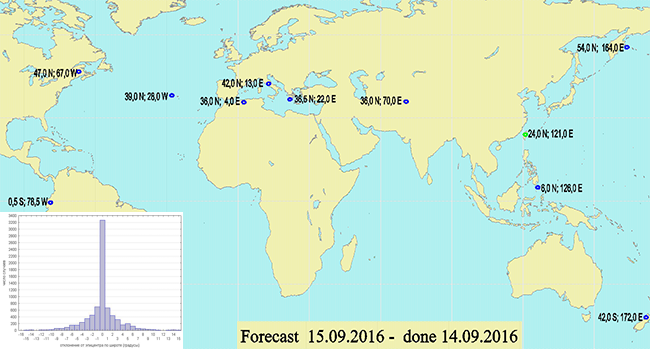
The assessment was taken on September 15, 2016 (I could verify that the forecast actually appeared one day before the event, and has not changed since then). In order not to create a load on the author’s site, I attach a picture with the forecast.
The actual data was taken from the EMSC site .
The site has the opportunity to see all the earthquakes for any period of time, with certain magnitudes. Data can be downloaded as a CSV or overlay on a Google map:

We see a complete data mismatch. The data was taken on September 15, all events were selected with a magnitude greater than 3. If we compare these images, we will see that the foci do not coincide by tens of degrees. There it is not even necessary to delve into the calculations, from the drawings and so everything is clear. But you can do a little additional analysis. In the table in the left column are the predicted data, in the right - the coordinates of the nearest epicenter, if the epicenter is closer than about ten degrees from the predicted point.
| Predicted | Actual |
| 24N 121E (large) | |
| 39N 123W | |
| 31N 115W | |
| 47N 67W | |
| 0.5S 78.5W | 3.34S 80.8W |
| 39N 28W | |
| 42N 13E | 42.8N 13.2E |
| 36N 4E | |
| 36.5N 22E | 40.1N 24.8E |
| 36N 70E | |
| 54N 164E | |
| 6N 126E | 3.8N 129.1E |
| 42S 172E |
Of the 13 events (one of them is strong), only 4 occurred within 1000 km. from the specified point, and only one fit into the 50 km square declared by the authors .
Did something coincide?
But one of them coincided to the degree! Did anything happen? No, everything is simpler, it does not fit the score by accident. As can be seen from the table of actual earthquakes, it just shook every day since September 10. Therefore, the probability of an event at that point on September 15 was too close to 1.
| Date | Latitude | Longitude | Magnitude |
| 09/15/2016 | 42.82 | 13.19 | 4.3 |
| 09/14/2016 | 42.73 | 13.18 | 3.2 |
| 09/13/2016 | 42.58 | 13.2 | 3.4 |
| 09/12/2016 | 42.8 | 13.22 | 3.2 |
| 09.11.2016 | 42.68 | 13.28 | 3.3 |
| 09/10/2016 | 42.79 | 13.24 | 3.1 |
| 09/10/2016 | 42.96 | 13.16 | 3.3 |
| 09/10/2016 | 42.84 | 13.26 | 3 |
Due to the apparent discrepancy between the two pictures - predicted and actual earthquakes, I do not see any further analysis, I can proceed to the conclusions.
Conclusion
Judging by the statistics, the predictions from these scientists have no power. Who exactly the authors are deceiving - people or themselves, remains unknown. But their graphs, in which they show the accuracy of predictions - do not correspond to reality.
This, in fact, correlates well with the work of USGS scientists who in recent studies have shown the impossibility of short-term forecasts, since the system is chaotic - due to the complex structure of the earth's crust, the disturbance increases exponentially. It's like with a bunch of sand - we pour it across a grain of sand, sooner or later the hill will crumble (long-term forecasts (years, decades) are made) - but we don’t know when this will happen (short-term (days and hours) are impossible). More and more interesting is written here in the section “Lessons from the past, doubts and hopes for the future”.
Source: https://habr.com/ru/post/397751/
All Articles