When did graphics become popular?

Modern newspapers are full of charts. The New York Times, The Washington Post and the Wall Street Journal spend huge amounts of money creating graphics in print and online versions.
But this was not always the case.
')
The New York Times first appeared in 1851. Almost from the beginning, the Times was filled to the brim with data such as stock reports, weather statistics, and sports scores. But the first hundred years it rarely appeared graphics.
To understand when graphs began appearing in newspapers, we collected data on a variety of graphs in various NYT publications. We checked out the September issues, which were issued on working days, every five years from 1855 to 2015. We chose the Times because it has good archives and it reflects well the trends of the newspaper industry.

The popularity of charts in the newspapers
Although statistical graphs were already regularly used by mankind by the beginning of the 20th century, we found exactly zero graphs in the issues of the newspaper before the 1930s. But in every newspaper after 1930 there was at least one graph, and in the editions of 2010 and 2015 there were already more than 20 graphs.
Now graphics are perceived as an essential tool of journalism. Why is it so slow?
Dark Ages (until 1930)
The modern statistical chart was invented by Scottish political economist William Playfair at the end of the 18th century. In a fit of amazing ingenuity from 1786 to 1801, Playifer created the first histogram, line chart and pie chart.
Historians believe that the development of statistical graphs by Playfair was a response to the sudden availability of a large amount of government and demographic data. Urgently needed effective ways of expressing the information collected - this niche was filled with graphics.
Data visualization from Playfera did not immediately become popular. At first serious scientists considered it to be children's fun.

The use of statistical graphs did not become widespread during the life of Playfera - he died in 1823. But by the beginning of the 20th century, the graphical presentation of data was already used in textbooks, it was used by governments, financiers and scientists. The French and American governments annually published statistics atlases filled with graphs.
But in the newspapers there were no graphics.
The newspaper had a lot of statistics. Journalists described trends in bond markets, activity in commodity markets and fertility. The numbers played an important role in the media, they simply did not visualize.

A table with data on cotton trade from 1865 and a note on fertility from 1915 today would certainly have been visualized.
Why, with so many digits in the newspapers, were there so few graphs?
Very few people have studied this question, and the most likely explanation will be a combination of technological difficulties and the lack of knowledge of statistical graphs among the general public.
In the first half of the 20th century, it was possible to create graphics manually only with the help of primitive technologies. The tools of the author were a ruler, special paper and compasses. A journalist would not make a schedule without first assessing whether it is worth the time.
And if the newspapers decided to publish the schedule, then the average person could not understand him. Data visualization was used in science, from officials, from scientists, but the average person was not trained to disassemble graphics. Charts in the first half of the 20th century were so rare that in 1913 a “parade of statistical graphs” took place in New York.

The era of business graphs (1930 - 1970)
July 4, 1933 can be called the day when data visualization became a permanent part of the media. Then, without any fanfare, the New York Times published data on the stock exchange as a line chart. Such a schedule is one of the most famous, it shows the patterns of stock behavior over the selected period.
Graphs have appeared in the newspaper before, but before that day it happened from one time to another. Sometimes there were no schedules in the newspaper at all. But since July 4, 1933, the Times published visualization almost every Thursday, Friday and Saturday (the markets were closed on Saturday and Sunday, so there were no schedules the next day). We also checked the LA Times and San Francisco Chronicle archives, and none of them published stock exchange charts until July 4, 1933. True, in the LA Times by that time some graphics had already appeared.
Even after the start of regular publication of graphs, they did not spread evenly over the newspaper for a long time. Until the 1970s, most of the graphs appeared in the business section.
Specifically, the vast majority of mid-century newspaper charts were line charts with commercial data, such as changes in the stock market, car production or power generation. It can hardly be considered a coincidence that the spread of graphics was gained during the Great Depression, at a time when readers were seriously concerned about US economic health.

Graph of 1940 showing trends in freight
It is not surprising that the graphics were originally only found in the business section of the newspaper. Business and the economy have always been at the forefront of graphical statistics, and the economy produces large amounts of data. The Wall Street Journal, focused on business, already in the early 1920s periodically produced graphics.
pix-media.s3.amazonaws.com/blog/1230/image02.png
Graph from the Wall Street Journal 1921
And even today, most of the schedules in Times can be found in the business section - 18 out of 25 in the newspaper dated September 16, 2015. This phenomenon can be traced across the entire spectrum of media (for example, The Economist publishes more charts than The New Yorker).
And although most of the graphs in the Times at that time were simple ruled, there were also more complex visualizations. The next chart from 1960 is an early example of a grid pattern, or side-by-side demonstrations of the same information for different groups. Such ingenious graphics foreshadowed the future.

Computerization and the emergence of non-business graphs (1980 - 2000)
The seeds of the explosion of graphs at the end of the 20th century were sown at the offices of IBM and Bell Labs decades before.
In the 1950s and 60s, engineers worked on programming languages that process statistical data (FORTRAN and S) and programs that simplify data visualization (SAS and Lisp-Stat). These new data analysis and visualization tools were understood only by a small number of programmers. But by the 1980s, programs like Lotus 1-2-3 and Microsoft Excel appeared. They allowed a large number of people to easily create graphics. Instead of drawing graphs by hand and using complex graphic terminals, journalists could create graphs on personal charts.

Graphic terminal
From 1950 to 1975 in newspapers there were on average two schedules per issue. From 1980 to 2005, their number increased to 10.
The type of graphs due to computerization has also changed. The following chart from the 1980 edition looks as clear as the modern ones.

Fans of visualization may notice an error made in the construction of the above graph: the Y axis does not start from zero, but from 380. This is misleading to an inexperienced reader about the absolute value of the presented values.
In the 1980s and 1990s, the Times was filled with examples of graphs that today can be called bad. For example, the following chart from 1995 demonstrates that the newspaper did not disdain the strange passion for 3D graphics (making it difficult for the reader to understand the essence of the data).

With the simplified creation of graphs and the spread of their understanding, they gained more and more space in the newspaper.
Until the 1990s, in our sample we found only one example of using graphics outside the business section. But since 1990, each issue has had at least one schedule that is not part of the business section. For example, on September 13, 1990, the Times had the following charts in the “City” and “Health” sections:

Modernity (since 2000)
By the end of the 2000s, graphics were central to the Times. The newspaper has a team of graphic reporters who insert innovative visualizations into the newspaper. In the web version, these visualizations are periodically interactive.
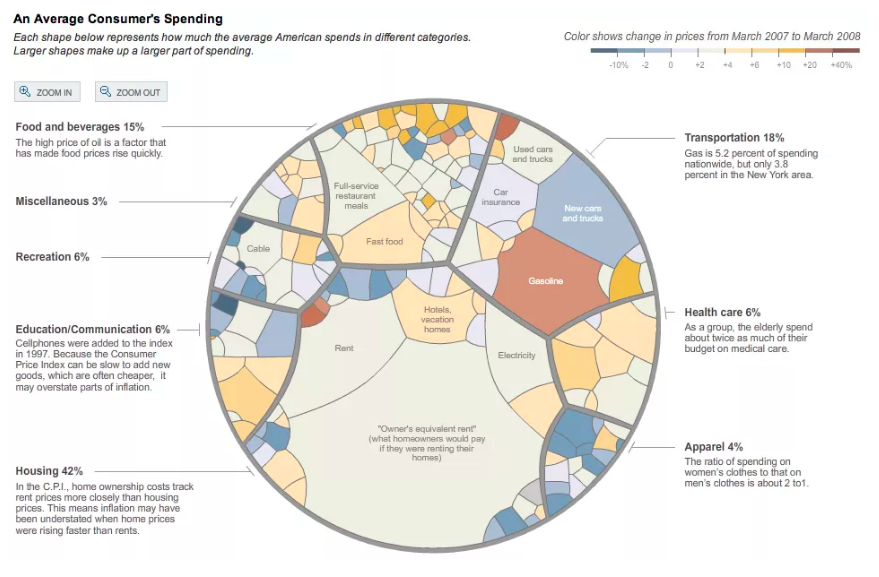
The following chart in the form of stained glass windows from 2008 shows the complexity of visual journalism. The graph shows inflation for the last year, divided by type of expenditure. Internet readers could point the mouse at different parts of it and receive additional information.
Over the past ten years, The Times has been at the forefront in developing complex statistical graphics, but the Washington Post, USA and Los Angeles Times have also devoted a lot of data visualization resources.
Newspaper graphics have become not only more complex, but also more frequent. In the September 14, 2010 issue of the New York Times there were 26 different schedules, seven of which were outside the business section. The image shows a set of all graphs of this release.

The New York Times secured the priority of visual journalism with the launch of the Upshot news site in 2014. The first project team consisted of 15 people and included three graphic journalists working full time. Amanda Cox, current site editor, started in the Times in 2004 as a graphic reporter.
Today, Upshot graphics are often central to the New York Times home page. Readers of the site dated September 9, 2016 were met by one of the versions of the histogram with a comparative estimate of the number of murders by city.

Over the last century, graphics have moved from the category of an incomprehensible tool for scientists to one of the main features of the main page. The revolution in visualization is mainly due to improved technology and increased data availability. Today, a newspaper without a schedule would no longer look like a newspaper.
Source: https://habr.com/ru/post/397683/
All Articles