The immense scale of being. Part 2, “Hitchhiker's Guide to the Universe”
Earlier this month, the European Gaia space telescope sent the result of three years of mapping our galaxy to Earth. This mission is a continuation of the centuries-old aspiration of mankind to reveal the secret of the scale of our world.
In the first part of this review, you learned about inventive methods for determining distances in the solar system. Next, I will acquaint you with the chronicle of the search and improvement of not less inventive methods for determining interstellar and intergalactic distances.
"The hunt for parallax"
')
By the end of the 17th century, few astronomers doubted the truth of the heliocentric model of our planetary system. Moreover, the parameters of the orbits of known planets became known with relatively high precision. Earth, relegated to the rank of ordinary planets, according to celestial mechanics, had an orbit with a diameter of 300 million km.
2000 years before this, Aristarkh, calculating the distance to the Sun, received a diameter of the Earth's orbit of 15 million km. But already then supporters of geocentrism brought counter-arguments to its heliocentric system, arguing that with such a fluctuation of the Earth in space, people should have noticed a change in the position of the nearest stars (stellar parallax).
Let me remind you that Aristarchus parried the counterargument, suggesting that the stars are so far from the Earth that the human eye is not able to notice the stellar parallax. The telescope invented at the beginning of the 17th century significantly expanded the capabilities of the human eye, however, systematic errors in observation and insufficient perfection of astronomical instruments delayed the “hunt” for stellar parallax until the beginning of the 19th century.

Predicted models of the angular parallax of stars depending on their angular inclination to the ecliptic plane (ie, the Earth's orbit).
However, already during this period significant changes are outlined in the worldview of the scientific world. At the beginning of the 18th century, Edmond Halley noticed his own movement of stars, comparing the star catalogs contemporary to him, with ancient Greek analogues (the change of coordinates of some stars exceeded the errors of the tables of antiquity). Even then, scientists made rough estimates of the distances to stars by their angular velocity (“the faster, the closer”).
Moving Sirius in the constellation Canis Major in the period between 170g to. n e. and the beginning of the 18th century. The angular path of the star during this period approximately corresponds to 1.5 visible lunar disks. The offset of the coordinate grid is caused by the precession of the earth's axis .
At the end of the 18th century, English astronomer William Herschel began to evaluate the order in which stars are removed from the Sun in proportion to their brightness. Noticing an increase in the concentration of stars in the plane of the Milky Way, Herschel suggested that our star system has a flattened appearance with a diameter of 15,000 light years. The unit in the light year was introduced by Herschel to measure interstellar distances and represents the path traveled by a ray of light during the earth year (9.4 trillion km.).
In 1837, in the year of A.S. Pushkin, a Russian astronomer of German origin, Vasily Struve, published his catalog of double stars, in which he first showed the measurement of Vega’s parallax of 0.125 seconds (the angular size of the base of the pyramid of Cheops, visible from the moon). Although subsequent measurements differed from the first, Struve is considered one of the first astronomers to calculate the distance to another star.
Next year, the German astronomer Friedrich Bessel will receive the value of the 61 Cygnus parallax, in 0.314 seconds, a little more than the modern (0.287). In the same year of 1838, English astronomer Thomas Henderson will receive the value of Alpha Centauri's parallax in 1.16 seconds (current estimate is 0.747).
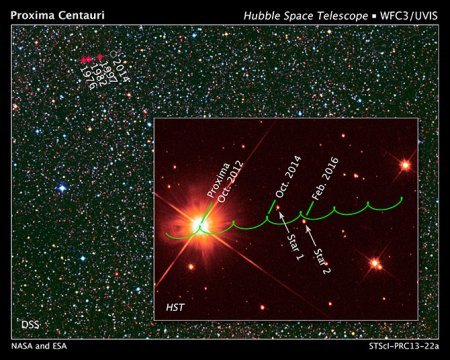
Angular motion of the star Proxima Centauri against the background of distant stars. Wave-like distortions are caused by the movement of the Earth around the Sun (change in the angular parallax).
Astonished by the work of his colleagues, English astronomer John Herschel (the son of William Herschel), describes the new milestone in the history of astronomy: "the wall that prevented our penetration into the stellar universe was almost simultaneously broken through in three places."
"Do not think of seconds down"
The scales were so large that even to a star with a parallax of 1 second, distances were measured in two hundred thousand astronomical units (AU = distance from Earth to the Sun). Therefore, the later steel distances are measured in parallax angular seconds (parsek for short), conventionally the distance from which the radius of the earth orbit is seen at an angle of 1 second (the angular radius of a CD-ROM disk from a distance of 50 km). 1 astronomical parsec is approximately equal to 3.26 sv. of the year.
By the end of the 19th century, parallaxes of about 100 stars were measured, but the introduction of photography into astronomy greatly simplified the process of obtaining stellar parallaxes. The method, developed by the American astronomer Schlesinger, reduced the calculation error to 0.01 seconds, making it possible to detect parallaxes of almost 2000 stars by 1924. Modern ground-based tools can reduce the error by another half to 0.005 seconds. Those. up to a distance of 650 light years.

The spacecraft Hipparch (left), named after the famous ancient Greek astronomer, was able to calculate the parallax of stars with an error of 0.001 second. Launched in 2013, the Gaia station (right) is engaged in calculating the parallax of the stars of our Galaxy with an accuracy of millionths of a second (for the least bright, hundreds of millions of fractions of a second!). Due to the resolution of the matrix, 10 times higher than that of the Kepler telescope, the station is able to detect up to 10,000 candidates for exoplanets.
Color chemistry
As you noticed, the parallax method at the end of the 19th and the beginning of the 20th century was applicable only at distances of a couple of hundred light years, the main part of the Galaxy remained inaccessible for determining the parallaxes. However, help came from the laboratory of chemists. In the 60s of the 19th century, astronomers began to use spectrography to determine the chemical composition of celestial bodies. So in 1866 the element helium was discovered (in the spectrum of the sun). The intensity of the spectral lines also made it possible to judge the temperature of the photosphere of the sun and stars.
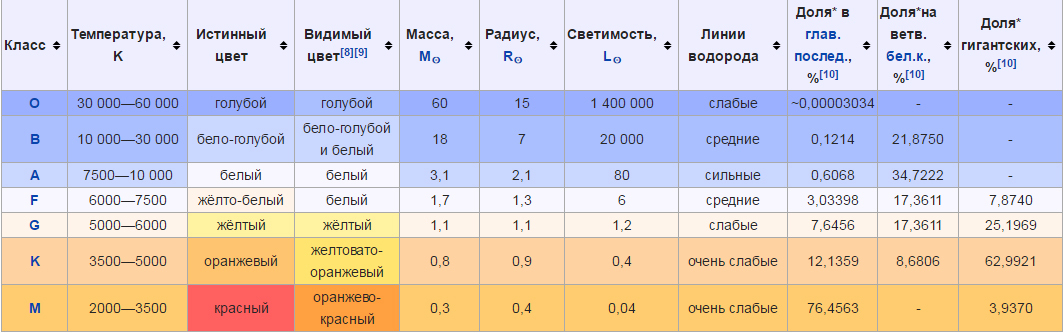
The Italian astronomer and priest Angelo Secchi, in 1866-1877, created the first spectral classification of stars depending on temperature, color and chemical composition. By the end of his life, in 1878, Secchi divided the stars into 5 classes. The spectral classification of Secchi stars was replaced by Harvard (1890), which still persists (table below).
Star shine
Since the days of Hipparchs, astronomers have divided stars into 6 classes of brightness, the so-called apparent stellar magnitudes (apparent brilliance). The brightest stars belonged to the first class, the least bright to the sixth. This produced a logarithmic brightness scale, in which each successive magnitude is 2.51 times brighter than the previous one. Today, all objects brighter than Vega have negative magnitudes, and the invention of the telescope expanded the scale of the least bright stars to 6–7 magnitudes.
By comparing the parallax of stars with their brightness, astronomers quickly realized that the stars differ greatly in the amount of energy emitted (luminosity). The brightest stars of the celestial sphere were not always the closest. For the convenience of comparing the intrinsic luminosity of the stars, the absolute magnitude was introduced, expressing its apparent magnitude from a distance of 10 parsecs from the star (32.6 light years).

The brightest star in the sky, Sirius, has an absolute stellar magnitude of 1.4 (in all emission spectra, the so-called bolometric magnitude, the apparent brilliance from 10 parsecs would be 10% below 1.8). For the Sun, this value is 4.83 (visible 4.7). Those. the luminosity of Sirius exceeds solar one by 25 times.
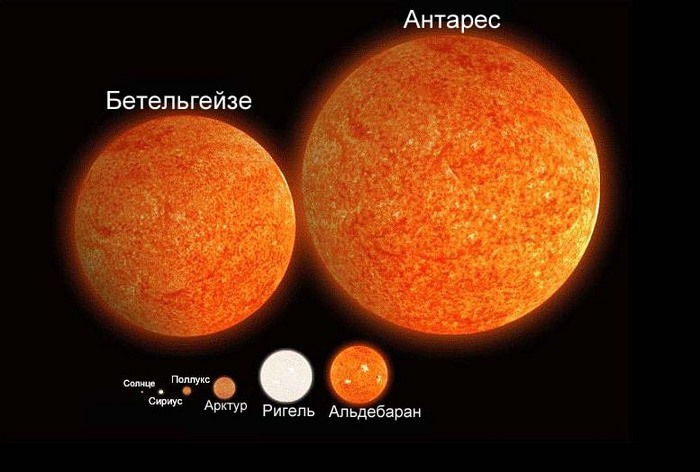
The size of the Sun and Sirius against the background of the stars of the giants. Antares is almost 1000 times larger than our star, however, both stars differ in mass only 10 times (the difference in the masses of Earth and Mars). Antares has a star companion Antares B. Thanks to the known parallaxes to relatively close binary stars, we managed to calibrate the mass-luminosity relationship.
"The pattern of chaos"
In 1910-1913, the Danish astronomer Einar Hertzsprung and his American counterpart Henry Russell, analyzing the physical data of stars with known parallaxes, independently came to an intriguing conclusion. Making a table of the ratio of the spectrum and luminosity, the scientists found that the stars are not arranged in a random order on the table, demonstrating a direct connection between the spectrum, temperature, color and luminosity of the stars.
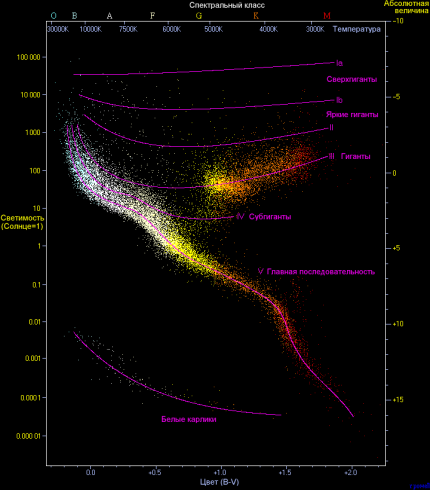
The diagram shows that the stars are divided into several groups (sequences). The sun, like most stars of the galaxy, is located in the Main sequence. Russell correctly decided that the diagram also reflects the stages of the life of stars.
The “color-luminosity” pattern, called the Hertzsprung-Russell diagram, allowed us to estimate their luminosity by the spectrum of stars. Knowing the luminosity, it was easy to determine the absolute magnitude of the stars with unknown parallaxes. Knowing the apparent magnitude at a distance of 10 parsecs from the star (M), and comparing it with the magnitude (m) visible from the Earth, it was easy to calculate the distance to it: 10 parsecs * 10 to the power (mM) / 5 (the so-called reduction of the main sequence).
The main problem of the spectral method lies in an approximate estimate of the luminosity of stars. Star clusters are best suited for this method, where the measurement error is partly compensated for by a large sample of stars (the error decreases to 20%, reducing to the main sequence the more accurately the larger the sample of stars). Moreover, this method can be calibrated by radial parallaxes of clusters close to us.
Behind the scenes of the Galaxy
Studying the angular velocities of the stars, the Dutch astronomer Jacobus Kaptein, in 1904, found that the stars move in two oppositely directed streams, which indicated the rotation of our star system. He also initiated the first ever large-scale study of the distribution of stars in our galaxy in terms of spectrum, brightness and radial velocity (the speed of an object along the observer’s line of sight).
Captain and the English astronomer James, based on a study of the movement of stars in the Milky Way, showed that it is not determined by Kepler’s laws. From the laws of the motion of the planets of Johann Kepler, we know that the orbital speed of objects decreases with increasing distance from the center. In our own galaxy, the speed of stars did not obey this pattern. From this, James and Kaptein came to the conclusion that the Milky Way has a large hidden mass (the beginning of the theory of dark matter).
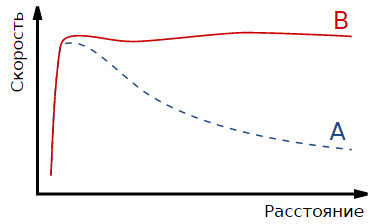
A is the velocity distribution of stars according to Kepler's laws. B - the real velocity distribution in the Milky Way.
This study helped assess the degree of absorption of light in interstellar space. Thus, by determining in a reliable way the distance to a certain star, as well as its spectral class, it was possible to calculate the distance to a more distant star of a similar spectral class. For this, the effect of “interstellar reddening” was taken into account, because of which the red part of the spectrum is most pronounced due to the lower absorption of red by interstellar gases and dust (not to be confused with the Doppler effect ). A similar effect is observed on Earth, at the zenith the color of the sun is perceived as white, blushing when approaching the horizon.
At the turn of the 30s, “interstellar reddening” allowed us to determine the size of our galaxy - 100,000 light years in diameter, and its center was located at a distance of about 30,000 sov. years old.
Navigation "candles"
One of the most common methods for determining distances in our galaxy belongs to a special class of stars with variable brightness. In 1908, the American astronomer Henrietta Leavitt, studying variable stars in the Small Magellanic Cloud, discovered an interesting pattern. Astronomers of that time already knew that the stars of this region belong to one star cluster and are equally distant from Earth. Based on this, Leavitt concluded that the period of fluctuations in the brightness of variable stars is directly related to their luminosity (the longer the period, the greater the luminosity).
In 1913, Hertzsprung derived the period-luminosity numerical dependence, identifying these variables with stars from the vicinity of the Sun, which had a similar spectrum and are known as Cepheids (after the first found star of this class of Cepheus Delta at the end of the 18th century). A little later, this relationship will be clarified by the American astronomer Shepley.

The period ratio table (P) is the absolute magnitude (Mv, mean value over the period) for Cepheids.
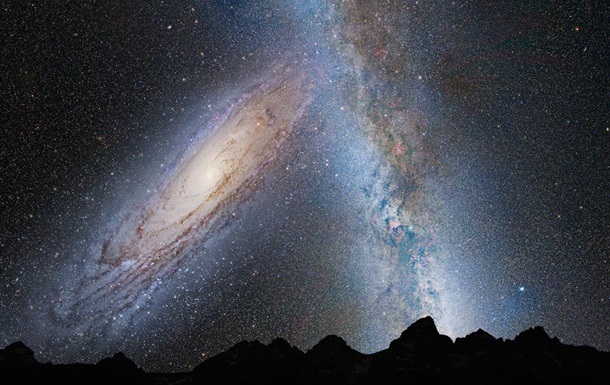
In the late 20s, another American astronomer Edwin Hubble, finding cepheids in the M31 nebula of the Andromeda constellation, first proved that this nebula is actually a separate galaxy.
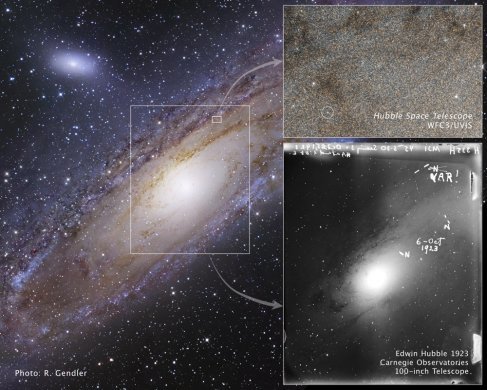
An old Cepheid shot in the M 31 galaxy, taken by Edwin Hubble (bottom right), against the backdrop of a modern Cepheid shot of the same orbital telescope.
"Cepheids have the wrong system"
By the mid-20th century, the scientific world was confronted with the paradox of the giant Milky Way. All the studied galaxies, to which it was possible to determine the distance by Cepheids (detection range up to 10 million light years) turned out to be significantly less than ours. Even the colossi among the elliptical galaxies, being larger than any other spiral galaxy, still turned out to be smaller than ours. In 1952, the German astronomer Walter Baade, who worked in the United States, comparing the size of gas and dust nebulae in our galaxy, as well as the spiral galaxies close to us, suggested revising the scale of intergalactic distances.
According to previous methods for determining interstellar distances, astronomers have already noticed that gas and dust nebulae in our galaxy have similar sizes. Baade suggested that such nebulae in the Andromeda galaxy should also have similar dimensions. According to their spectra and angular dimensions, the astronomer suggested that the distance to this galaxy should be doubled, from 800,000 sv. years old. to modern 2.5 million of sv. years, i.e. the absolute magnitude of this type of cepheid is underestimated 4 times. And the Cepheids used to determine the scale of our galaxy were predominantly those on the basis of which the initial calibration of Hertzsprung-Shapley was carried out and therefore the calculations were generally correct.
Today, Cepheids are divided into two types (chart below). The first type (classical, b Cep.), Represents the old stars, concentrated in open clusters. The second type of Cepheid W Virgin (W Vir.) Is concentrated mainly in globular clusters. Their luminosity is 4 times lower than the classic Cepheids. The use of the dependence of the period-luminosity type W Virgo to determine the distance to the classical Cepheid Andromeda and led to an error of the first calculations of intergalactic distances.


The Cepheid RS constellation Korma pulses with a period of 40 days. Due to the light echo of the surrounding nebula, the geometric method was definitely a distance of 6,500 light years, with a record error of 1.5% (for 2008). Such accuracy is very important for the calibration of “standard candles” distances, one of which is Cepheids.
The third type of variable stars with dependence period-luminosity is no longer attributed to Cepheids. These are the so-called red giants RR Lyra. These old stars with a mass of near solar surpass it in luminosity tenfold. Their pulsation period usually does not exceed one day (for cepheids tens and hundreds of days). Less bright than Cepheids, but more common, RR Lyra stars are great as “standard candles” for determining distances within the Milky Way.
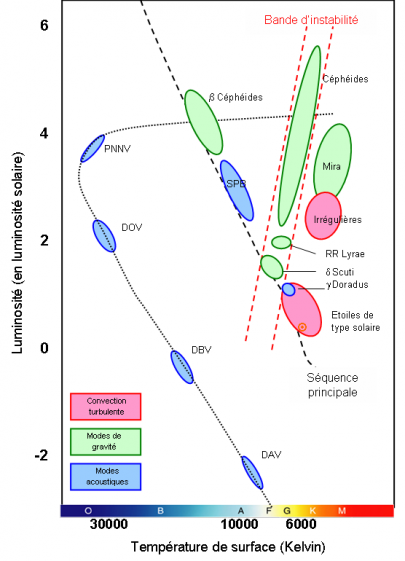
The number of different types of variables is not limited only to Cepheids and RR Lyra variables (indicated in green as pulsating due to gravitational contraction). Pink color covers variables with turbulent convection of the outer layers. The variable star brightness associated with acoustic shock waves is indicated in blue.
"Burp" universal scale
Despite the high brightness of Cepheids and the stars of the giants, their applicability as standard candles is not always possible. To determine the distance to more distant objects, astrophysicists resort to using ... star dwarfs, the size of our planet. White dwarfs represent the final stage of the evolution of stars with masses close to the sun. If there is an aging companion star next to such a “corpse”, white dwarfs turn into “zombies”, absorbing gases from the inflated outer layers of the neighbor. At a certain point, a white dwarf reaches a critical mass at which a large-scale thermonuclear carbon detonation occurs — a supernova explosion.
This type of supernovae belongs to class Ia, there are no hydrogen lines in their spectra, but calcium lines are strong.
At the moment of the explosion of class Ia, white dwarfs reach the same critical mass (Chandrasekhar limit) and, accordingly, have very close luminosity values (with the exception of type Iax). And as we already know, objects with a known luminosity are excellent standard candles for determining space distances (within 170 million light years).A similar process leads to the appearance of “new” stars (class Q), however, this type of “exploding” white dwarfs is hundreds of times dimmer than supernovae, and is not associated with carbon detonation when the Chandrasekhar limit is reached (as in type Ia).
82 ( Ia), 2014. , - . -: ( ), . „-“ . 82 .
In large galaxies, supernovae explode at a frequency of 30–70 years. About a third of them are type Ia. Ib / c types also do not have hydrogen lines in the spectrum; however, calcium lines are weak in them and the appearance of such supernovae is provoked by the gravitational collapse of a dying massive star (video below). The same nature and type II supernovae, however, unlike Ib, in their spectra are strong hydrogen lines. The supernova distances of the Ib, Ic, II-L classes and the new Q stars are mainly estimated by the brightness diminishing rates when the maximum visible brightness is reached.
“Red is far away”
In 1929, starting to determine intergalactic distances, Edwin Hubble discovered that the Doppler redshift of the spectra of galaxies found by his colleague and compatriot Slipher in 1912 is all the more noticeable the greater the distance to this galaxy (Hubble’s law). As we know, Hubble began to determine distances based on incorrect calibration of Cepheids, and therefore the acceleration factor of galaxies deduced by him was proportional to the distance (the Hubble constant) was too high.
Today, the Hubble law is interpreted by the cosmological redshift of the spectra of galaxies due to the expansion of the Universe. The Doppler effect in this case is caused by the expansion of the space in which the light wave propagates, and not by the motion of the galaxies themselves. Paradoxically, the cosmological redshift begins to noticeably manifest itself at greater distances than those with which Hubble operated, therefore its law was initially derived from the errors in the interpretation of observation. Determining the exact value of the Hubble constant (H = 67km / s / (Mpc)) varies with time, but it is the same at all points of the universe) allows you to determine the distance to galaxies at a distance from a billion light years and beyond. For this, the cosmological red shift in the spectra (z) is compared with the ratio of the speed of light to the Hubble constant.

As stated above, the speed of removal of galaxies (expansion of the space between us) is the more significant, the greater the distance. At a distance of billions of light years, this speed is such that the galaxy has time to increase the distance at times, during the path of the light wave. For example, the light from the Andromeda galaxy arrives to us for 2.5 million years, during which time the galaxy itself is approaching us “only” by 1000 St. years old.Therefore, we can say that the visible (aberrational, Dt) distance to M31 is practically the same as the real (concomitant, Dc). The situation is different with significantly distant galaxies. The aberration (Dt) and concomitant (Dc) distances roughly coincide to a distance of 2 billion St. years, and vary greatly when this scale is exceeded. In the popular literature, the value of the aberration distance is used more often, it is meant when the distance to the most distant objects of the universe is estimated at 13 billion St. years, while the concomitant distance (which the object has retired during the path of the light wave) is determined in tens of billions of light years. To the roots.

It is obvious that the accuracy of the adopted scale of cosmological distances directly depends on the accuracy of determining the Hubble constant. The value of this constant in turn depends on the calibration of various methods for determining distances within the local group of galaxies. The period-luminosity ratio of good old Cepheids remains the most accurate method for determining distances to local galaxies (the Hubble telescope often has to search for Cepheids from nearby galaxies).
Work is also actively continuing on calibrating distances to Cepheids within our Galaxy and its satellites, in particular, the Magellanic Clouds (this will make it possible to clarify the dependence period — luminosity). Thus, a change in the luminosity-period ratio with age of Cepheids has recently been found, as well as the need to take into account their mass loss. So it is very important for cosmology and theoretical physics to have an accurate distance calibration in our galaxy, which can be helped by the development of knowledge about the evolution of stars (improving the table of Herzsch Russell).
A key role in the scaling of our galaxy is played by space cartographers like “Hipparchus” and the still working “Gaia”, which recently sent a huge database of Milky Way objects to its creators (video above): positions of more than a billion stars, detailed parameters of 2 million of them . The star catalogs of standard candles were supplemented with light curves of 3 thousand variable stars (Cepheids and RR Lyrae).
Alphabet of 26 methods for determining space distances developed to date.
Doppler effect.
Cosmological scale of distances.
Variable stars
Étoile variable de type RR Lyrae.
Star That Changed the Universe Shines in Hubble Photo.
Source: https://habr.com/ru/post/397509/
All Articles