Another smart home, in several parts. Weather station from scrap materials
Looking through the various projects of weather stations, noticed one trend. This is either a temperature and humidity sensor, most often everyone's favorite Chinese DHT-11 or DHT-22, to which either an ambient light sensor is added ( Weather Station on Arduino with data visualization ) or pressure ( Ethernet Weather Station ), or purchased-heaped for many hundreds of dollars ( Automatic weather station in the country )
Since for me personally, a weather station without measuring the direction and speed of the wind is not a weather station, and I am not ready to spend about 700USD on a large toy, it was decided to do something like “expensive-tricked” but cheap.
')
Now about measuring the direction of the wind. There were many options, from optical encoders - factory (expensive) or self-made in the form of several pairs of LEDs and photodiodes, and a disc with Gray code (difficult and many components), to a magnet and 4-8 reed switches (too simple and inaccurate). As a result, the choice fell on the AS5040 - magnetic encoder. Since special precision is not needed, the analog output of the encoder is connected to the ADC of the microcontroller.

Microcontroller - PIC16F88. Exit - RS485 to the internal network of the smart home, about which this series of articles. The entire electronic part is assembled on three boards.

On this with electronics everything, no nuances, nothing interesting, everything is according to datasheets. We turn to the mechanics.
Unfortunately, there is no possibility to print the case on a 3D printer, and in factory cases with water resistance almost everyone has trouble. In addition, the bearings and everything else - the body of rotation, then the round case will be the most logical choice. I had to turn my attention to other areas - to the water supply. As a housing, a coupling sleeve “for 32” for sewage, and two nozzles for accommodating bearing assemblies are taken. Two brakes were machined from brass, in which two bearings 626 were pressed together.

Magnets ... A magnet for a speed sensor will fit almost anyone, but with a direction sensor it was more difficult. He needs a round magnet with magnetization from edge to edge

While the bulk of the marketers have different poles on different sides.

But it turned out that the necessary magnets are on the spindles of the motors of the CD / DVD drives.

Assembled bearing units look like

After manufacturing and assembling the boards, the sensors of wind speed and direction take the final look.

Since the weather station is still made from scrap materials, then for the impeller we cut tennis balls, we also make a weathervane from what we get under our arms. Paint in a radically black color, and it turns out.

As a rain sensor, we also use a half of a tennis ball, in which there are two contacts between two layers of geotextiles.

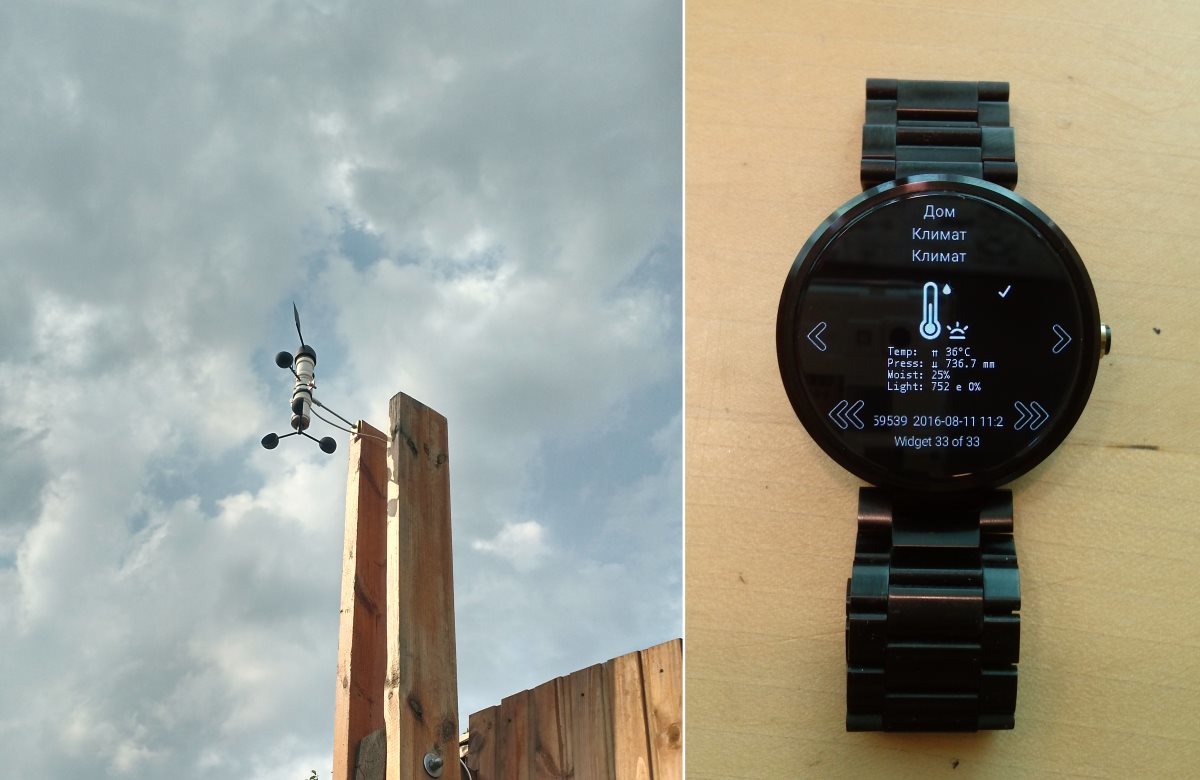
We assemble, connect and fasten higher

As I already told ( Another smart home, in three parts. Part three, user-interface ) there are two types of interface. The first view, in which almost all data from the device is displayed on the screen, looks like this

Temperature current, minimum, maximum, direction of change. The pressure is similar. Humidity. Wind - the direction and the rose of the winds. The numbers are needed more for debugging, show how much time in which sector the weather vane was. Wind speed, time, light sensor readings (without calibration, what ADC measured) and rain sensor. All data and processing are carried out in the weather station microcontroller.
The second type of interface is based on widgets. There is less data, temperature, humidity, pressure, wind speed and direction

And so far without Android Wear - on the clock

Due to the fact that once a minute all the controllers are polled with a record in the database, then any weather data is available for analysis or display in the form of graphs

Since for me personally, a weather station without measuring the direction and speed of the wind is not a weather station, and I am not ready to spend about 700USD on a large toy, it was decided to do something like “expensive-tricked” but cheap.
')
Electronics
- Temperature sensor - LM35. Included with the ability to measure negative temperatures

- Where can I go without it - DHT11 humidity and temperature sensor
- Pressure Sensor - HP03SA
- Light Sensor - Photo Resistor LXD5516
- Wind speed sensor - a common Hall sensor
Now about measuring the direction of the wind. There were many options, from optical encoders - factory (expensive) or self-made in the form of several pairs of LEDs and photodiodes, and a disc with Gray code (difficult and many components), to a magnet and 4-8 reed switches (too simple and inaccurate). As a result, the choice fell on the AS5040 - magnetic encoder. Since special precision is not needed, the analog output of the encoder is connected to the ADC of the microcontroller.
Microcontroller - PIC16F88. Exit - RS485 to the internal network of the smart home, about which this series of articles. The entire electronic part is assembled on three boards.
On this with electronics everything, no nuances, nothing interesting, everything is according to datasheets. We turn to the mechanics.
Mechanics
Unfortunately, there is no possibility to print the case on a 3D printer, and in factory cases with water resistance almost everyone has trouble. In addition, the bearings and everything else - the body of rotation, then the round case will be the most logical choice. I had to turn my attention to other areas - to the water supply. As a housing, a coupling sleeve “for 32” for sewage, and two nozzles for accommodating bearing assemblies are taken. Two brakes were machined from brass, in which two bearings 626 were pressed together.
Magnets ... A magnet for a speed sensor will fit almost anyone, but with a direction sensor it was more difficult. He needs a round magnet with magnetization from edge to edge
While the bulk of the marketers have different poles on different sides.
But it turned out that the necessary magnets are on the spindles of the motors of the CD / DVD drives.
Assembled bearing units look like
After manufacturing and assembling the boards, the sensors of wind speed and direction take the final look.
Since the weather station is still made from scrap materials, then for the impeller we cut tennis balls, we also make a weathervane from what we get under our arms. Paint in a radically black color, and it turns out.
As a rain sensor, we also use a half of a tennis ball, in which there are two contacts between two layers of geotextiles.
We assemble, connect and fasten higher
Interface
As I already told ( Another smart home, in three parts. Part three, user-interface ) there are two types of interface. The first view, in which almost all data from the device is displayed on the screen, looks like this
Temperature current, minimum, maximum, direction of change. The pressure is similar. Humidity. Wind - the direction and the rose of the winds. The numbers are needed more for debugging, show how much time in which sector the weather vane was. Wind speed, time, light sensor readings (without calibration, what ADC measured) and rain sensor. All data and processing are carried out in the weather station microcontroller.
The second type of interface is based on widgets. There is less data, temperature, humidity, pressure, wind speed and direction
And so far without Android Wear - on the clock
Due to the fact that once a minute all the controllers are polled with a record in the database, then any weather data is available for analysis or display in the form of graphs
Source: https://habr.com/ru/post/396641/
All Articles