We measure the concentration of CO2 in the apartment with the help of MH-Z19
Virtually any weather station, including cheap Chinese models for a few dollars, is able to measure the basic parameters of air - temperature and humidity. Carbon dioxide is becoming more complex: home appliances that can measure it are practically not commercially available. Complicating the situation is that CO2 is a colorless and odorless gas, so it’s almost impossible to feel its concentration “nose”.
Details and measurements under the cut.
The sensor MH-Z19 itself has already been described here on the site. It was based on the article " Review of the infrared CO2 sensor ", and this material is its logical continuation. About measuring the concentration of CO2 on the street was written here , but data on the concentration in the apartment there was not given. We fill this gap.
First of all, the following components were ordered on eBay:
- Arduino Micro ATmega32U4 3.3V (issue price $ 5). Since The sensor has a 3-volt logic, ordinary Arduino is better not to use.
- OLED LCD-display I2C 0.91 "128x32 (issue price $ 7). The display connects to standard Arduino i2c-pins.
- Actually sensor MH-Z19 (issue price $ 28).
- A set of wires with connectors for male contacts (issue price $ 1-2)
Thus, the total cost was ~ $ 40, or 2600r. A branded device from a well-known company costs about twice as much, although here it’s rather a matter of not saving, but technical interest.
')
The code for the Arduino was borrowed from the above article , the data output was added to the display, and for more convenient data analysis, the output was converted into a simple string with a separator. Timestamps were also added, each corresponding to 10 seconds.
All of this was put together, the sketch is filled into the arduin, the result looks like this:
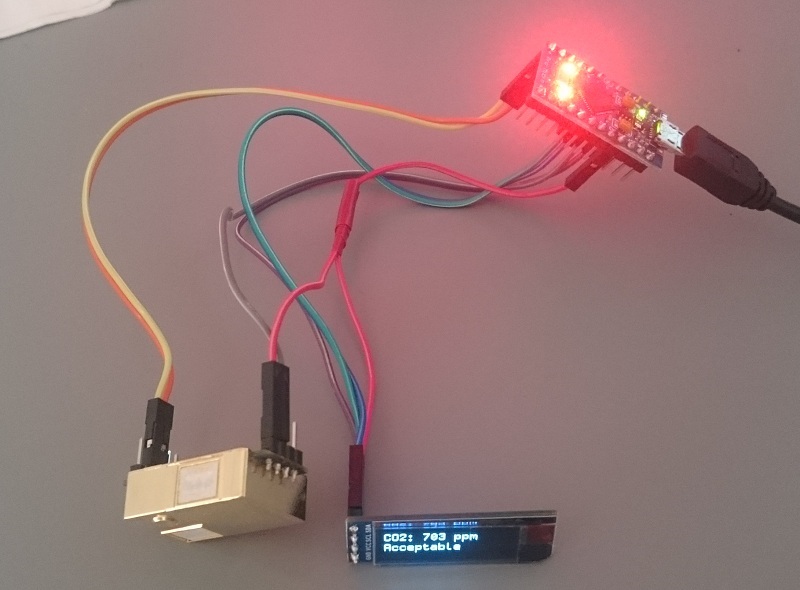
Of course, this is not the top of industrial design (in the plans to find some kind of case), but the device copes well for the task of a meter, capable of working both autonomously and transmitting data via USB. To receive data via USB, simply open the port monitor in the Arduino IDE and display data in it. Text from there can be copied and opened in any program, for example in Excel.
The next question is: what do we actually measure? The device provides data in ppm (parts per million, parts per million). 1000 ppm = 0.1% CO2 content. On the Internet you can find the following table of permissible concentrations:
- 350 - 450 ppm : Normal level outdoors.
- <600 ppm : Acceptable levels. Level. recommended for bedrooms, kindergartens and schools.
- 600 - 1000 ppm : Complaints about stale air, possible decrease in concentration.
- 1000 ppm : The maximum level of ASHRAE (American Society of Heating, Refrigerating and Air-Conditioning Engineers) and OSHA (Occupational Safety & Health Administration) standards.
- 1000 - 2500 ppm : General lethargy, decreased concentration, possible headache.
- 2500 - 5000 ppm : Undesirable health effects are possible.
Finally, the results. The sensor was placed in the kitchen, metal-plastic windows, the measurement time is about 8 hours.
The results were quite interesting. Horizontal time in seconds, 3600 seconds correspond to 1 hour.
The curves on the graph are deciphered as:
0h: readings about 420ppm (correspond to the street), there was nobody at home, I came from work and at the same time turned on the sensor.
0-2 hours: I am in the kitchen, it can be seen how in the presence of a person the concentration of co2 slowly grows somewhere up to 900ppm.
2-4 hours: I left the room, you can see how the concentration slowly decreases.
4-6 hours: I came back, the concentration began to grow again.
6th hour: a saucepan with dumplings is put on the stove. It is interesting to see how the concentration almost instantly increased to 1700ppm, then slowly began to subside. Although the gas did not burn for long (10-15 minutes), high levels> 1000 ppm last at least an hour.
End of the graph: a window was opened, and the co2 level fell almost immediately.
The device turned out to be quite interesting, and especially relevant for working at home at the computer. For example, during the writing of this article, the co2 level has grown indoors from 500 to 770ppm. Glancing at the screen makes either open the window more often, or finally think about the device in the house of normal ventilation (probably the micro-ventilation mode in the window would not be superfluous, but rather some kind of hood). If I were buying new windows now, I would probably think about a more or less high-quality model with normal ventilation.
It is also important to note the relevance of good ventilation in the kitchen: as the graph shows, even in 10 minutes one gas burner can “burn out” all the oxygen supply, bringing the CO2 concentration to very high. Measurements in the bedroom showed that in terms of ventilation, everything is not very good either: by the morning the co2 concentration is more than 1000 ppm, and for mental work, good sleep is very important.
In general, this simple and inexpensive device allows you to very effectively check the air quality in an apartment or office.
The author wishes everyone good health and good mood. Well, good air, of course, too.
Details and measurements under the cut.
The sensor MH-Z19 itself has already been described here on the site. It was based on the article " Review of the infrared CO2 sensor ", and this material is its logical continuation. About measuring the concentration of CO2 on the street was written here , but data on the concentration in the apartment there was not given. We fill this gap.
Iron
First of all, the following components were ordered on eBay:
- Arduino Micro ATmega32U4 3.3V (issue price $ 5). Since The sensor has a 3-volt logic, ordinary Arduino is better not to use.
- OLED LCD-display I2C 0.91 "128x32 (issue price $ 7). The display connects to standard Arduino i2c-pins.
- Actually sensor MH-Z19 (issue price $ 28).
- A set of wires with connectors for male contacts (issue price $ 1-2)
Thus, the total cost was ~ $ 40, or 2600r. A branded device from a well-known company costs about twice as much, although here it’s rather a matter of not saving, but technical interest.
')
The code for the Arduino was borrowed from the above article , the data output was added to the display, and for more convenient data analysis, the output was converted into a simple string with a separator. Timestamps were also added, each corresponding to 10 seconds.
Source
#include <SoftwareSerial.h> #include <Wire.h> // I2C OLED #include "SSD1306Ascii.h" #include "SSD1306AsciiWire.h" #define I2C_ADDRESS 0x3C SSD1306AsciiWire oled; // CO2 sensor: SoftwareSerial mySerial(8,9); // RX,TX byte cmd[9] = {0xFF,0x01,0x86,0x00,0x00,0x00,0x00,0x00,0x79}; unsigned char response[9]; void setup() { // Serial Serial.begin(9600); mySerial.begin(9600); // OLED Wire.begin(); oled.begin(&Adafruit128x32, I2C_ADDRESS); oled.set400kHz(); oled.setFont(ZevvPeep8x16); oled.clear(); oled.println("setup::init()"); } long t = 0; void loop() { mySerial.write(cmd, 9); memset(response, 0, 9); mySerial.readBytes(response, 9); int i; byte crc = 0; for (i = 1; i < 8; i++) crc+=response[i]; crc = 255 - crc; crc++; oled.clear(); if ( !(response[0] == 0xFF && response[1] == 0x86 && response[8] == crc) ) { Serial.println("CRC error: " + String(crc) + " / "+ String(response[8])); oled.println("Sensor CRC error"); } else { unsigned int responseHigh = (unsigned int) response[2]; unsigned int responseLow = (unsigned int) response[3]; unsigned int ppm = (256*responseHigh) + responseLow; Serial.print(String(t)); Serial.print(","); Serial.print(ppm); Serial.println(";"); if (ppm <= 400 || ppm > 4900) { oled.println("CO2: no data"); } else { oled.println("CO2: " + String(ppm) + " ppm"); if (ppm < 450) { oled.println("Very good"); } else if (ppm < 600) { oled.println("Good"); } else if (ppm < 1000) { oled.println("Acceptable"); } else if (ppm < 2500) { oled.println("Bad"); } else { oled.println("Health risk"); } } } delay(10000); t += 10; } All of this was put together, the sketch is filled into the arduin, the result looks like this:
Of course, this is not the top of industrial design (in the plans to find some kind of case), but the device copes well for the task of a meter, capable of working both autonomously and transmitting data via USB. To receive data via USB, simply open the port monitor in the Arduino IDE and display data in it. Text from there can be copied and opened in any program, for example in Excel.
Measurements
The next question is: what do we actually measure? The device provides data in ppm (parts per million, parts per million). 1000 ppm = 0.1% CO2 content. On the Internet you can find the following table of permissible concentrations:
- 350 - 450 ppm : Normal level outdoors.
- <600 ppm : Acceptable levels. Level. recommended for bedrooms, kindergartens and schools.
- 600 - 1000 ppm : Complaints about stale air, possible decrease in concentration.
- 1000 ppm : The maximum level of ASHRAE (American Society of Heating, Refrigerating and Air-Conditioning Engineers) and OSHA (Occupational Safety & Health Administration) standards.
- 1000 - 2500 ppm : General lethargy, decreased concentration, possible headache.
- 2500 - 5000 ppm : Undesirable health effects are possible.
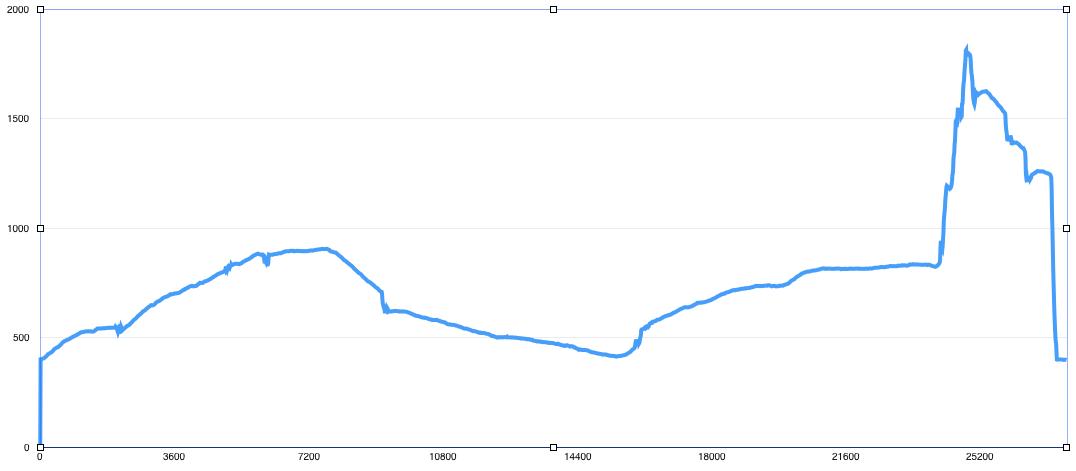
Finally, the results. The sensor was placed in the kitchen, metal-plastic windows, the measurement time is about 8 hours.
The results were quite interesting. Horizontal time in seconds, 3600 seconds correspond to 1 hour.
The curves on the graph are deciphered as:
0h: readings about 420ppm (correspond to the street), there was nobody at home, I came from work and at the same time turned on the sensor.
0-2 hours: I am in the kitchen, it can be seen how in the presence of a person the concentration of co2 slowly grows somewhere up to 900ppm.
2-4 hours: I left the room, you can see how the concentration slowly decreases.
4-6 hours: I came back, the concentration began to grow again.
6th hour: a saucepan with dumplings is put on the stove. It is interesting to see how the concentration almost instantly increased to 1700ppm, then slowly began to subside. Although the gas did not burn for long (10-15 minutes), high levels> 1000 ppm last at least an hour.
End of the graph: a window was opened, and the co2 level fell almost immediately.
findings
The device turned out to be quite interesting, and especially relevant for working at home at the computer. For example, during the writing of this article, the co2 level has grown indoors from 500 to 770ppm. Glancing at the screen makes either open the window more often, or finally think about the device in the house of normal ventilation (probably the micro-ventilation mode in the window would not be superfluous, but rather some kind of hood). If I were buying new windows now, I would probably think about a more or less high-quality model with normal ventilation.
It is also important to note the relevance of good ventilation in the kitchen: as the graph shows, even in 10 minutes one gas burner can “burn out” all the oxygen supply, bringing the CO2 concentration to very high. Measurements in the bedroom showed that in terms of ventilation, everything is not very good either: by the morning the co2 concentration is more than 1000 ppm, and for mental work, good sleep is very important.
In general, this simple and inexpensive device allows you to very effectively check the air quality in an apartment or office.
The author wishes everyone good health and good mood. Well, good air, of course, too.
Source: https://habr.com/ru/post/395755/
All Articles