Analyzer-visualizer spectrum audio signal based on the Arduino
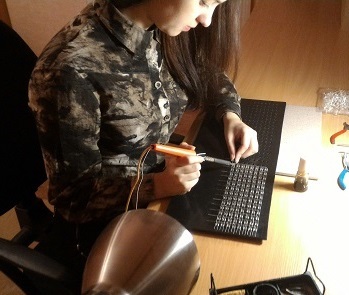
What do you think girls do when they get together? Go shopping, take pictures, go to beauty salons? Yes, it is, but far from all do so. In this article we will talk about how the two girls decided to assemble a radio electronic device with their own hands.
Why a spectrum analyzer-visualizer?
After all, there are a lot of software solutions to this problem and hardware implementation options are also quite a few. Firstly, I really wanted to work with a large number of LEDs (since we had already assembled a led cube, each for ourselves, but in small sizes), and secondly, to put into practice the knowledge gained in digital signal processing and, in third, once again to practice working with a soldering iron.
Device Development
Since it is boring and uninteresting to take a ready-made solution and do it strictly according to the instructions, so we decided to develop the scheme ourselves, relying only on the devices already created.
')
An 8x32 LED matrix was chosen as a display. It was possible to use ready-made led matrix 8x8 and collect from them, but we decided not to deny myself the pleasure to sit in the evening with a soldering iron, and therefore assembled the display themselves from LEDs.
To control the display, we did not reinvent the wheel and used a control circuit with a dynamic display. Those. selected one column, lit it, the remaining columns at that moment extinguished, then chose the next one, lit it, the others extinguished, etc. Due to the fact that the human eye is not perfect, we can observe a static image on the display.
Going along the path of least resistance, it was decided that it would be reasonable to transfer all calculations to the Arduino controller.
The inclusion of one or another row in a column is done by opening the corresponding key. To reduce the number of output pins of the controller, the column is selected through descramblers (so we can reduce the number of control lines to 5).

The TRS connector (mini-jack 3.5 mm) was chosen as the interface for connecting to a computer (or another device capable of transmitting audio signal).
Device assembly
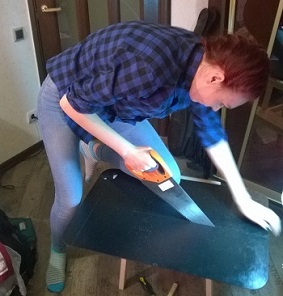
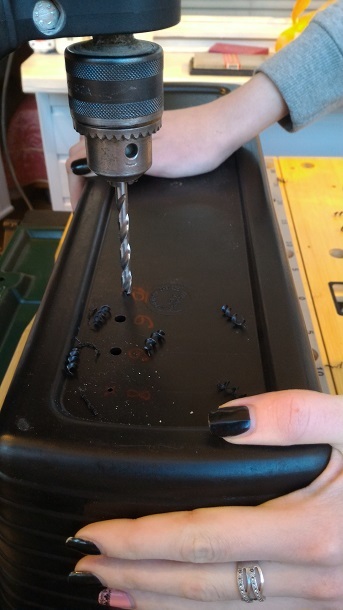
We start assembling the device by doing the layout of the front panel of the device.
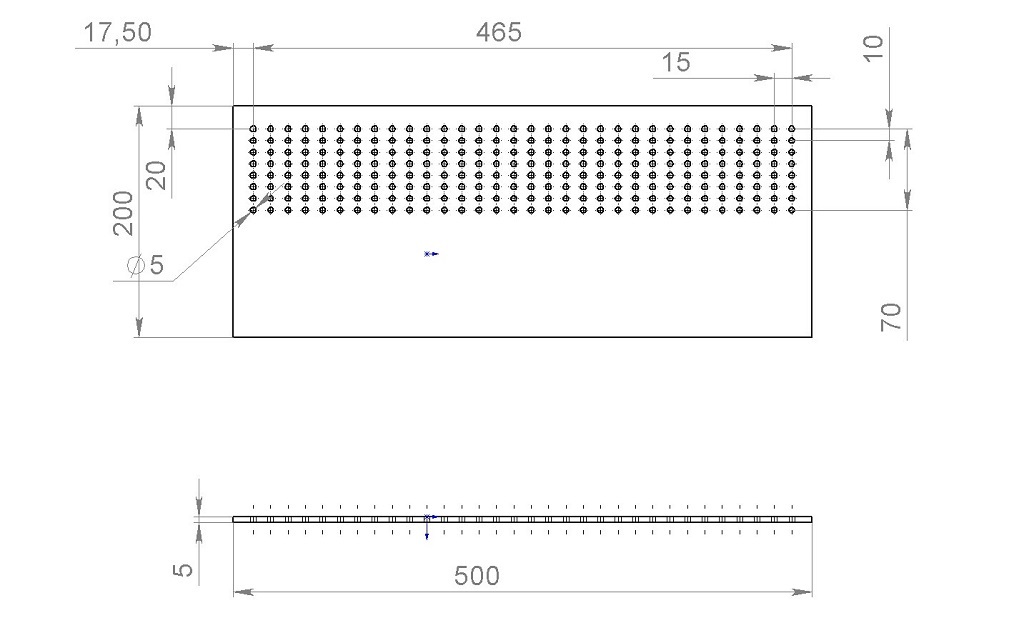
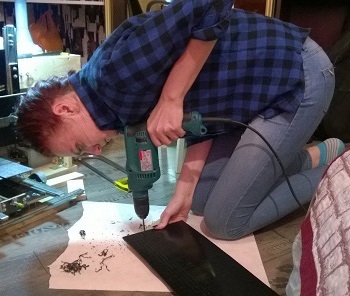
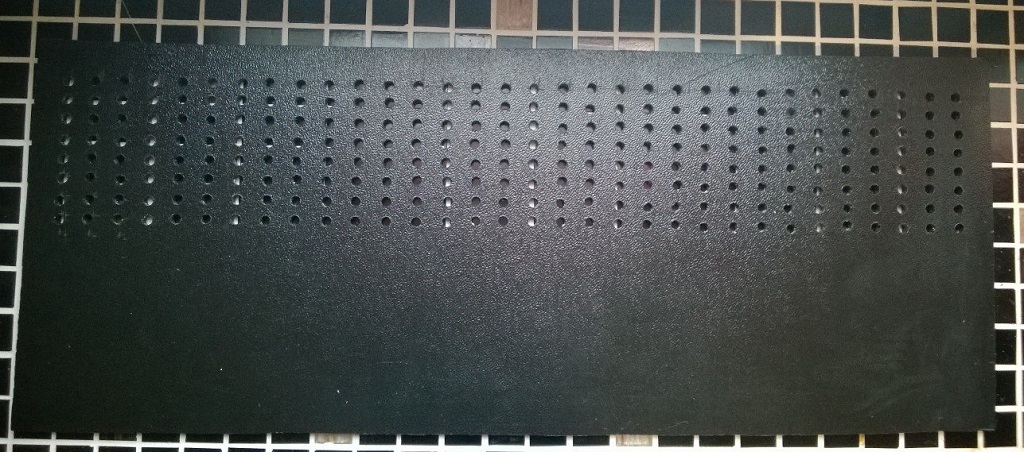
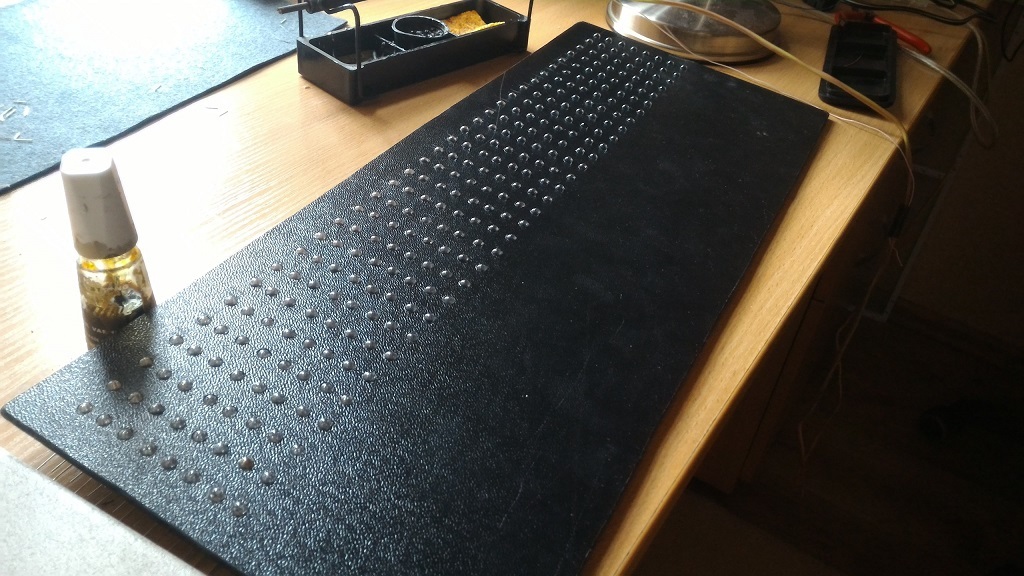
Black plastic 5mm thick was chosen as the material for the front panel (since the diameter of the diode lens is also 5mm). On the designed layout mark up, cut the front panel to the desired size and drill holes in the plastic under the LEDs.
Thus we get a ready-made front panel, on which you can already assemble the display.
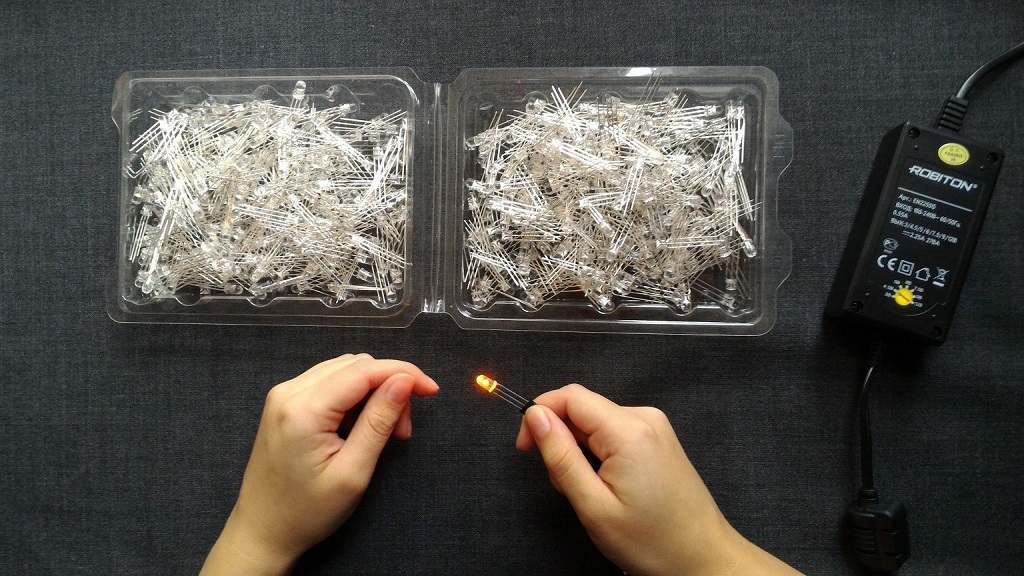
Two-color (red-green) LEDs with a common cathode GNL-5019UEUGC were used as LEDs for the matrix. Before starting the assembly of the matrix, guided by the rule “extra control does not hurt” all the LEDs, namely 270 pcs. (taken with a reserve just in case), were tested for efficiency (for this purpose a testing device was assembled, including a connector, a 200 Ohm resistor and a 5V power supply).
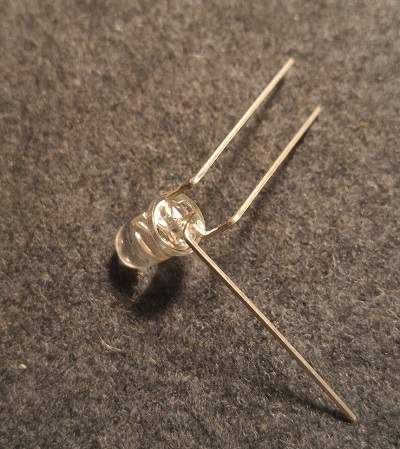
Next, unbend the LEDs as follows. Bend the anodes of the red and green diodes in one direction (to the right), turn the cathode in the other direction, while ensuring that the cathode is lower than the anodes. And then at 90 ° we turn the cathode down.
We start assembling the matrix from the bottom right corner, we assemble it in columns.
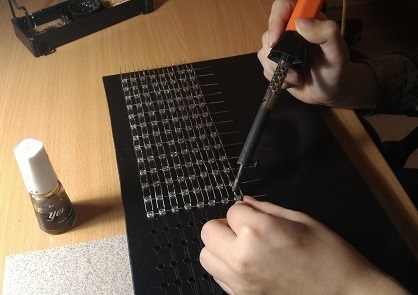
Recalling the rule “extra control does not hurt”, after one or two welded columns, we check the performance.
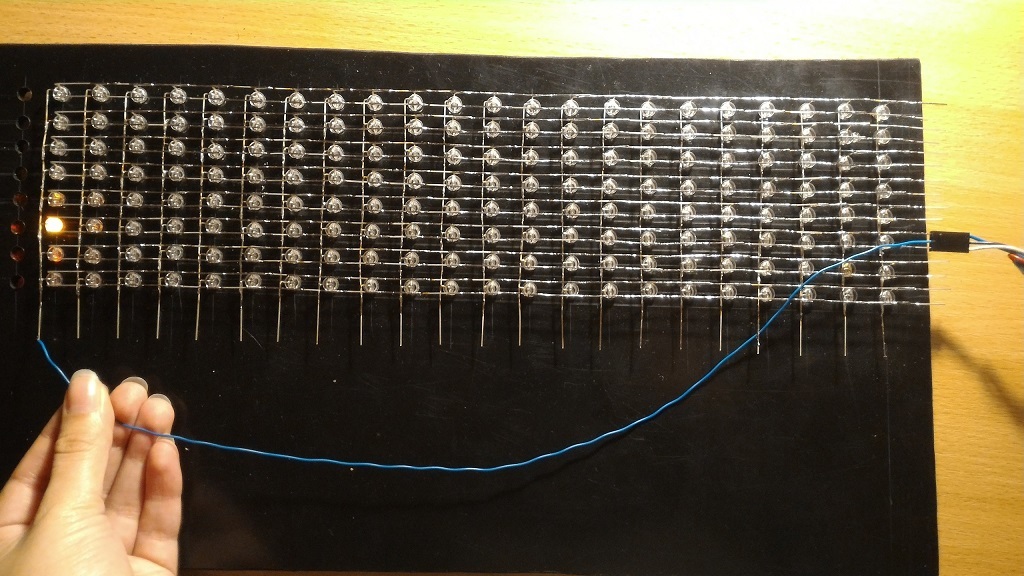
The finished matrix is as follows.
Back view:

According to the developed scheme we solder the control circuit of rows and columns, solder loops and space for Arduino.
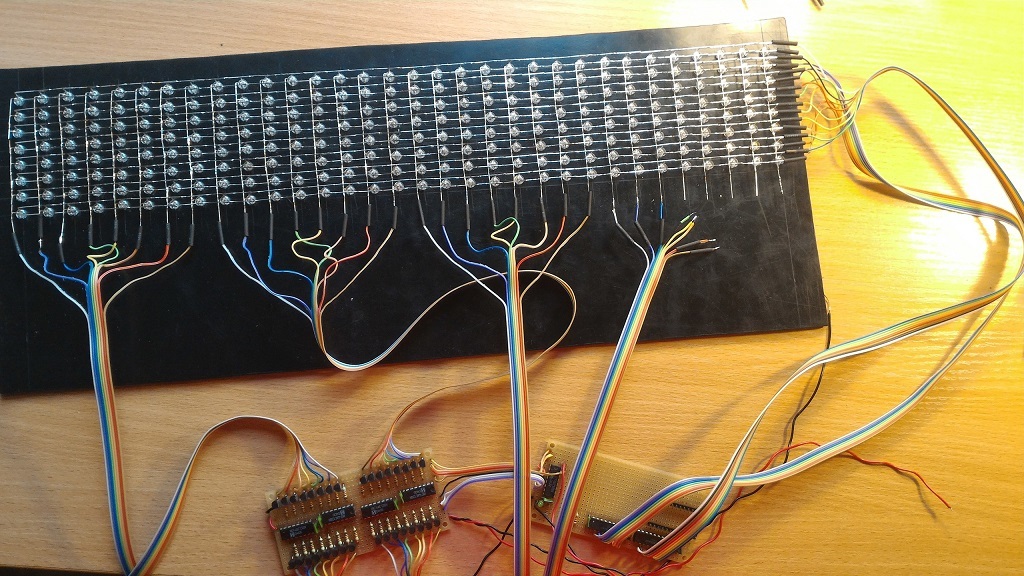
It was decided to also output not only the amplitude-frequency, but also the phase-frequency spectrum, as well as select the number of samples to display (32,16,8,4). For this, 4 switches were added: one to choose the type of spectrum, two to choose the number of samples, and one to turn the device on and off.
Writing a program
Once again, we follow our rule and make sure that our display is fully operational. To do this, we write a simple program that completely lights up all the LEDs on the display. Naturally, according to Murphy's law, several LEDs did not have enough current, and they had to be replaced.

Having made sure that everything works, we started writing the main program code. It consists of three parts: initializing the necessary variables and reading the data, obtaining the signal spectrum using the fast Fourier transform, outputting the obtained spectrum with the necessary formatting to the display.
Assembly of the end device
In the end, we have a faceplate, and under it are a bunch of wires that need to be closed with something, and the switches need to be fixed on something. Before that, there were thoughts to make a body out of plastic remnants, but we didn’t quite know how it would look and how to do it. The solution came quite unexpectedly. Walking through the construction store, we found a plastic flower pot, which is surprisingly perfect in size.

The case remained for small, mark the holes for connectors, cables and switches, as well as cut the two side panels of plastic.
In the end, putting it all together, connecting the device to a computer, we got the following:
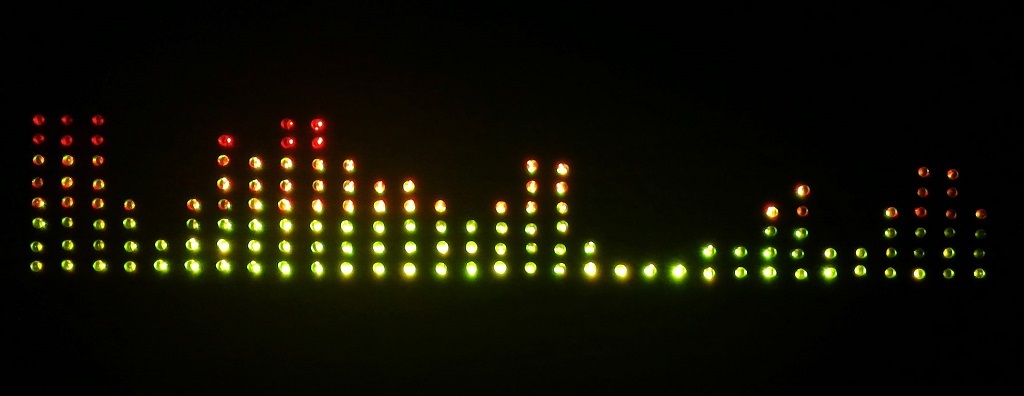
Amplitude-frequency spectrum (32 counts):

Amplitude-frequency spectrum (16 readings):

Amplitude-frequency spectrum (8 readings):

Amplitude frequency spectrum (4 readings):

Phase frequency spectrum:

Rear view:

Device video
For greater clarity, the video was filmed in the dark. On the video, the device displays the amplitude-frequency spectrum, and then for 7 seconds we switch it to the phase-frequency spectrum mode.
List of required items
- LED GNL-5019UEUGC - 256 pcs. (For display)
- Npn KT863A Transistors - 8 pcs. (To manage strings)
- Pnp C32740 transistors - 32 pcs. (To manage columns)
- 1kΩ resistors - 32 pcs. (To limit the current base pnp transistors)
- Decoders 3/8 IN74AC138 - 4 pcs. (To select a column)
- Decoders 2/4 IN74AC139 - 1 pc. (For cascading decoders)
- Mounting plate 5x10cm - 2 pcs.
- Loops
- Arduino Pro micro - 1 pc.
- Connector mini-jack 3.5mm - 1 pc.
- Switch - 4 pcs.
- Black plastic 720 * 490 * 5 mm - 1 sheet. (For the front panel)
- Black flower pot 550 * 200 * 150 mm - 1 pc. (For the case)
Source: https://habr.com/ru/post/395289/
All Articles