“Mom, he counted me!”, Or where the legs grow from the analysis of pedestrian traffic
Recently, there was news that a program to collect data on pedestrians by billboards was launched in the USA in order to determine their target audience. Immediately began the discussion about the ethics of collecting GSM-data and about what private data will be leaking. But I want absolutely not in line with this discussion to tell a little about the history of the issue and how it is possible to use the information about the street crowd in one way or another for the benefit of the city and its inhabitants.

Let's start from the beginning. Methods for analyzing pedestrian traffic appeared in the last century, and instead of data towers, GSM used the free work force of students, who, as part of their coursework, wrote and scribbled out thousands of sheets of sheets in a checkered, striped and A4. Only here is the problem, all the people are so different, and everyone on the street is engaged in all his private incomprehensible things. Such disparate information is inconvenient to process, and where to catch significant patterns, and will they be the same in different cases?
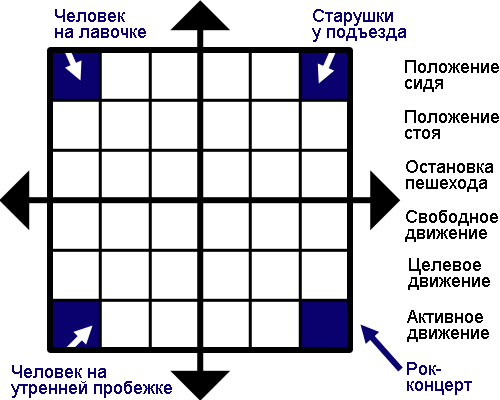
How to unify data on the unorganized mass of the people? The easiest option is to discard the very “private data” that is so dear to their owners. For example, you can use the methodology of the Soviet scientist A. V. Krasheninnikov : focus on the density of people in the territory (horizontal axis) and the intensity of their movement (vertical axis). It turns out this “diagram of environmental behavior”, on which there will be a place for any kind of human activity:
')
These four squares are, for example, not related to each other. In a real situation, more complex and recognizable images are obtained:
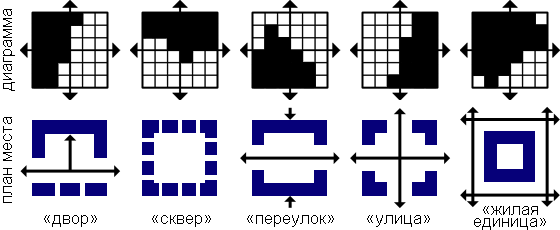
Surprisingly, even with only two parameters, you can create a “portrait” of a place, understand what people want from it, whether their surroundings are satisfying, and what it is worth changing. The shape, size of the space, obstacles to visibility or passage affect the graphics very much: different places attract different people and stimulate different activities. Such schemes are used whenever possible for the reconstruction of old quarters, and for designing new ones - spatial control patterns developed on their basis.
At the current level of information processing, you can easily add 2 more parameters: gender and age. Encode the floor with the shape of the mark on the chart, and age - color. A portrait of an ordinary courtyard might look something like this:

Most likely, the result of "surveillance" by the billboards will be about such "portraits" of the urban environment around them. A kind of fast-readable code, “nothing personal.” Easy to process and find patterns. And - unlike the ubiquitous QR codes - this one can be read with the naked eye.
If you add the fifth parameter — time — you can track that at different hours of the day, days of the week, and seasons the same places attract different people. This is engaged in such a promising area of science as ritmanalysis. There are also examples of practical use of ritmanalysis, for example, Californian Santa Cruz introduced a program that makes up a route for patrol cars, based on crime statistics on the streets, taking into account the days of the week, time of day, football matches on TV, etc. There are examples of this on cellular data . And in general, the prediction of crimes now is a very popular area.
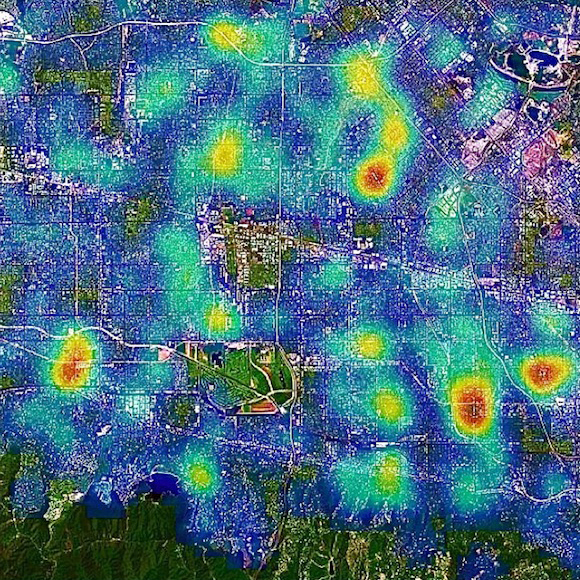
Map of the prediction of offenses in Santa Cruz.
It is curious that initially one of the applications of the Krasheninnikov method was precisely the improvement of the criminogenic situation in residential areas: the algorithm he developed made it possible to find attractive places for asocial citizens and to “recode” them. However, at a time when computers were large and programs were small, the program offered by them was never written. It is quite possible to analyze manually, but for a long time and boringly. In addition, the data that can be obtained from the map is often not enough: people love to “alter” the inconvenient spaces, using them for other purposes, and to find out, you need long-term direct observation. But not all the same to mock the poor students? At the present stage of development of technology, it became possible to automate this part of the work, for example, analyzing video recordings or focusing on cellular data.

A hand-built map of the social control zones of one large block on a 25 x 25 m grid. Beauty, you can hang on the wall. Classic abstraction Pete Mondrian endorses.
If it is possible to operate with GSM tower data, it is possible to track not static “cuts”, but dynamic “tracks”, and the results become more interesting. For example, in the Dublin laboratory, IBM Research wrote an algorithm for analyzing the traffic of people using public transport, which was tested on the example of the 4.5 million city of Abidjan and improved the traffic situation , reducing waiting times and trips by an average of 10% for all residents. Information from December 2011 to April 2012 was collected and provided for research by the operator Orange. The database includes 2.5 billion records and is cleared of any personal information.
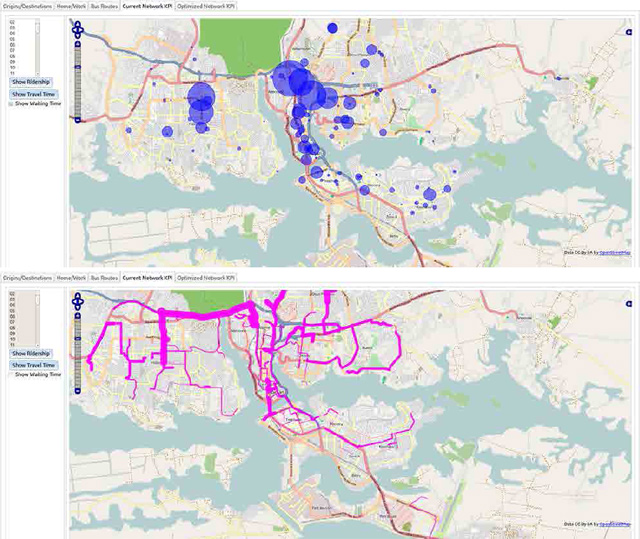
In the upper figure - the waiting time at stops, at the bottom - the load of routes.
In general, the devil is not so terrible as he is painted: significant positive results of total surveillance do exist. Of course, advertising companies are now claiming the role of world evil and are already approaching the critical level described by E. Griffith in his “Listen, Listen”, by G. Kuttner in the book “The Day Doesn't Count”, by F. Paul in “Merchants of Venus” or R. Russell in the “Room”. Of course, geomarketing is not going anywhere in our lives, but there is also the likelihood that the data collected by the billboards will become public property, as is the case with Abidjan, and then everyone who invented the new analysis algorithm will be able to test it, learn something new about the face of the city - and even change its expression for the better.

Let's start from the beginning. Methods for analyzing pedestrian traffic appeared in the last century, and instead of data towers, GSM used the free work force of students, who, as part of their coursework, wrote and scribbled out thousands of sheets of sheets in a checkered, striped and A4. Only here is the problem, all the people are so different, and everyone on the street is engaged in all his private incomprehensible things. Such disparate information is inconvenient to process, and where to catch significant patterns, and will they be the same in different cases?
How to unify data on the unorganized mass of the people? The easiest option is to discard the very “private data” that is so dear to their owners. For example, you can use the methodology of the Soviet scientist A. V. Krasheninnikov : focus on the density of people in the territory (horizontal axis) and the intensity of their movement (vertical axis). It turns out this “diagram of environmental behavior”, on which there will be a place for any kind of human activity:
')
These four squares are, for example, not related to each other. In a real situation, more complex and recognizable images are obtained:
Surprisingly, even with only two parameters, you can create a “portrait” of a place, understand what people want from it, whether their surroundings are satisfying, and what it is worth changing. The shape, size of the space, obstacles to visibility or passage affect the graphics very much: different places attract different people and stimulate different activities. Such schemes are used whenever possible for the reconstruction of old quarters, and for designing new ones - spatial control patterns developed on their basis.
At the current level of information processing, you can easily add 2 more parameters: gender and age. Encode the floor with the shape of the mark on the chart, and age - color. A portrait of an ordinary courtyard might look something like this:
Most likely, the result of "surveillance" by the billboards will be about such "portraits" of the urban environment around them. A kind of fast-readable code, “nothing personal.” Easy to process and find patterns. And - unlike the ubiquitous QR codes - this one can be read with the naked eye.
If you add the fifth parameter — time — you can track that at different hours of the day, days of the week, and seasons the same places attract different people. This is engaged in such a promising area of science as ritmanalysis. There are also examples of practical use of ritmanalysis, for example, Californian Santa Cruz introduced a program that makes up a route for patrol cars, based on crime statistics on the streets, taking into account the days of the week, time of day, football matches on TV, etc. There are examples of this on cellular data . And in general, the prediction of crimes now is a very popular area.
Map of the prediction of offenses in Santa Cruz.
It is curious that initially one of the applications of the Krasheninnikov method was precisely the improvement of the criminogenic situation in residential areas: the algorithm he developed made it possible to find attractive places for asocial citizens and to “recode” them. However, at a time when computers were large and programs were small, the program offered by them was never written. It is quite possible to analyze manually, but for a long time and boringly. In addition, the data that can be obtained from the map is often not enough: people love to “alter” the inconvenient spaces, using them for other purposes, and to find out, you need long-term direct observation. But not all the same to mock the poor students? At the present stage of development of technology, it became possible to automate this part of the work, for example, analyzing video recordings or focusing on cellular data.
A hand-built map of the social control zones of one large block on a 25 x 25 m grid. Beauty, you can hang on the wall. Classic abstraction Pete Mondrian endorses.
If it is possible to operate with GSM tower data, it is possible to track not static “cuts”, but dynamic “tracks”, and the results become more interesting. For example, in the Dublin laboratory, IBM Research wrote an algorithm for analyzing the traffic of people using public transport, which was tested on the example of the 4.5 million city of Abidjan and improved the traffic situation , reducing waiting times and trips by an average of 10% for all residents. Information from December 2011 to April 2012 was collected and provided for research by the operator Orange. The database includes 2.5 billion records and is cleared of any personal information.
In the upper figure - the waiting time at stops, at the bottom - the load of routes.
In general, the devil is not so terrible as he is painted: significant positive results of total surveillance do exist. Of course, advertising companies are now claiming the role of world evil and are already approaching the critical level described by E. Griffith in his “Listen, Listen”, by G. Kuttner in the book “The Day Doesn't Count”, by F. Paul in “Merchants of Venus” or R. Russell in the “Room”. Of course, geomarketing is not going anywhere in our lives, but there is also the likelihood that the data collected by the billboards will become public property, as is the case with Abidjan, and then everyone who invented the new analysis algorithm will be able to test it, learn something new about the face of the city - and even change its expression for the better.
Source: https://habr.com/ru/post/391519/
All Articles