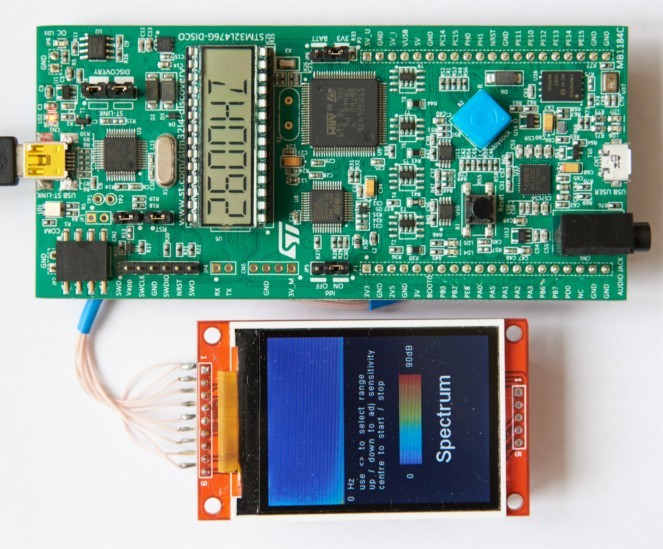
Measuring Harmony - Audio Spectrum Analyzer on STM32L4 Discovery
In the previous publication, we connected a cheap Chinese LCD screen to the STM32L4 Discovery board. Now we will try to implement on this combination something that goes beyond the traditional blinking of the LED, namely the sound spectrum analyzer, which uses the microphone on the board. At the same time I will tell you how to use the FreeRTOS operating system, and why it is needed, as well as why there are 12 notes in the musical octave, and why 53 notes are better than 12.
')
We want to receive a signal from a microphone, calculate its spectrum using a fast Fourier transform (FPU to help us) and show the result on the LCD as a 'color waterfall'. The sound power will be color coded. We will draw a row of pixels from the edge of the display, where the leftmost pixel will correspond to the minimum frequency, and the rightmost one will correspond to the maximum, while the previous picture will be shifted by one line, freeing up space for a new line. Our microcontroller is too complicated to start from scratch, so let's start with an example from the STM32Cube suite, which is called DFSDM_AudioRecord. What is DFSDM? This is Digital Filter for Sigma-Delta Modulation. The fact is that, unlike the good old analog microphones, the one that stands on the Discovery board does not generate a signal in the form of a voltage proportional to sound pressure, but in the form of a sequence of zeros and ones with a clock frequency of several megahertz. If you skip this sequence through a low pass filter, you get the same analog signal. In previous models, microcontrollers had to do a digital filter to get a sound signal in digital form. Now the microcontroller has a special module for this, and all that is required is to configure it at the start of the program. To do this, you can either delve into reading the documentation, or use a ready-made example. I went the second way. The following picture illustrates the internal structure of the DFSDM_AudioRecord program.

Digitized sound using DMA gets into the ring buffer. DMA causes an interrupt twice: once - when the buffer is half full, second time - when it is full. The interrupt routine simply sets the appropriate flag. The main () function, after initialization, executes an infinite loop where these flags are checked and, if the flag is set, the corresponding half of the buffer is copied. The example copies the data to another buffer, from where they, again using DMA, are sent to the headphone amplifier. I left this functionality by adding a sound spectrum calculation.
The straightforward way to add new functionality to our code is to add more flags and write functions that will be called if these flags are set. The result is usually a mess of checkboxes, handler functions, and a global context that is forced to be global, since the solution of one task is divided into many small steps implemented by separate functions — event handlers. An alternative way is to entrust task management to the operating system, for example, FreeRTOS. This allows you to significantly simplify the logic due to the fact that each task is solved within its event-processing cycle, which interact with each other through the functions of the operating system. For example, we can add a data processing task in the form of a separate cycle that will wait for the data to be ready at the synchronization primitive - the semaphore. The semaphore is very simple: you can pass it if the flag is raised, and the flag is automatically lowered. Raise the checkbox in our case data source when it prepares data for another task. Similarly, you can create arbitrary chains of data source tasks and data consumer tasks in the same way as, for example, in the Linux operating system.
Of course, the simultaneous execution of tasks is an illusion, especially when the computational core is only one. In this case, we can say that we have a single thread of program execution by the processor. Semaphores, like other synchronization primitives, play the role of a magical rabbit hole, into which the flow of execution falls, in order to emerge in another task.
Connecting FreeRTOS to your project is quite simple. It is only necessary to replace the infinite loop, which usually ends the main () function in the microcontroller, with a call to osKernelStart (). After that, the compiler will explain to you exactly what it lacks for compilation. All actions that you previously performed in a loop need to be transferred to a separate task and registered with a call to xTaskCreate. After that you can add as many tasks as you like. It should be borne in mind that between calls xTaskCreate and osKernelStart it is better not to place any code that works with hardware, because here the system timer may not work correctly. Calling the operating system timer handler osSystickHandler () should be added to SysTick_Handler (), and two functions SVC_Handler and PendSV_Handler should be removed from their code, since they are implemented in the OS code. When registering tasks it is important not to make a mistake with the stack size. If it is too small, you will get a crash in the most unexpected places. When the stack overflows, the structure that describes the task suffers first. In IAR there is an opportunity to see the list of tasks. If you see in it a task with a changed name, then you need to increase the size of the stack.
To calculate the spectrum, we use the fast Fourier transform. The corresponding function is already in the library. It receives a buffer filled with complex data, and forms the result in the same place. Accordingly, at the input it needs a buffer, where the digitized sound alternates with zeros (complex part 0). At the output we get complex numbers for which we immediately calculate the square of the module, adding the squares of the real and imaginary parts. We do this for only half the buffer, because the spectrum is symmetrical. We would need the second half if we wanted to do the inverse transform, but for a simple display of the spectrum it is not needed. Some additional efforts are needed in order to be able to calculate the spectrum in different spectral ranges. To get a low-frequency spectrum, I accumulate data over several buffer read cycles, effectively reducing the audio sample rate, which is initially 44.1kHz. The result is 6 bands - 20kHz, 10kHz, 5kHz, 2600Hz, 1300Hz, 650Hz. To switch ranges, use the joystick and a separate task. The joystick also performs the functions of starting / stopping the waterfall, as well as adjusting the sensitivity. It is more convenient to show the spectrum in logarithmic units (decibels), since its dynamic range is usually very large, and on a linear scale we can only distinguish the strongest components of the spectrum. The logarithm is considered quite a long time even on FPU, so I replaced the real logarithm with a piecewise linear approximation, which is easy to get, knowing the format for representing a number in float32 . The high bit is a sign. The next 8 bits are the binary exponent plus 127. The remaining bits are the fractional part of the mantissa, with the integer part equal to 1 (omit the nuances of the denormalized numbers for simplicity). So, selecting the exponent from float32 and grabbing a few higher bits of the mantissa, you can get a good approximation of the logarithm. We will convert the resulting number using a pre-prepared table into an RGB code for display on the LCD. It turns out the color scale of 90 or 60 decibels. The volume level corresponding to this scale zero can be adjusted by pushing the joystick up and down.
Now we have to bring the picture and revive our 'waterfall'. The rectilinear way to do this is to store the image from the entire screen in a buffer, update it there and redraw every time new data appear. Not only is this solution extremely inefficient, we also don't have enough memory to store the whole picture. It would seem that the LCD itself has enough memory for this, and it should be able to do something interesting with it. Indeed, the study of datasheet allowed us to detect a previously unused scrolling command, which allows us to dynamically change the way the memory of the LCD controller is displayed on the screen. Let us imagine that a memory is a tape closed in a ring that you see under the glass of a screen. The Vertical Scrolling Start Address (0x37) command allows you to set the position on the ribbon corresponding to the upper edge of the screen. So, all we need to liven up the waterfall is to write a new spectrum to this position and scroll the memory tape. The corresponding code was added to the LCD driver, borrowed from the respected Peter Drescher , and adapted as described here . The only drawback of this approach: scrolling only works along the long side of the screen. Accordingly, only the short side is available for spectrum output.
Let us turn to the practical applications of our device. The first thing that is easy to see on the spectrum is the harmonics, that is, frequencies that are multiples of the pitch frequency. Especially a lot of them in the voice. There are also sounds that make musical instruments. It is easy to understand why the notes of neighboring octaves differ in frequency by 2 times: then the notes of a higher octave coincide in frequency with the second harmonic of notes of a low octave. They say that while they sound "in unison." It is a little harder to understand why there are 12 notes in the octave - seven basic (white keys on the keyboard of the piano) plus 5 additional (black keys). Additional notes are denoted by basic ones with sharp and flat signs, although in fact there is no difference between them and basic notes - all 12 notes form a geometric progression so that the ratio of frequencies between adjacent notes is equal to the root of the 12th degree out of 2. The meaning of such a division of the octave On notes in that for any note there are other notes that differ from it in frequency by one and a half times - such a combination is called a quint. The notes that form the quint sound in unison because the second harmonic of one note coincides in frequency with the third harmonic of the other note. The photo below shows the spectra of the notes Do and Sal, forming a quint, the matching harmonics are circled in yellow.
How is it that note 12? Since the notes form a geometric progression, we turn to logarithms. ln (1.5) / ln (2) = 0.58496 ... A close value is obtained for a fraction 7/12 = 0.583 ... That is, seven semitones (intervals between neighboring notes) turn out to be very close to the quinte - 1.498. Interestingly, the fraction 31/53 = 0.58491 .. gives a much greater accuracy, so the fifth is only 1.5 points away from 1.5 in the fifth decimal place. This fact did not go unnoticed, but musical instruments with 53 notes in an octave did not receive distribution. They are difficult to tune, they are difficult to play, and the percentage of people who can feel the difference with ordinary instruments is vanishingly small.
Lies here . IAR was used for compilation IAR Embedded Workbench for ARM 7.50.2. No other libraries are required for compilation.
')
Sound digitization
We want to receive a signal from a microphone, calculate its spectrum using a fast Fourier transform (FPU to help us) and show the result on the LCD as a 'color waterfall'. The sound power will be color coded. We will draw a row of pixels from the edge of the display, where the leftmost pixel will correspond to the minimum frequency, and the rightmost one will correspond to the maximum, while the previous picture will be shifted by one line, freeing up space for a new line. Our microcontroller is too complicated to start from scratch, so let's start with an example from the STM32Cube suite, which is called DFSDM_AudioRecord. What is DFSDM? This is Digital Filter for Sigma-Delta Modulation. The fact is that, unlike the good old analog microphones, the one that stands on the Discovery board does not generate a signal in the form of a voltage proportional to sound pressure, but in the form of a sequence of zeros and ones with a clock frequency of several megahertz. If you skip this sequence through a low pass filter, you get the same analog signal. In previous models, microcontrollers had to do a digital filter to get a sound signal in digital form. Now the microcontroller has a special module for this, and all that is required is to configure it at the start of the program. To do this, you can either delve into reading the documentation, or use a ready-made example. I went the second way. The following picture illustrates the internal structure of the DFSDM_AudioRecord program.
Digitized sound using DMA gets into the ring buffer. DMA causes an interrupt twice: once - when the buffer is half full, second time - when it is full. The interrupt routine simply sets the appropriate flag. The main () function, after initialization, executes an infinite loop where these flags are checked and, if the flag is set, the corresponding half of the buffer is copied. The example copies the data to another buffer, from where they, again using DMA, are sent to the headphone amplifier. I left this functionality by adding a sound spectrum calculation.
When a lot of tasks
The straightforward way to add new functionality to our code is to add more flags and write functions that will be called if these flags are set. The result is usually a mess of checkboxes, handler functions, and a global context that is forced to be global, since the solution of one task is divided into many small steps implemented by separate functions — event handlers. An alternative way is to entrust task management to the operating system, for example, FreeRTOS. This allows you to significantly simplify the logic due to the fact that each task is solved within its event-processing cycle, which interact with each other through the functions of the operating system. For example, we can add a data processing task in the form of a separate cycle that will wait for the data to be ready at the synchronization primitive - the semaphore. The semaphore is very simple: you can pass it if the flag is raised, and the flag is automatically lowered. Raise the checkbox in our case data source when it prepares data for another task. Similarly, you can create arbitrary chains of data source tasks and data consumer tasks in the same way as, for example, in the Linux operating system.
Of course, the simultaneous execution of tasks is an illusion, especially when the computational core is only one. In this case, we can say that we have a single thread of program execution by the processor. Semaphores, like other synchronization primitives, play the role of a magical rabbit hole, into which the flow of execution falls, in order to emerge in another task.
Connecting FreeRTOS to your project is quite simple. It is only necessary to replace the infinite loop, which usually ends the main () function in the microcontroller, with a call to osKernelStart (). After that, the compiler will explain to you exactly what it lacks for compilation. All actions that you previously performed in a loop need to be transferred to a separate task and registered with a call to xTaskCreate. After that you can add as many tasks as you like. It should be borne in mind that between calls xTaskCreate and osKernelStart it is better not to place any code that works with hardware, because here the system timer may not work correctly. Calling the operating system timer handler osSystickHandler () should be added to SysTick_Handler (), and two functions SVC_Handler and PendSV_Handler should be removed from their code, since they are implemented in the OS code. When registering tasks it is important not to make a mistake with the stack size. If it is too small, you will get a crash in the most unexpected places. When the stack overflows, the structure that describes the task suffers first. In IAR there is an opportunity to see the list of tasks. If you see in it a task with a changed name, then you need to increase the size of the stack.
Calculate the spectrum
To calculate the spectrum, we use the fast Fourier transform. The corresponding function is already in the library. It receives a buffer filled with complex data, and forms the result in the same place. Accordingly, at the input it needs a buffer, where the digitized sound alternates with zeros (complex part 0). At the output we get complex numbers for which we immediately calculate the square of the module, adding the squares of the real and imaginary parts. We do this for only half the buffer, because the spectrum is symmetrical. We would need the second half if we wanted to do the inverse transform, but for a simple display of the spectrum it is not needed. Some additional efforts are needed in order to be able to calculate the spectrum in different spectral ranges. To get a low-frequency spectrum, I accumulate data over several buffer read cycles, effectively reducing the audio sample rate, which is initially 44.1kHz. The result is 6 bands - 20kHz, 10kHz, 5kHz, 2600Hz, 1300Hz, 650Hz. To switch ranges, use the joystick and a separate task. The joystick also performs the functions of starting / stopping the waterfall, as well as adjusting the sensitivity. It is more convenient to show the spectrum in logarithmic units (decibels), since its dynamic range is usually very large, and on a linear scale we can only distinguish the strongest components of the spectrum. The logarithm is considered quite a long time even on FPU, so I replaced the real logarithm with a piecewise linear approximation, which is easy to get, knowing the format for representing a number in float32 . The high bit is a sign. The next 8 bits are the binary exponent plus 127. The remaining bits are the fractional part of the mantissa, with the integer part equal to 1 (omit the nuances of the denormalized numbers for simplicity). So, selecting the exponent from float32 and grabbing a few higher bits of the mantissa, you can get a good approximation of the logarithm. We will convert the resulting number using a pre-prepared table into an RGB code for display on the LCD. It turns out the color scale of 90 or 60 decibels. The volume level corresponding to this scale zero can be adjusted by pushing the joystick up and down.
Display a picture - about the benefits of reading datasheets
Now we have to bring the picture and revive our 'waterfall'. The rectilinear way to do this is to store the image from the entire screen in a buffer, update it there and redraw every time new data appear. Not only is this solution extremely inefficient, we also don't have enough memory to store the whole picture. It would seem that the LCD itself has enough memory for this, and it should be able to do something interesting with it. Indeed, the study of datasheet allowed us to detect a previously unused scrolling command, which allows us to dynamically change the way the memory of the LCD controller is displayed on the screen. Let us imagine that a memory is a tape closed in a ring that you see under the glass of a screen. The Vertical Scrolling Start Address (0x37) command allows you to set the position on the ribbon corresponding to the upper edge of the screen. So, all we need to liven up the waterfall is to write a new spectrum to this position and scroll the memory tape. The corresponding code was added to the LCD driver, borrowed from the respected Peter Drescher , and adapted as described here . The only drawback of this approach: scrolling only works along the long side of the screen. Accordingly, only the short side is available for spectrum output.
Why in the octave 12 notes?
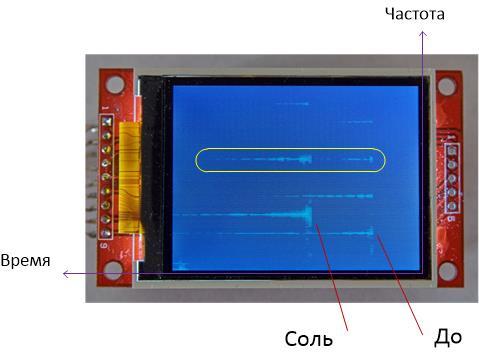
Let us turn to the practical applications of our device. The first thing that is easy to see on the spectrum is the harmonics, that is, frequencies that are multiples of the pitch frequency. Especially a lot of them in the voice. There are also sounds that make musical instruments. It is easy to understand why the notes of neighboring octaves differ in frequency by 2 times: then the notes of a higher octave coincide in frequency with the second harmonic of notes of a low octave. They say that while they sound "in unison." It is a little harder to understand why there are 12 notes in the octave - seven basic (white keys on the keyboard of the piano) plus 5 additional (black keys). Additional notes are denoted by basic ones with sharp and flat signs, although in fact there is no difference between them and basic notes - all 12 notes form a geometric progression so that the ratio of frequencies between adjacent notes is equal to the root of the 12th degree out of 2. The meaning of such a division of the octave On notes in that for any note there are other notes that differ from it in frequency by one and a half times - such a combination is called a quint. The notes that form the quint sound in unison because the second harmonic of one note coincides in frequency with the third harmonic of the other note. The photo below shows the spectra of the notes Do and Sal, forming a quint, the matching harmonics are circled in yellow.
How is it that note 12? Since the notes form a geometric progression, we turn to logarithms. ln (1.5) / ln (2) = 0.58496 ... A close value is obtained for a fraction 7/12 = 0.583 ... That is, seven semitones (intervals between neighboring notes) turn out to be very close to the quinte - 1.498. Interestingly, the fraction 31/53 = 0.58491 .. gives a much greater accuracy, so the fifth is only 1.5 points away from 1.5 in the fifth decimal place. This fact did not go unnoticed, but musical instruments with 53 notes in an octave did not receive distribution. They are difficult to tune, they are difficult to play, and the percentage of people who can feel the difference with ordinary instruments is vanishingly small.
Source
Lies here . IAR was used for compilation IAR Embedded Workbench for ARM 7.50.2. No other libraries are required for compilation.
Source: https://habr.com/ru/post/391311/
All Articles