The tale of how the MT8060 with Arduino made friends
 This article is dedicated to the air quality monitor MT8060 with a carbon dioxide sensor and the ability to read its readings on PC and Arduino.
From this article you will learn:
- How I disassembled this device.
- How to connect a CO2 sensor to an arduino without disassembling it.
- How to read data, and how to convert to the form in which they are displayed on the screen (and even in a larger range of values).
- Sketch and cable routing included.
Caution traffic!
The essence of the problem
Once having come on Geektimes I found several articles about the sensor of carbonic MT8060 from DUJET. In the comments there was an active discussion of the possibility of connecting this device to a computer for receiving data. In the comments, I could not share my experience on this issue (there was no R & C mode yet), so I decided to write an article, at the same time opening the question in more detail and with “pictures”.
')
Unfortunately, this device modification does not have the ability to transfer data via USB. But there is a diagnostic port on which you can read all the data, as well as calibrate the device (probably). The following section describes how to get to this port and how to connect to it. Repeating this is not necessary - at the end of the next section, all the data are given in order to connect to the port without disassembling the device.
Disassembling and exploring connectivity
The photos were made on the camera of the phone, sometimes not very high quality, I did not try hard because I did not think that I would write an article, but I did just in case.
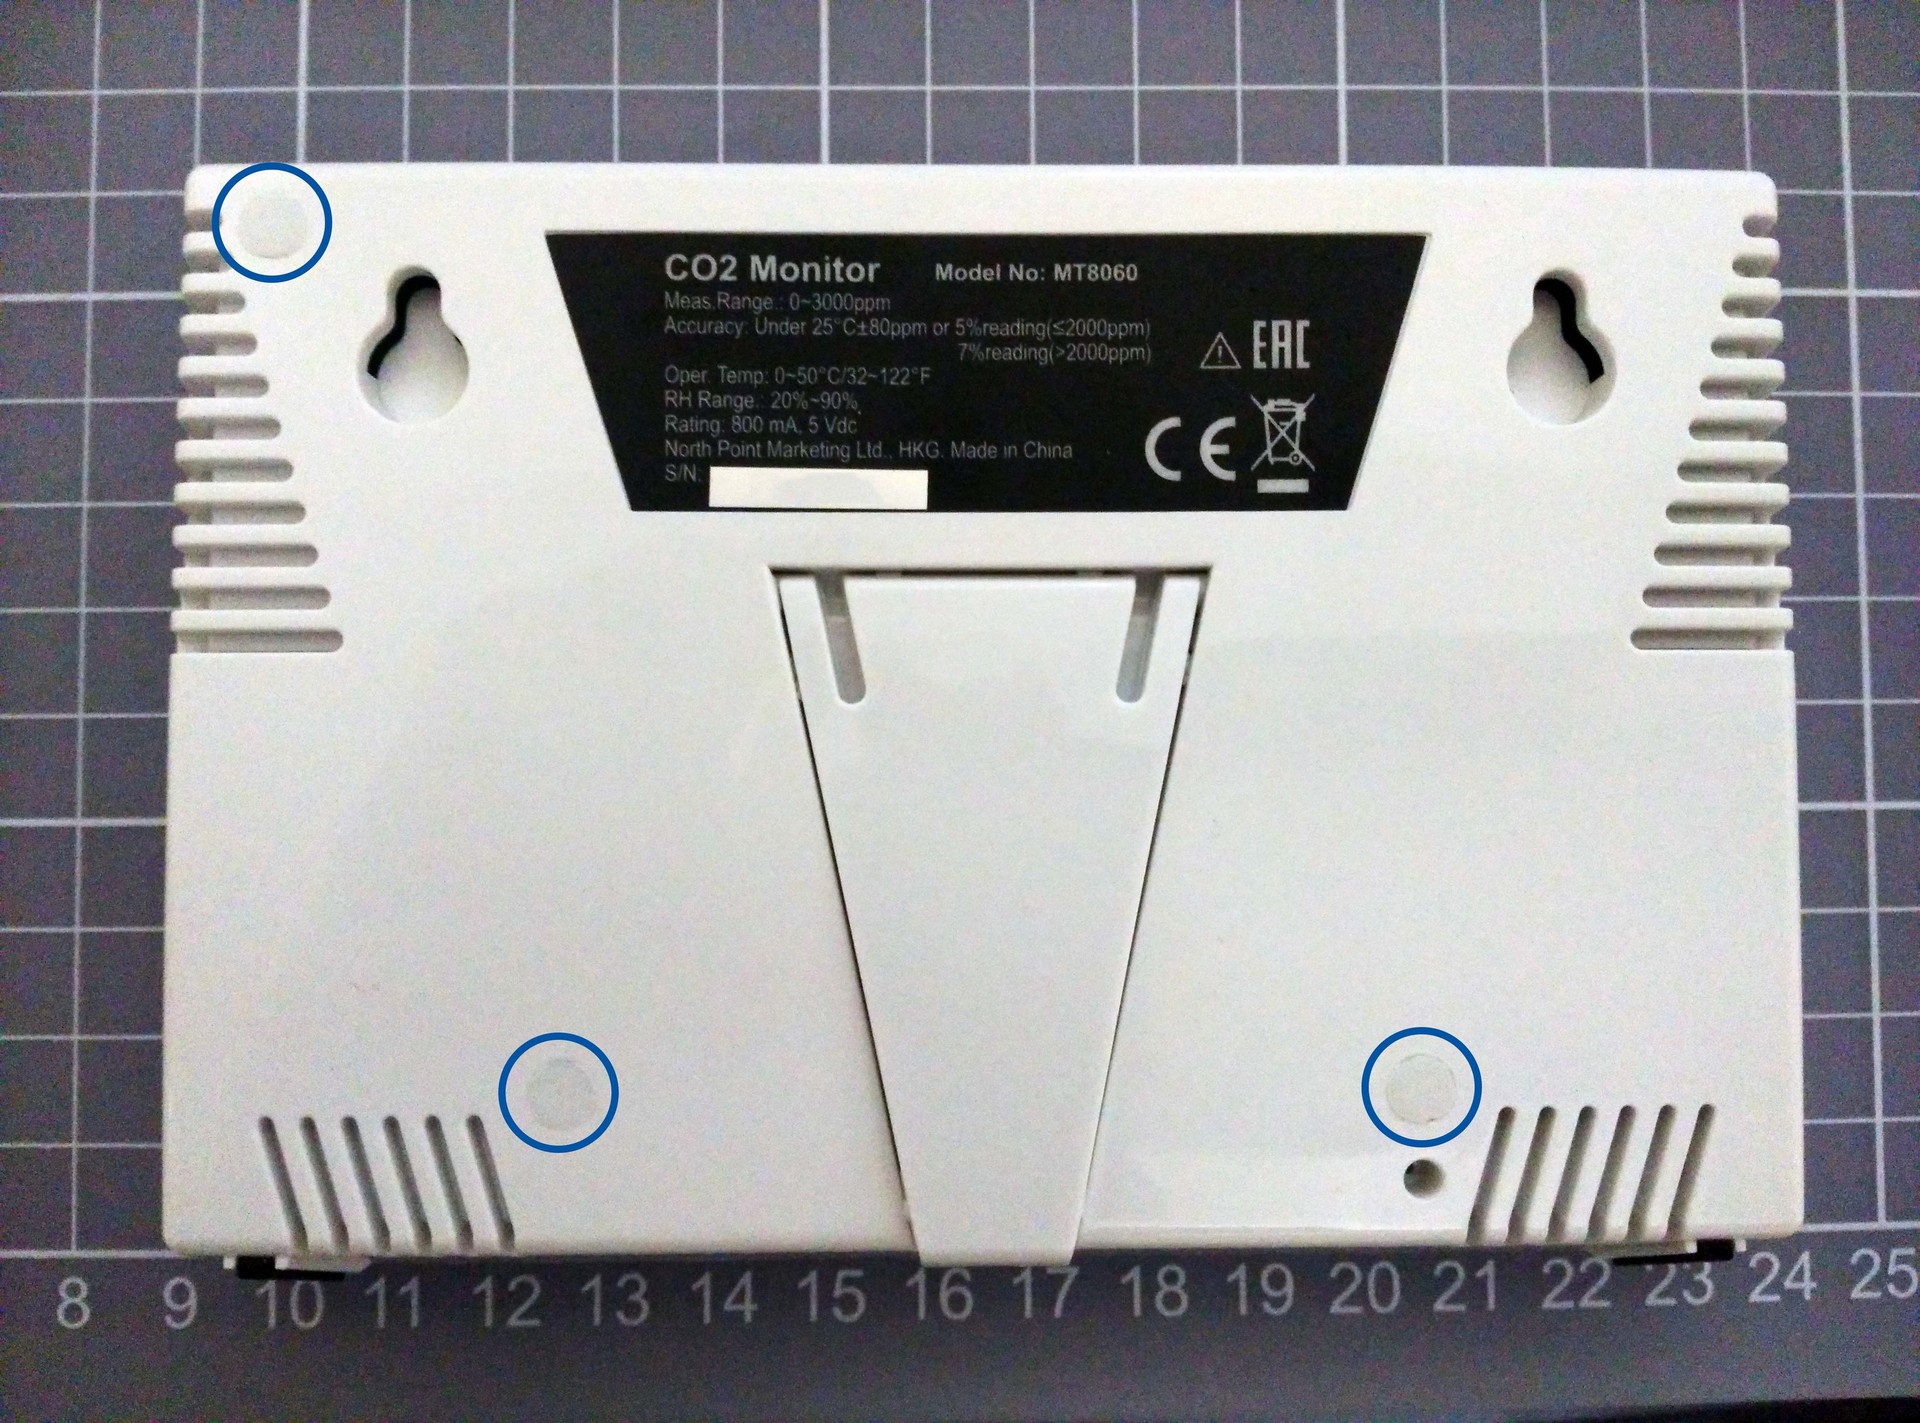
So, on the back there are three rubber plugs, behind which there are three bolts. Plugs can be obtained with tweezers, or hooked with a needle.
In addition to the bolts, the two halves of the case also hold on to the latches, which are located along the entire perimeter of the case. To divide the halves, it is enough to hold a toothpick around the perimeter of the case; there was enough gap of half a millimeter to separate the latches. Then we gently open the case and see that there is a rubber hose from the chip to the back cover, and it is possible to damage the fasteners and chips to which it is attached during sudden movements.

Now you can see the back side of the device's PCB, diagnostic leads and an RJ45 connector. Googling the notation that was applied to the scheme, I went to the article CO2MeterHacking , which dealt with a similar device. Having connected, in the same way as described in the article, and running the proposed one there, I received the cherished data, which partially coincided with the data displayed on the screen - the main goal was achieved.
In addition, the wiring of these contacts to the RJ45 connector was noticeable. Looking at the wiring, and ringing, just in case the contacts, I drew a wiring diagram.

Designation and assignment of contacts, the following:
- C (Clock) - clocking signal.
- D (Data) - data signal.
- G (Ground) - land.
- V (V DD ) - power supply + 3V.
The pinout came up for a standard connector with four conductors, and for testing purposes such an arduino-compatible connector was assembled.

The device can be assembled, but I previously removed the stub covering the outside access to the RJ45 port. It is fastened on four snaps, which I gently bent off from the inside, but I think you can get it just by hooking it outside, without having to disassemble the device. The photo below shows how it holds and what the latches look like.

Read and decode parameters
Further studies were carried out on the assembled device, with an "open" port, and they were purely software.
Connect the orange wire (pin D ) to the pin D3 arduino, white-green (pin C ) to the pin D2 of the arduino-compatible card.

Data is transmitted via SPI protocol. For reading and decoding data, a method and a simple sketch was written that outputs to the serial port the values of humidity, temperature and carbon dioxide concentration.
After starting the sketch, the serial port monitor begins to receive data identical to the readings on the device screen at intervals of once per second or so.

Despite the fact that the moisture level on the device is indicated by the Lo value, when reading through the port, they are quite self-displayed as values less than 20. It is not clear why this was done, probably in order not to make another “traffic light” on humidity and output Lo if the humidity is already critically low.
That's all: data comes in every second, you can build graphs in high resolution, or write any other logic. For example, I made an alert on the Telegram about the output of indicators beyond the normal range, which eliminates the need to constantly monitor the indicators. I also set up the Mi Band for the corresponding notifications - it’s convenient if the readings exceed the limit at night and you need to turn off the humidifier or ventilate. You can go further, and integrate these indicators with an automatic ventilation system, or to a smart outlet, in which the same humidifier is connected - further restrictions only by imagination.
Thinking out loud about wireless data transmission
The article on revspace proposes to use wireless data transmission, in it you can also find an example of a sketch for sending data using the transmitter NRF24L01 +. In addition, inside the case there is enough free space, as it seemed to me, which is enough for a small controller and a wireless communication module. In addition, there is also a 3V power supply inside ( G and V pins), which eliminates the need to use third-party power sources, and 5V from the USB port can be used if 3V is not enough. If I decide to implement some kind of wireless data transmission method, I will write another article about this.
That's all for now, thank you for your attention!
Links and sources
- CO2MeterHacking
- Sensor documentation ZG01
- Original sketch with wireless data sending
- My version of the sketch
The author of the article is not responsible for attempts to repeat or apply the results presented in this material!
Source: https://habr.com/ru/post/390607/
All Articles